


1. INTRODUCTION
In the past few years, experiments have been successful in measuring the CO2 concentration of air trapped in bubbles in old polar ice. In this way, it has been possible to reconstruct the anthropogenic CO2 increase, and it has been found that atmospheric CO2 levels were lower in glacial than in postglacial time. There are also indications of natural CO2 variations during the past millennium (Reference Raynaud and BarnolaRaynaud and Barnola 1985), and we present data here that point to a CO2 input into the atmosphere during the thirteenth century. For a better understanding of the observed variations, it is of interest to know the carbon-isotopic composition of the trapped C02. Since biomass and fossil fuels have relatively low δ13C values, of about –25‰ (compared with δ13C % –7‰, for atmospheric CO2), a CO2increase due to input of biospheric or fossil fuel CO2 is accompanied by a decrease in δ13C. On the other hand, a CO2 change due to a net transfer between ocean and atmosphere is expected to have little influence on δ13C.
We have developed a method for extracting the CO2 from air trapped in ice and for measuring its carbon- and oxygen-isotope ratios by mass spectrometry (see section 2). We applied this method in order to determine the δ13C trend accompanying the CO2 increase over the past 200 years (Reference Friedli, Lótscher, Oeschger, Siegenthaìer and StaufferFriedli and others 1986). In this paper (section 3) we reconsider a series of CO2 and δ13C results obtained from samples spanning the period of about 1000–1800 A.D., taken from an ice core from the South Pole (Reference Friedli, Moor, Oeschger, Siegenthaìer and StaufferFriedli and others 1984).
In addition to δ13C, δ18O was routinely determined in our measurements. Atmospheric CO2 has a δ18O value (versus PDB standard) near 0‰. However, we found values in CO2 extracted from ice of c. –20 to –30‰o, which shows that the oxygen-isotope composition must have changed between the time the air was trapped in the firn and the time it was measured in the laboratory. We suggest that CO2 equilibrated isotopically with the ice – in other words, that an exchange of oxygen atoms took place. This is discussed in section 4.
2. EXPERIMENTAL METHODS
The procedures for extracting the enclosed air from the ice and for separating CO2 from air have been described previously (Reference Moor and StaufferMoor and Stauffer 1984, Reference Friedli, Moor, Oeschger, Siegenthaìer and StaufferFriedli and others 1984). Briefly, the first step involves crushing the ice sample (typically about 700 g) in an evacuated, all-metal extraction system at –20 °C and collecting the air by condensation at a temperature of 15 K. After measurement by gas chromatography of the CO2 concentration, CO2 is separated at liquid-nitrogen temperature; volumetric determination of the quantity of CO2 makes it possible to check the separation efficiency, or, where no result from gas chromatography is available, to measure the CO2concentration. The CO2 sample (typically 15 μl) STP) is then transferred to the mass spectrometer (MAT 250), which is equipped with a small-volume inlet system. Achieved overall precision (1 standard deviation) for δ13C is O.10‰ in good conditions. For δ18O the standard deviation is larger, nearly 1‰o. The reason must be oxygen-isotope exchange of the CO2 with water films adsorbed at the walls of sample-containers and extraction systems. (The precision of the 18O analysis by mass spectrometry alone is O.1–0.2‰ for samples of about 15 μl STP.)
The results of mass spectrometry have to be corrected to take into account the influence of N2O, which is separated from air simultaneously with CO2 in our freezing-out method. N2O has the same main isotopie masses (44, 45 and 46) as CO2 and, if the N2O/CO2 mixing ratio is known, the correction can be determined (Reference Mook and HoekMook and van der Hoek 1983). We have determined the corrections for our mass spectrometer, and we have developed a method for approximate determination by mass spectrometry of the N2O/CO2 ratio, by measuring the abundance of mass 30 which corresponds to the molecule fragment NO+ (Reference Friedli and SiegenthaìerFriedli and Siegenthaler, in press). In the course of our work we found that N2O was produced in a Penning cold-cathode manometer (it must have been formed from N2 and O2 in the electric discharge). For the early isotope results (samples from South Pole) we cannot give a precise correction for this effect, so they are less accurate than our later data (samples from Siple Station).
For testing the whole experimental procedure, we routinely processed artificial standard air, and during some measuring periods we noticed systematic deviations in the isotope results of the order of 0.1–0.2‰, the cause of which we could not identify. The question thus arises whether δ13C results for samples should be corrected accordingly or not. Such deviations found in "standard-air" samples affect the data for the South Pole series, as discussed in the next section. For the Siple Station series (δ13C trend over the past 200 years) (Reference Friedli, Lótscher, Oeschger, Siegenthaìer and StaufferFriedli and others 1986), the standard-air measurements fortunately did not exhibit systematic deviations, only the usual scatter around the mean.
3. CO2 and δ13C RESULTS FROM A SOUTH POLE ICE CORE
Figure 1 shows CO2 results, obtained by gas chromatography and by volume, and δ13C results for samples from a core drilled in 1982 at the South Pole; the 13C data have already been published by Reference Friedli, Moor, Oeschger, Siegenthaìer and StaufferFriedli and others (1984). Between A.D.1210 and 1310 the CO2 concentration increases from 280 to 286 ppm and slowly decreases afterwards. The gas ages given here are based on the assumption that the air in the firn is well mixed. Because of uncertainties about this assumption and about the ice dating, we estimate the error in the gas ages to be about half a century. With reference to the analytical precision, this increase is significant, and it is shown independently by the gas-chromatography and the volumetric concentration measurements. The δl3C data in Figure 1b were corrected by +0.25‰ to allow for the presence of N2O, with an assumed N2O concentration of 285 ppb (the data given in Reference Friedli, Moor, Oeschger, Siegenthaìer and StaufferFriedli and others (1984) were not corrected). In Figure 1c, average δ13C values for the four groups of samples centering on A.D. 1210, 1310, 1430 and 1550 are shown. As mentioned above, the standard-air isotope results were not constant during that period, so standard-air corrected data are also given in Figure 1c. These corrected data vary antiparallel to the CO2 concentration, reaching a minimum in A.D.1310. It is not possible to decide whether the δ13C data are more reliable with or without standard-air correction, so we will consider both possibilities.
Analytical results versus average gas age for samples from the South Pole ice core, (a) CO2 concentration, measured by gas chromatography (triangles) and volumetrically (squares). The solid line connects average values for different age intervals, (b) δ13C results (standard-air corrected, cf. text); the solid line connects average values, (c) Average δ13C results, solid line: standard-air corrected; dashed line: not standard-air corrected.

If the CO2 results reflect a true atmospheric variation (which can only be determined by measuring more samples from other ice cores covering the same period) then an input of CO2 into the atmosphere must have occurred in the thirteenth century. In the following we will estimate the size of this input. First, the fact must be taken into account that the air enclosed at a specific depth is not the same age in all the bubbles, because closing of pores at the firn–ice transition occurs over a finite range of densities. Reference Schwander and StaufferSchwander and Stauffer (1984) estimate that at the South Pole the width of the gas-age distribution, defined as the time during which between 10 and 90% of the final volume of bubbles were trapped, is 220 years. Therefore, variations in atmospheric composition which occur over characteristic times less than 220 years will be suppressed in the ice. Reference Neftel, Oeschger, Staffelbach and StaufferNeftel and others (in press) developed a method for back-calculating the atmospheric concentration history from the ice-core record; by frequency filtering they avoid unrealistic high-frequency oscillations in the atmospheric concentration. Figure 2 shows the result of such a back-calculation, using a Gaussian curve for the age-distribution curve of the trapped air. The calculated atmospheric increase is 10 ppm instead of the measured 6 ppm, and there is a slight decrease in concentration before the increase; if the atmospheric CO2 level had been constant before increasing, then the air with the average trapping-time of A.D.1210 should, because of the broad age distribution, already have had slightly enhanced concentration.
The increase by 10 ppm corresponds to a change in the atmospheric CO2 mass of about 20GTC (1 GTC = 109metric tons of carbon). In addition, the enhanced atmospheric concentration must have brought about a net CO2 flux into the ocean. If Na is the atmospheric CO2 mass, deduced from the ice-core measurements, the input rate p(t) can be calculated from a CO2 balance for the atmosphere:

We calcultated the induced flux into the ocean, Fao, using the box-diffusion model of Reference Oeschger, Siegenihaler, Schotterer and GugelmannOeschger and others (1975), calibrated by means of bomb-produced 14C and starting from an assumed steady state at 280 ppm; the procedure has been described in detail by Reference Siegenihaler and OeschgerSiegenthaler and Oeschger (1987). This is how we calculate p(t), which may represent an input from land vegetation or soils or from a restricted part of the world ocean.
Atmospheric concentration, calculated by deconvolving the ice-core record for the finite time interval of air occlusion.

In Figure 3, the input rate p(t), calculated from the model, and the cumulative input
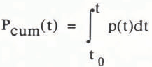
are shown. According to these results, a cumulative input of about 45 GT C over the period A.D. 1200–1350, or about 35GT C net from A.D. 1000 to 1350, would have been necessary to cause the observed concentration change, and the annual emission amounted to up to 0.4 GT C year−1. (For comparison: nowadays about 5 GT C year1- of CO2 are produced by fossil-fuel burning.)
(a) CO2 input rate (GT C year−1) to produce the atmospheric CO2 variations (cf. Fig. 2), calculated using the carbon-cycle model. (b) Cumulative CO2 input (GTC). (c) Solid curve: atmospheric δ13C variation calculated from the model, for the assumption that the input was of biospheric origin; squares: observed δ13C values (standard-air corrected).

Before discussing the results further, we must emphasize that all the estimates are based on the hypothesis that the CO2 variation observed in the ice cores indeed reflects an atmospheric change. However, we cannot exclude the possibility that it is an artefact, due to the enclosure process or ice–gas interaction, until further high-precision measurements have been made on a different ice core. This should be kept in mind for what follows.
The presumed input in the thirteenth and early fourteenth centuries could originate from the biosphere or from some region of the ocean. The amount of roughly 40 GT corresponds to about 6% of the global pre-industrial live land biomass, and to about 2% of the total biomass including soils, which are quite appreciable fractions. The period in which the CO2 input would have occurred coincides roughly with a late-medieval warm phase as registered in England, so one might speculate that the enhanced temperature could have led to higher soil respiration rates and thus to a net transfer to the atmosphere of carbon from soils. It has been well established in experiments that on a short-term (monthly) basis CO2 production in the soil is correlated with (monthly) temperature (Reference Dörr and MünnichDörr and Münnich 1987), but it is not clear whether the net production also varies significantly with temperature over the time-scale of a century. In theory, human activity like deforestation and agricultural expansion in Europe and the Mediterranean region could also be responsible for the increase in CO2, but the cumulative input seems rather large for that to be the case.
A biospheric input would cause a decrease in δ13C in atmospheric carbon dioxide. Figure 3c shows the isotopie variation calculated with the carbon-cycle model, based on the assumption that the CO2 input of Figure 3a consisted of biospheric CO2 with δ13C = –25‰. The measured δ13C values (shown as squares in Fig. 3c, standard-air corrected data) agree qualitatively with the curve calculated on the model, but show a larger variation. A deconvolution for the finite air-trapping interval does not make much sense because there are not enough data, but the atmospheric variation must have been even larger than that. The starting δ13C value for the model has been chosen to match the observed values approximately. The data which had not been standard-air corrected (cf. Fig. 1), however, would not exhibit a decrease at A.D. 1310.
The presumed CO2 input might also be of oceanic origin, due to a fluctuation in the carbonate chemistry of surface waters in response to a change in the circulation or climate of the ocean. Such a change would certainly seem to be possible. A high-precision record of atmospheric δ13C could provide a test: no measurable δ13C change would have occurred if the CO2 input had been of oceanic origin, since carbon in surface water and in the atmosphere are in isotopie equilibrium. Since we are not absolutely certain that the standard-air correction can indeed by applied to our data, we cannot exclude the possibility that the δ13C of the atmosphere was constant, i.e. that the CO2 input came from the ocean.
Another possibility might be that the input was of volcanic origin, e.g. due to the large eruption in A.D. 1259 (Reference Langway, Clausen and HammerLangway and others 1988, this volume). Average volcanic CO2 emissions are estimated at 0.07 GT C year−1 (Reference Berner, Lasaga and GarreisBerner and Others 1983), of which, however, a large part goes directly into the ocean. Thus the 40 GT C would correspond to the amount emitted on average into the atmosphere over 1000 years or more. A direct estimate indicates a CO2 amount of 0.005 GT C for the large eruption of Lakagigar (Laki) in 1783 (Reference ThorarinssonThorarinsson 1969). Thus a volcanic origin does not appear to be likely for the production of 40 GTC within a century or less.
In conclusion, the data from the South Pole ice core point to a possible net injection into the atmosphere of about 40 GT C of biospheric, perhaps of oceanic, origin over the period A.D. 1200‰1350. We cannot state with certainty that this input really did occur, since we cannot exclude the possibility that the observed CO2 increase is an artefact due to some interaction between ice and trapped air, nor can we check whether the applied δ13C correction is really appropriate. However, the CO2 change in the ice is clearly outside the range of experimental error, and the corrected δ13C data are consistent with the assumption that the concentration changed as the result of carbon input from the biosphere. The question of natural CO2, variations during the Holocene is very important for the understanding of the global carbon cycle, and our data show that a search should be undertaken for such variations by means of high-precision studies on other ice cores from suitable locations like Siple Station.
4. δ18O OF CO2 FROM POLAR ICE
4.1 Equilibrium 18O/16O fractionation between CO2 and ice
As mentioned in the Introduction, we found δ18O values of –20 to –30‰c (versus PDB) in CO2 extracted from polar ice, instead of about 0‰ as observed in modern atmospheric CO2 (Reference Mook, Koopmans, Carter and KeelingMook and others 1983, Reference Friedli and SiegenthaìerFriedli and others, in press). Figure 4 shows the δ18O of CO2, and of the corresponding ice samples from which the CO2 was extracted, for the ice core from Siple Station, Antarctica. For this core, the CO2 and δ13C trend of the past 200 years was reconstructed (Reference Neftel, Moor, Oeschger and StaufferNeftel and others 1985, Reference Friedli, Lótscher, Oeschger, Siegenthaìer and StaufferFriedli and others 1986). The horizontal axis gives the estimated mean time of gas enclosure. Note that the results for CO2 are given versus PDB-CO2, whereas those for ice are given versus Standard Mean Ocean Water (SMOW). The relation between the two standards is explained below,
From top to bottom: δ18O (versus PDB standard) of CO2 from the Siple Station ice core (squares; the solid line connects those results for which the δ18O in ice has also been measured); δ18O of hypothetical CO2 in isotopie equilibrium with the ice (dashed line); δ18O (versus SMOW standard) for ice (triangles). Horizontal axis: average gas age.

The isotopie composition of the CO2 samples is clearly correlated with that of the surrounding ice. A plausible explanation is that there was an isotopie equilibration between CO2 and ice in the ice sheet. Isotopie equilibrium between two substances, I and 2, can be described by a (temperature-dependent) fractionation factor α: α(1–2) = R1/R2, where Ri = 18O/16O ratio of substance i. For obvious reasons, a(CO2–ice) has never been measured, but it can be estimated from equilibrium-fractionation factors between other pairs of substances, noting that if there is thermodynamic equilibrium between substances 1 and 2 and between substances 2 and 3, then there must also be equilibrium between substances 1 and 3. Thus we can write:

The αs at the right-hand side have all been determined experimentally, with the following results (T = absolute temperature):

Bottinga, quoted by Reference Friedman and O’NeilFriedman and O’Neil 1977).

(Reference MajoubeMajoube 1971[a])

The last equation is adapted from Reference MajoubeMajoube (1971[b]), but the constant term has been changed by 0.56 × 10⁻³ so that Equations 4 and 5 yield α(ice–water) = 1.00291 at 0°C, which is the result of our own experiments (Lehmann and Siegenthaler, in preparation).
According to Equation 2 we then obtain:

By calculating α(CO2–ice) we have extrapolated the two fractionation factors (3,4) (which were measured only for positive Celsius temperatures) for temperatures <0°C. Obviously, some uncertainty is introduced by this extrapolation. We estimate that the error of α(CO2–ice) should be smaller than ±1‰ at temperatures down to at least –35 °C.
Since δ18O of CO2 is expressed versus the standard PDB, it is convenient to take this into account by dividing δ(CO2–ice) by the conversion factor between PDB-CO2 and SM0W-CO2 of 1.04142 (see Reference Friedman and O’NeilFriedman and O’Neil 1977): δ*(CO2–ice) = δ(CO2–ice)/1.04142.
Values for α* are given in Table I for several temperatures, chosen to include the mean annual temperatures of Siple Station, Antarctica (–24°C), South Pole (–51°C) and an estimated temperature of about –35°C at Byrd Station, Antarctica, 50 000 years ago (the approximate age of our samples).

4.2 Observed δ18O relation between CO2 and ice
In Table II, average δ18O values are given for CO2 and for ice. For Siple Station, δ18O(CO2) includes only values where δ18O(ice) was also determined (which is the case for only about half of all the samples). For South Pole and Byrd Station, we had to estimate δl8O(ice) from curves measured by Reference Grootes and StuiverGrootes and Stuiver (1988, this volume) (South Pole) and Reference Johnsen, Dansgaard, Clausen and LangwayJohnsen and others (1972). Also in Table II, the observed ratios of the 18O/16O ratios in CO2 and ice are compared with the (adjusted) fractionation factors α* from Table I. In addition, the degree of equilibration is indicated, defined by

where δ18O(atm) = 0‰ is the value in atmospheric air and δ18O(eq) is the expected value of CO2 in isotopie equilibrium with the ice. The degree of equilibration for the three stations is roughly between 90 and 100%. The δ18O values of CO2 at Siple Station are well correlated with δ18O(eq) (Fig. 4). From all these results, we conclude that the oxygen-isotope ratio in CO2 extracted from polar ice is essentially determined by equilibration with the surrounding ice. This is surprising, since we would not expect a significant exchange with solid ice.

Before discussing the results further, we must consider the possibility that the equilibration took place in the laboratory, with water vapour originating from the ice sample, during the time between air extraction and CO2, separation (typically 3–5 d, sometimes up to a few weeks). Indeed, δ18O measurements on atmospheric CO2 samples exhibit relatively large scatter that must be due to oxygen-isotope exchange with water films on the walls of the sample-flask during storage (Reference Francey, Goodman, Francey and ForganFrancey and Goodman 1985). However, our own results on tropospheric air samples, which were stored for periods from days to weeks (Reference Friedli and SiegenthaìerFriedli and others, in press), showed that the degree of isotopie equilibration was always very small, generally of the order of 10%. The possibility of oxygen-isotope exchange can also be checked from our tests, in which gas-free single-crystal ice were milled in the presence of artificial standard air. Although the δ18O values of CO2 from such samples exhibited considerable scatter (lσ = 0.9‰), they were not shifted systematically towards the expected value for isotopie equilibrium with ice-derived water vapour. We conclude that exchange with water films at sample-container walls probably affects the reproducibility of the δ18O results of CO2, but does not determine the absolute values. Therefore the δ18O shift in CO2 must indeed be due to the exchange of oxygen atoms between CO2 and ice.
Reference Bender, Labeyrie, Raynaud and LoriusBender and others (1985) measured the δ18O of molecular oxygen trapped in old ice and found a shift from glacial to postglacial time. In connection with our results for CO2, it is important to emphasize that O2 and CO2 behave differently with reference to isotopie exchange. CO2 equilibrates isotopically with liquid water over a short period, whereas it is well known that atmospheric oxygen is not in isotopie equilibrium with ocean water. Obviously, O2 is much more inert than CO2 with reference to exchange with water, and the results of Bender and others suggest that this is also the case for exchange with ice.
4.3 Implications for CO2–ice interaction
The amount of ice needed to equilibrate the included CO2 is quite small: in 1 kg of ice, typically 90 ml STP of air are trapped, or, for a concentration of 280 ppm, 1.1 × 10⁻⁶mol CO2, so that the mole ratio CO2/ice is 2 × 10⁻⁸. For a bubble density of 600 per cm3 of ice (Reference SchwanderSchwander unpublished) and a typical value of 90 ml STP of enclosed air per kg of ice, the radius of an average bubble is 0.17 mm at a pressure of 7 bar (actually, the bubble pressure varied between I and about 15 bar for the samples from Siple Station as well as those from the South Pole), Under these conditions, an ice shell of 0.1 nm thickness around each gas bubble contains the same number of H2O molecules as there are CO2 molecules in the bubble at a CO2 concentration of 280 ppm. For the observed degree of equilibration of ≥90‰, the CO2 must equilibrate with an amount of H2O at least %10 times larger (on a molar basis), i.e. with an ice shell around the bubble ≥1 nm thick. This is only of the order of ten molecular layers, and even that is small compared with the diffusion length of a H2O molecule in ice during 1 s,
 % 35 nm (with D % 6 x 10¹⁶ m2 s−1 at –20 C (Reference HobbsHobbs 1974)). Thus the CO2, molecules clearly can come into contact with more than enough H2O molecules to equilibrate; the question is whether they react with them at all.
How fast is the observed equilibrium achieved? There is no shift away from the equilibrium value in the Siple Station series when progressing from older to younger samples (Fig. 4), so the equilibration time at –24 °C seems to be short when compared with the age of the youngest air sample, which is about 70 years.
In liquid water the isotopie equilibration proceeds via the hydration reaction, CO2 + H2O — H2CO3. Equilibration in water is certainly much faster than in ice and the question arises, whether a liquid-like layer at the air bubble-ice interface could be responsible for the isotopie equilibration process. According to Reference HobbsHobbs (1974), the thickness of the liquid-like layer is of the order of 1 nm at –7°C. It decreases rapidly with decreasing temperature and is negligible at the ice temperature prevailing at the South Pole as well as at Siple Station. However, we cannot fully exclude the possibility that equilibration in the liquid-like layer played a role during storage or transport of the ice cores at temporarily higher temperatures.
ACKNOWLEDGEMENTS
We wish to thank K Hãnni for his help with the mass-spectrometry measurements, and M Lehmann for discussion about oxygen-isotope fractionation factors. C Hammer suggested considering a volcanic origin for the thirteenth-century CO2 input. This work was supported by the Swiss National Science Foundation.



