

Green bonds are conventional debt instruments whose proceeds are earmarked for environmentally beneficial projects, distinguished by use-of-proceeds disclosure and external verification. In countries that issued sovereign green bonds, corporate issuance came first—by a median of three years. France saw corporate green bonds in 2012 but sovereign issuance in 2017; the United Kingdom waited from 2014 to 2021; Brazil and India had corporate issuance from 2015 but sovereign entry in 2023. The pattern holds across advanced and emerging economies and survives disaggregation by private versus government-linked issuers.
The sequencing contradicts the contemporary policy consensus that sovereign issuance anchors debt markets.Footnote 1 Yet this is no historical universal: the Bank of England helped organize seventeenth-century English sovereign debt, and nineteenth-century US bond markets emerged through an intertwined mix of federal, state, municipal, and corporate issuance. The puzzle is not that private debt markets sometimes precede sovereign ones, but that green bonds invert the state-led sequence that contemporary development policy and scholarship lead us to expect.
The contrast with state-led climate governance is striking. The Paris Agreement produced limited direct effects on corporate strategy even in convertible sectors; by contrast, the original Green Bond Principles, drafted by four banks in 2014, helped create the procedural infrastructure through which green bonds became a scalable sovereign asset class.Footnote 2
The corporate-led pattern sits within an established literature on bottom-up private governance.Footnote 3 The dominant explanation for green bond market growth has emphasized the demand side: investor appetite for sustainable assets and issuer incentives to signal environmental commitment.Footnote 4 What I ask is the supply-side counterpart: through what institutional channel does privately built market infrastructure reach sovereign borrowers? The bottom-up governance literature largely leaves this transmission mechanism implicit. This research note documents it.
The four banks that drafted the Green Bond Principles (GBP) in 2014—Bank of America Merrill Lynch, Citi, Crédit Agricole CIB, and JPMorgan Chase—were central to global debt underwriting. Their early contracting was concentrated among private corporations, where repeated transactions built verification practices, pricing conventions, and investor networks. They later served as lead managers when sovereigns entered, transferring accumulated expertise across the public–private divide. The mechanism is not norm emulation or market pressure but financial intermediaries’ dual position across private and sovereign debt markets.
Two complementary processes operate. Infrastructure accumulation: repeated corporate transactions build the procedural infrastructure—documentation templates, verification capacity, investor familiarity—that sovereigns later access at lower marginal cost. Institutional intermediation: the banks that built that infrastructure also underwrite sovereign entry deals, transferring expertise from prior corporate transactions to first-time sovereign issuers.
Across 111 countries from 2012 to 2024, the Cox proportional hazards model shows that cumulative private corporate issuance accelerates sovereign entry—each additional corporate bond raises the hazard by 2.1 to 2.2 percent. The model also shows that agency issuance, a government-linked alternative to direct sovereign borrowing, delays sovereign entry. Bank-level triangulation shows that founding-bank presence at sovereign entry reflects green-bond-specific expertise transfer rather than baseline dominance in sovereign debt underwriting.
The green bond market is small relative to conventional sovereign debt—USD 500 billion in annual issuance against a USD 140-trillion market—but its political significance exceeds its scale. Sovereign green bonds have become a primary mechanism for operationalizing Paris Agreement commitments. They are not merely conventional sovereign borrowing relabeled: they are issued in addition to, rather than in place of, conventional sovereign debt, and they tag categorically distinct portfolios other public-sector issuers do not fund.Footnote 5
The Green Bond Puzzle
The contemporary policy consensus holds that sovereign issuance should precede private entry. Sovereign bonds serve as risk-free reference points, anchoring pricing and providing infrastructure—primary dealer networks, secondary trading systems, regulatory frameworks—on which corporate borrowing depends.Footnote 6 International financial institutions advise developing countries to establish sovereign programs as foundations for broader capital market development.Footnote 7 On this logic, green bond markets should follow the same sequence.
Empirical Departure in Green Bond Markets
Green bond markets, however, depart from this expectation.Footnote 8 Although the first labeled green bonds were issued by multilateral development banks (MDB) beginning with the European Investment Bank in 2007 and the World Bank in 2008, subsequent expansion was driven by corporate and financial issuers rather than sovereigns.
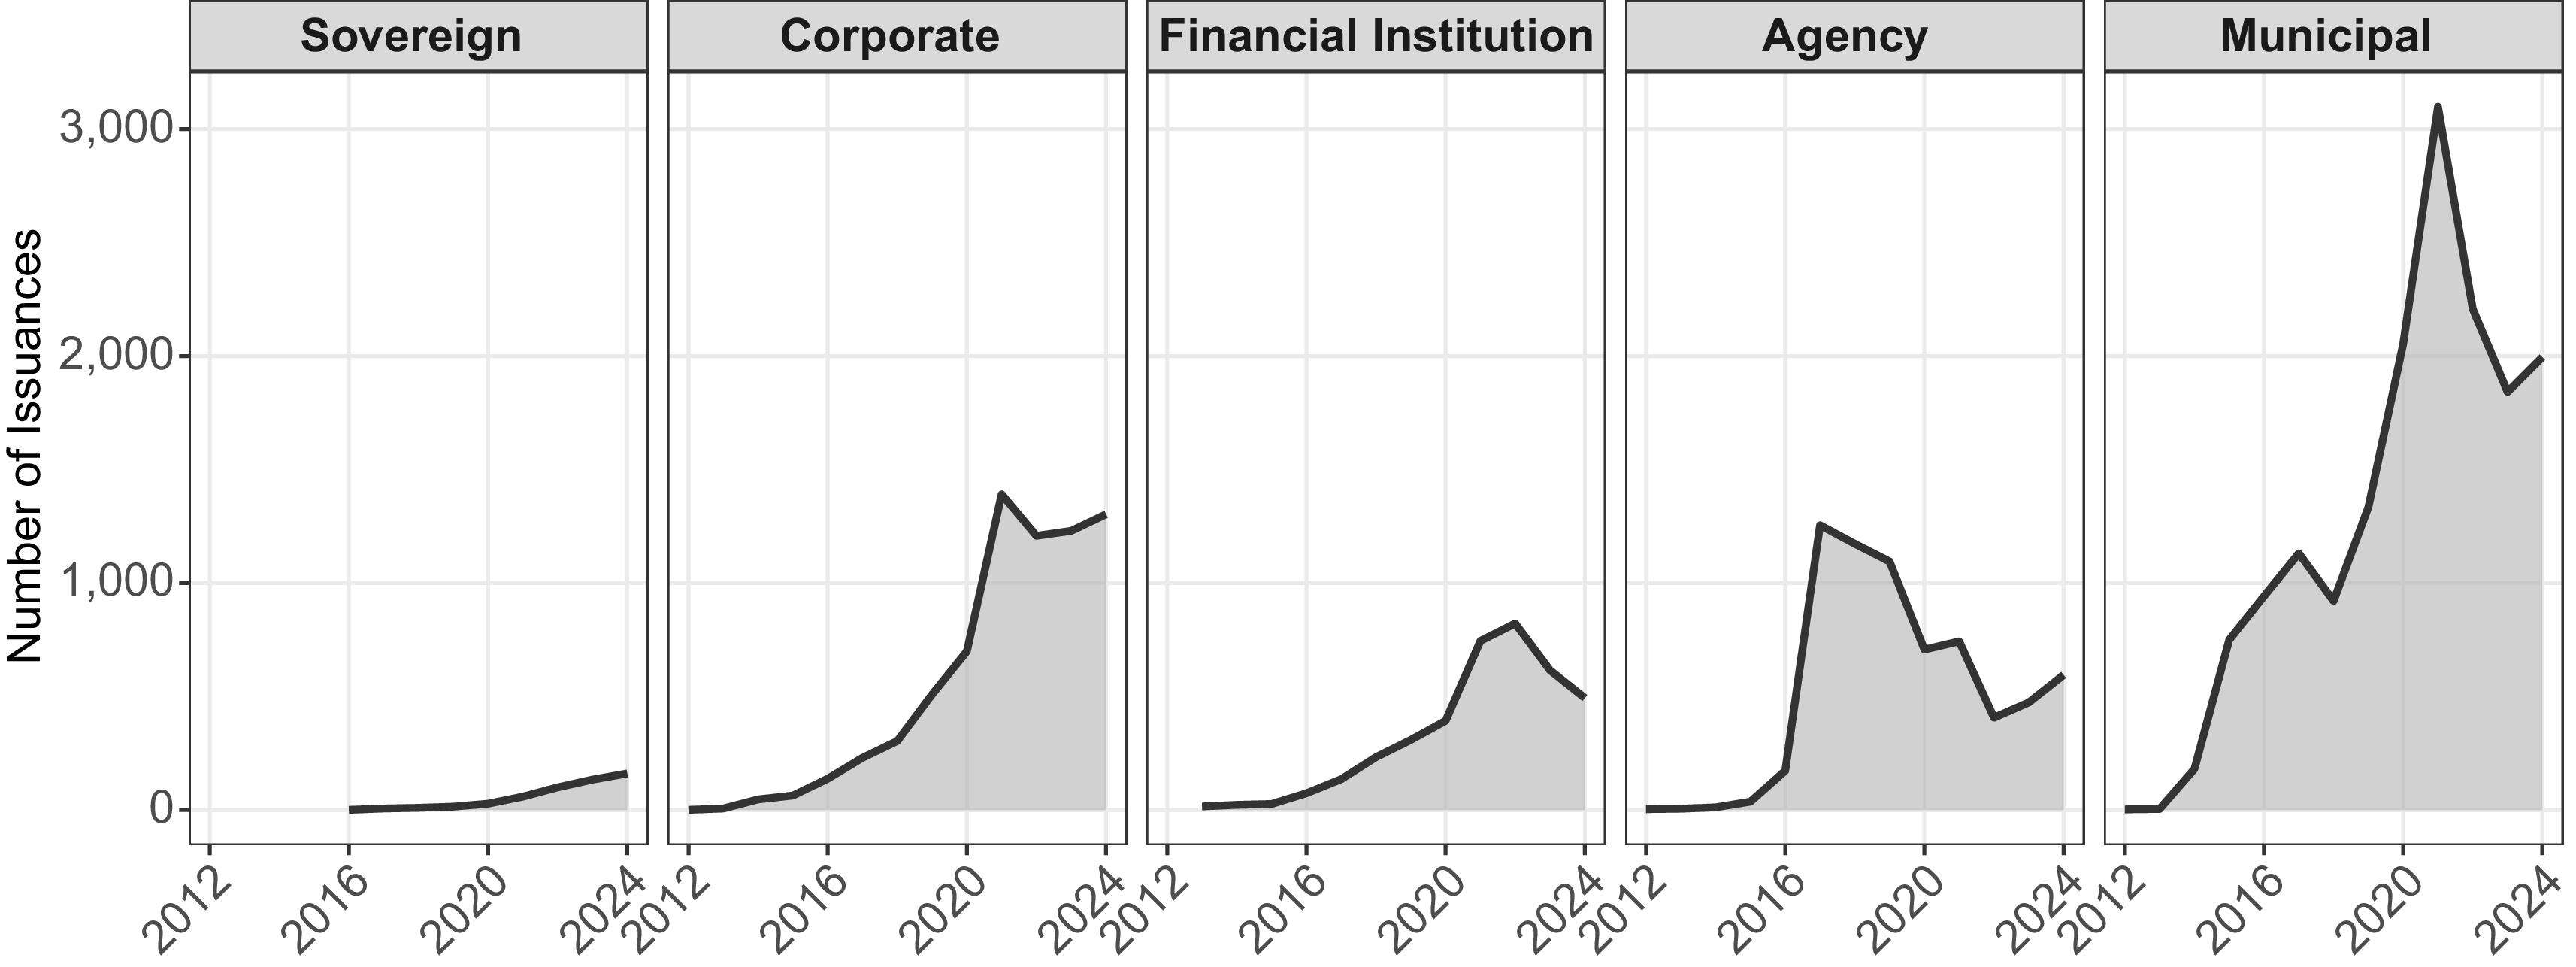
Figure 1 shows the issuer composition of green bond markets. Corporate and financial issuers dominate; municipal issuance is substantial but largely US-driven; agency issuance finances public priorities through delegated entities. Sovereign issuance remains strikingly low—at odds with the expectation that sovereigns anchor bond market development.
Number of green bond issuances by issuer type
Notes: Each panel shows the annual number of green bond issuances for a given issuer type. The y-axis is held constant across panels; the near-flat sovereign panel relative to other issuer types reflects the core empirical pattern motivating this analysis.

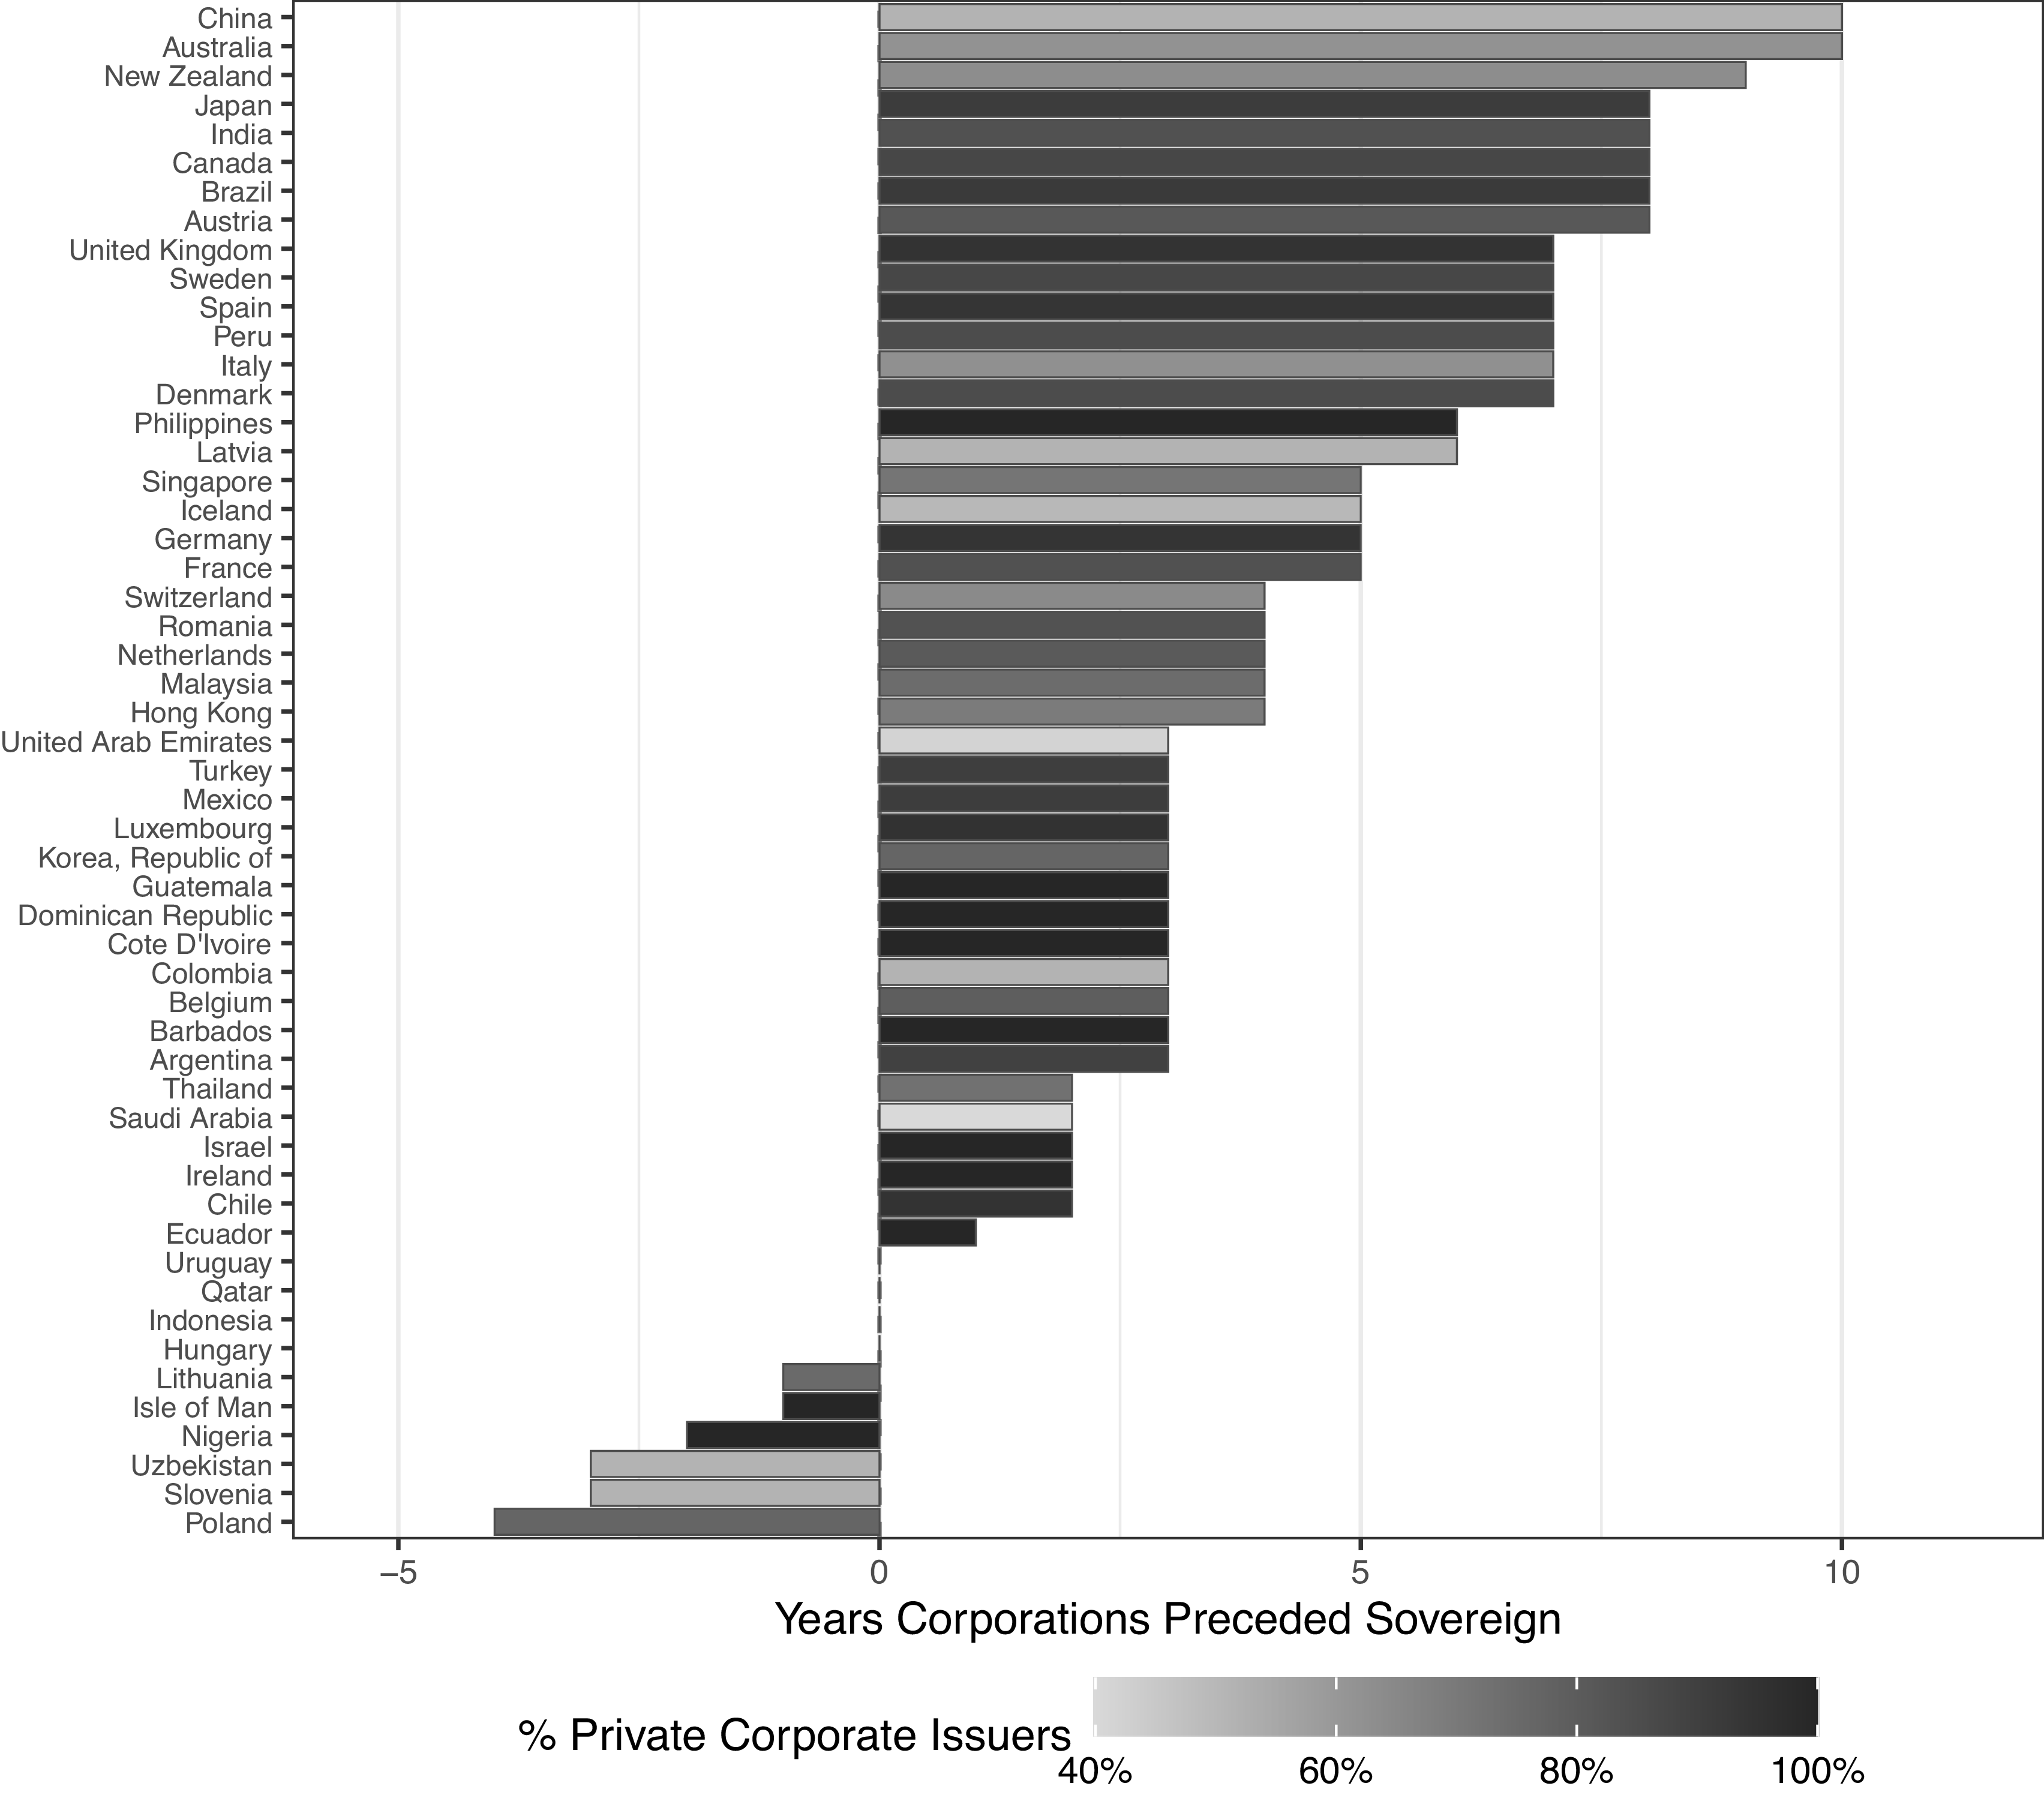
Figure 2 provides the clearest evidence of this departure. In most countries, the first corporate green bond preceded the first sovereign green bond, and this pattern holds across advanced and emerging economies. The bar shading shows the share of corporate issuers that were private rather than government-linked, indicating that corporate leadership was typically driven by private firms rather than state-adjacent entities.
Corporate leadership in green bond issuance
Notes: The bars represent the lag between the first sovereign green bond issuance and the first corporate green bond issuance, calculated as Lag = (year of first sovereign green bond) (year of first corporate green bond). Positive values indicate corporate-led issuance. Bar color reflects the share of private (non-government-linked) corporate issuers in each country, with darker indicating a higher share of private issuers.

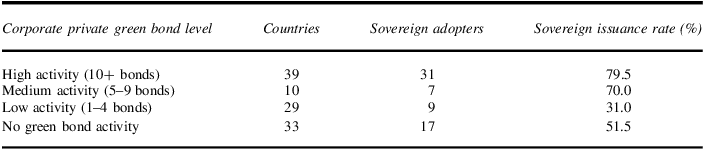
Table 1 quantifies the relationship. Countries with high corporate private activity (ten-plus bonds) show a 79.5 percent sovereign issuance rate, compared to 51.5 percent among countries with no green bond activity. The pattern is consistent with corporate activity facilitating sovereign entry. Among eventual sovereign adopters, the median lag between first corporate and first sovereign issuance is three years.
Corporate private activity and sovereign green bond market entry

Table 1 Long description
The table has four rows and four columns. The columns are labeled ‘Corporate private green bond level’, ‘Countries’, ‘Sovereign adopters’, and ‘Sovereign issuance rate (%)’. The rows are labeled ‘High activity (10+ bonds)’, ‘Medium activity (5–9 bonds)’, ‘Low activity (1–4 bonds)’, and ‘No green bond activity’. Row 1: High activity (10+ bonds), 39 Countries, 31 Sovereign adopters, 79.5 percent Sovereign issuance rate. Row 2: Medium activity (5–9 bonds), 10 Countries, 7 Sovereign adopters, 70.0 percent Sovereign issuance rate. Row 3: Low activity (1–4 bonds), 29 Countries, 9 Sovereign adopters, 31.0 percent Sovereign issuance rate. Row 4: No green bond activity, 33 Countries, 17 Sovereign adopters, 51.5 percent Sovereign issuance rate.
Notes: Corporate private activity is measured as the total cumulative issuance of private corporate green bonds over the sample period. Sovereign issuance rate is the percentage of countries in each activity category that have ever issued a sovereign green bond. The non-monotonicity at low activity levels reflects political-signaling adoptions among small states with no domestic green bond ecosystem; see earlier and Appendix F.
Why Green Bonds Deviate
Green bonds embed environmental claims alongside credit risk, introducing normative and informational uncertainty about project eligibility, reporting, and credibility that sovereign issuance alone does not resolve.Footnote 9 The legal and procedural infrastructure is therefore constructed and shapes participation terms.Footnote 10 Whereas sovereign creditworthiness anchors pricing in conventional markets, green bond credibility depends on compliance with evolving environmental standards, and a sovereign accused of greenwashing faces political costs no conventional issuer confronts.Footnote 11 Compounding this, green bond standards emerged through voluntary market coordination rather than formal regulation, so no government could establish credible benchmarks ex ante.Footnote 12
Banks As Institutional Entrepreneurs in Green Finance
The conventional account of green bonds emphasizes investor demand for sustainable assets and issuers’ incentives to signal environmental commitment and credibility.Footnote 13 This framing leaves unexamined a third set of actors: the global investment banks that created the market’s institutional infrastructure. Banks functioned as institutional entrepreneurs that developed the GBP and promoted green bonds through corporate client relationships, building the market conditions that eventually enabled sovereign participation. I refer to the four drafting banks, nine initial signatories, and twelve early adopters as the GBP consortium.Footnote 14 This authority is constitutive rather than evaluative: unlike credit rating agencies, which assess actors within an existing market, the GBP consortium constructed the market itself—its procedural expectations, reputational benchmarks, and investor conventions—before sovereign actors had decided to participate.
The argument engages bottom-up private governance accounts, especially Büthe and Mattli on private standard setting before government participation.Footnote 15 The green bond case shares this structure but differs in a crucial respect: the GBP consortium did not merely codify standards that sovereigns later adopted—it built the market infrastructure within which sovereign participation became feasible. For Büthe and Mattli standard-setters exercise evaluative authority, defining criteria against which other actors are assessed; the GBP consortium constructed the market within which those actors operate.Footnote 16
The argument also differs from Hale’s concept of catalytic cooperation, in which orchestrators—typically international organizations—activate private actors to supplement public governance.Footnote 17 The bank-mediated pathway involves no such orchestrator: the GBP consortium acted autonomously, motivated by commercial opportunity rather than recruited by a multilateral body. The authority exercised by the founding banks was not delegated from above but constructed through repeated transactions from below.
Similar public–private reversals appear in other domains, including new public management reforms that brought private service delivery into government and securitization in government-backed mortgage markets.Footnote 18 The green bond case differs, however, because governments did not contract the GBP consortium to deliver a public purpose.Footnote 19 The consortium constructed the market autonomously, and sovereigns entered only after that infrastructure was in place.
The pattern is not unprecedented in environmental governance. Under the Montreal Protocol, chemical producers, equipment manufacturers, and industry-NGO coalitions built the technical and monitoring infrastructure through which the ozone regime operated, often before or alongside formal intergovernmental codification.Footnote 20 What distinguishes the green bond case is the transmission channel: financial intermediaries occupying a dual role in corporate and sovereign debt markets, transferring procedural infrastructure across the public–private divide through that institutional position.
The green bond market did not emerge organically. Early multilateral green bonds were structured as one-off transactions between development banks and institutional investors. By 2013, corporate issuers and a broader investor base had begun to engage, but without standardized processes for designating, verifying, and reporting on proceeds, each transaction required individual negotiation. This created a coordination problem: issuers needed enough flexibility to finance diverse projects, while investors needed comparable information to evaluate environmental credibility. The response emerged from informal coordination among debt capital markets professionals at the 2012 Environmental Finance conference, leading to the GBP, announced in January 2014.Footnote 21 The principles were drafted by four banks—Bank of America Merrill Lynch, Citi, Crédit Agricole CIB, and JPMorgan Chase.Footnote 22
The original GBP document was deliberately minimalist: it specified process requirements for use of proceeds, project evaluation and selection, management of proceeds, and reporting, while declining to define eligible green project categories.Footnote 23 By focusing on process rather than substance, the GBP provided enough standardization to facilitate transactions while accommodating diverse issuers. Subsequent frameworks—regional adaptations, taxonomies, and product-specific principles—built on this template rather than replacing it, a layered architecture documented in Appendix T. Three motivations drove bank investment in this infrastructure: scaling the market beyond individual MDB transactions, establishing credibility in a market vulnerable to greenwashing accusations, and securing the commercial position of natural counterparties for new issuers.Footnote 24
From Corporate Clients to Sovereign Issuance
The GBP was necessary but not sufficient for market development. The banks that drafted the principles also occupied central positions in global debt underwriting, allowing them to promote green bonds through existing corporate client relationships. Underwriting a green bond provides not only market access but procedural knowledge for GBP-compliant issuance: developing frameworks, engaging external reviewers, tracking proceeds, and preparing impact reports.
Founding banks’ early contracting was concentrated among private corporations rather than government-linked entities. Private firms offered contractual flexibility, lower political risk, and repeat opportunities for refining the procedural standards that would govern the market; they functioned as governance laboratories during the formative phase.
Contemporaneous accounts support this market-building mechanism without implying a publicly announced firms-first strategy. Claquin describes green bonds as a tool for scaling private-sector climate finance, noting that private issuers entered a market initially dominated by MDBs in 2013 to 2014.Footnote 25 Bank of America’s first US corporate green bond illustrates the transaction-level pathway: MDB experience was translated into corporate issuance through project selection, investor targeting, and demand testing.Footnote 26 Together, these accounts suggest how banks moved green-bond practices from MDB issuance into corporate transactions, where disclosure, investor communication, and use-of-proceeds conventions could be standardized under ordinary market conditions.
Private corporations also offered a credibility advantage. Subject to mandatory securities disclosure, private firms’ voluntary adoption of GBP standards became publicly observable through filings that investors, analysts, and civil society could scrutinize.Footnote 27 Sovereigns, exempt from securities regulation, lack this built-in observability.Footnote 28 Verification standards built through repeated corporate transactions therefore substituted for a form of public accountability that sovereign issuers structurally lacked.
Private corporate activity influences sovereign issuance through two related pathways. Institutional intermediation: the same banks that underwrite corporate green bonds also serve as lead managers for sovereign issuances, transferring procedural knowledge from corporate deal experience to sovereign clients. Infrastructure accumulation: repeated corporate issuance builds both the technical infrastructure—investor base, verification capacity, pricing conventions—and the evaluative benchmarks against which sovereign entry will be judged. Each corporate issuance expands the stock of market institutions on which sovereigns can later draw.
H1 Higher levels of prior private corporate green bond issuance increase the likelihood of, and accelerate the timing of, a country’s first sovereign green bond issuance.
The infrastructure accumulation argument does not imply that supply-side conditions alone determine sovereign entry. Environmental treaty ratification—particularly the Paris Agreement—creates political pressure to demonstrate operationalized climate action, and sovereign green bonds offer a visible, market-validated instrument for doing so. Infrastructure and demand are complements: commitments generate demand for visible climate signaling, while accumulated market infrastructure determines whether and when governments can supply it credibly. The treaty-ratification coefficient in the section called, “Corporate Infrastructure and Sovereign Issuance,” should be read as the demand-side shifter, while the corporate accumulation coefficient captures the supply-side shifter conditional on it. Sovereign issuance becomes observable where the two conditions overlap.
Agency Bonds as Substitutes
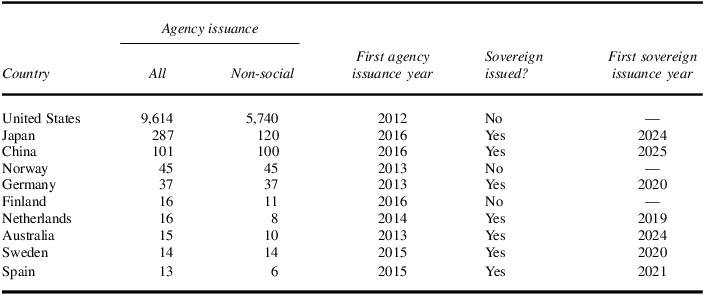
Government agency bonds—issued by development banks, state-owned enterprises, public utilities, and other government-sponsored entities—occupy an institutional space between corporate and sovereign debt. Though legally distinct from sovereigns, they often carry implicit state backing, finance similar categories of infrastructure, and draw on overlapping investor bases. They therefore function as close substitutes for sovereign issuance rather than as complements. Agency mandates—renewable energy, public transit, water infrastructure—provide clearly defined project pipelines aligned with green bond eligibility criteria, reducing the verification burden and greenwashing risk that complicate sovereign issuance. Agencies also enjoy greater operational autonomy from electoral cycles. Several active agency issuers reflect these dynamics: the United States, where federally sponsored entities account for over 9,000 agency green bonds; Japan, where 287 agency bonds preceded sovereign entry in 2024; and Norway, where forty-five agency bonds have been issued without any sovereign issuance to date (see Table 10). When agencies already supply substantial green financing capacity, central governments face reduced fiscal necessity and weaker incentives to enter the sovereign market.
H2 Higher levels of prior government agency green bond issuance reduce the likelihood of a country’s first sovereign green bond issuance by providing an alternative channel for public-sector green finance.
Data
Green Bond Issuance Data
The data set combines bond-level records from Bloomberg and Environmental Finance for green and conventional bond issuances spanning 2012–2024, capturing issuer name, issuer type, country, settlement date, issuance value, and lead managers.Footnote 29 For green bonds, the sample includes self-labeled issuances: bonds that issuers designate as green and align with GBP process requirements, typically supported by an external second-party opinion but not necessarily by independent third-party certification.Footnote 30 This is the appropriate population: the GBP framework is the market infrastructure through which banks enabled sovereign issuance, and it was built through the self-labeled market. Restricting the analysis to Climate Bonds Initiative (CBI)–certified bonds would introduce selection bias by undersampling early activity (2012–2016) central to the infrastructure accumulation argument.Footnote 31
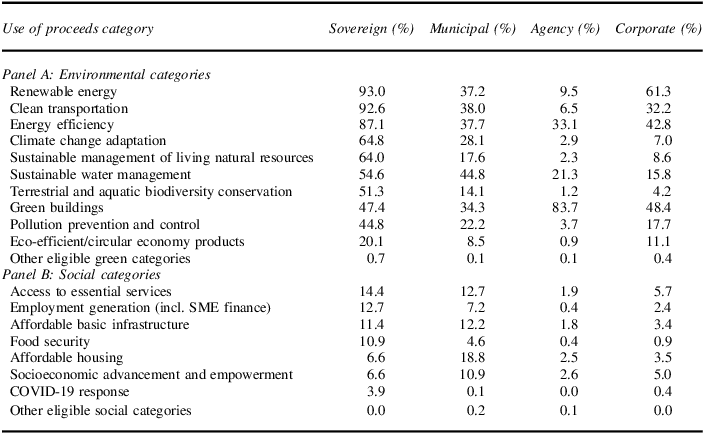
A natural concern is whether the green label corresponds to environmentally distinct projects or merely repackages existing public investment. Direct comparison of green and conventional sovereign bond proceeds is not possible: conventional sovereign debt is not project-earmarked, so its categorical composition is unobservable. Table 2 instead compares use-of-proceeds disclosures across the four issuer types that label proceeds (sovereign, municipal, agency, corporate), clarifying what categorical work sovereign green bonds perform relative to other tagged green issuance. Sovereigns tag substantially more categories per bond than other issuers (6.9 versus 3.5 for municipals, 2.7 for corporates, 1.8 for agencies) and over-index in climate adaptation, biodiversity conservation, and sustainable management of natural resources—categories largely absent from agency and municipal activity. Agencies concentrate in green buildings (83.7 percent); municipals in water management and clean transport. Sovereign green bonds therefore occupy categorical space that other public-sector green issuers do not fund.Footnote 32
Use-of-proceeds categories across issuers: green and sustainability bonds

Table 2 Long description
The table compares the use of proceeds categories across four types of issuers: Sovereign, Municipal, Agency, and Corporate. It is divided into two panels: Panel A and Panel B. Panel A focuses on environmental categories, while Panel B focuses on social categories. Each cell in the table represents the percentage of proceeds allocated to specific categories by each issuer type. Panel A includes categories such as renewable energy, clean transportation, energy efficiency, climate change adaptation, sustainable management of living natural resources, sustainable water management, terrestrial and aquatic biodiversity conservation, green buildings, pollution prevention and control, eco-efficient/circular economy products, and other eligible green categories. Panel B includes categories such as access to essential services, employment generation, affordable basic infrastructure, food security, affordable housing, socioeconomic advancement and empowerment, COVID-19 response, and other eligible social categories. The table provides a detailed breakdown of how each issuer type allocates its proceeds across these categories.
Notes: Sample includes 458 sovereign, 1,616 municipal, 6,311 agency, and 3,350 private corporate green and sustainability bonds with non-missing use-of-proceeds tags. Sovereign sample comprises 441 pure green bonds and 143 sustainability bonds, of which 458 report non-missing use-of-proceeds tags. Cells report the share of each issuer type’s bonds tagged with the given category; bonds may carry multiple categories so column totals exceed 100%. Mean categories per bond: 6.9 sovereign, 3.5 municipal, 1.8 agency, 2.7 corporate. Social categories appear because Environmental Finance applies the full ICMA taxonomy to sustainability bonds.
After excluding supranational issuers and social or social-hybrid bonds, the data set covers 34,677 green and sustainability bond issuances across 111 countries from 2012 to 2024: 16,464 municipal, 7,131 corporate, 6,681 agency, 3,886 financial institution, and 515 sovereign. Issuance sizes are right-skewed: sovereign bonds average USD 1.2 billion (median USD 700 million), compared to USD 234 million for private corporate, USD 76 million for agency, and USD 20 million for municipal bonds (see Appendix L.3).Footnote 33 The analysis uses bond counts rather than values because the mechanism operates per transaction: each corporate issuance contributes to procedural templates, verified issuers, and investor familiarity, regardless of dollar volume.
Issuer Classification
Issuers are classified into seven categories based on institutional characteristics and government relationship: sovereign, agency, municipal, private corporate, government-linked corporate, private financial institution, and government-linked financial institution. Government-linked issuers include state-owned enterprises, government-sponsored entities, and firms with substantial government ownership. Classification was conducted manually using ownership information, regulatory filings, and public records. These categories allow bank involvement to be compared across issuers that differ in political constraint and contractual flexibility.
Lead Manager Identification
Lead managers are standardized across issuances and classified by role in creating the Green Bond Principles. Founding banks are the four institutions that drafted the GBP in January 2014: Bank of America Merrill Lynch, Citi, Crédit Agricole CIB, and JPMorgan Chase. Initial supporters are the nine banks that joined as signatories at launch, and early adopters are twelve banks that joined shortly after; together, these twenty-five banks constitute the GBP consortium.Footnote 34 This classification identifies whether standard-setting banks also dominated early market activity, and whether involvement varied across issuer types and over time.
Bank Leadership in Market Formation
If founding banks built infrastructure through early transactions, their activity should be concentrated among private corporations—issuers with repeat deal opportunities, flexible project pipelines, and fewer political constraints than sovereign or government-linked borrowers. This section tests three implications: founding banks should dominate pre-GBP market activity; participate more in private corporate than government-linked issuance; and decline after 2014 as accumulated infrastructure reduced the need for direct involvement.
Pre-Institutional Market Dominance
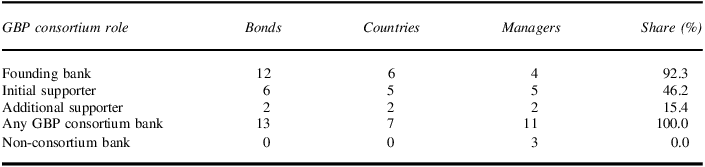
Founding banks underwrote 92.3 percent of green bonds issued before the principles existed; GBP consortium banks together captured 100 percent of the pre-GBP market (see Table 3). Because this market was small—thirteen bonds across seven countries—and the founders were major global underwriters, high concentration is partly mechanical. The “Bank Involvement in Sovereign Market Entry” section assesses whether this concentration reflects green-bond-specific market building rather than baseline dominance. The thirteen bonds involved eleven lead managers, suggesting a cross-jurisdictional proof of concept, with no bonds underwritten by institutions outside the eventual GBP consortium.Footnote 35
Pre-GBP green bond market composition (2012–2013)

Table 3 Long description
A table comparing the roles of banks in the pre-GBP green bond market. The table has five rows and five columns. The columns are labeled GBP consortium role, Bonds, Countries, Managers, and Share (%). The rows are labeled Founding bank, Initial supporter, Additional supporter, Any GBP consortium bank, and Non-consortium bank. Row 1: Founding bank, 12 Bonds, 6 Countries, 4 Managers, 92.3 percent Share (%). Row 2: Initial supporter, 6 Bonds, 5 Countries, 5 Managers, 46.2 percent Share (%). Row 3: Additional supporter, 2 Bonds, 2 Countries, 2 Managers, 15.4 percent Share (%). Row 4: Any GBP consortium bank, 13 Bonds, 7 Countries, 11 Managers, 100.0 percent Share (%). Row 5: Non-consortium bank, 0 Bonds, 0 Countries, 3 Managers, 0.0 percent Share (%).
Notes: Analysis covers all green bond issuances from January 2012 through December 2013, prior to the Green Bond Principles’ January 2014 launch. Founding Banks are the four institutions that drafted the GBP. Initial Supporters are the nine banks that joined as signatories at launch. Share is calculated as the percentage of bonds with at least one lead manager from each category.
Disproportionate Involvement with Private Corporate Issuers
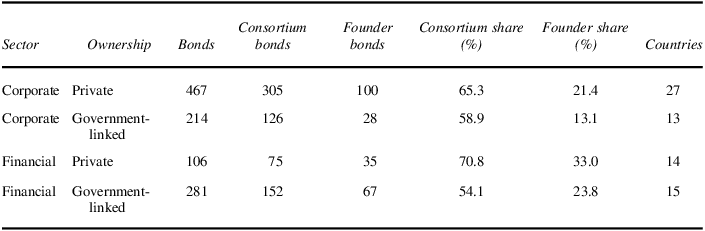
Founding banks participated in 21.6 percent of private corporate issuances versus 13.1 percent of government-linked corporate issuances (see Table 4), despite government-linked corporates often carrying stronger credit ratings and larger deal sizes. The pattern extends to financial institutions (33 percent private versus 23.3 percent government-linked), suggesting that ownership structure rather than sector-specific factors drove bank selection. The full GBP consortium showed more uniform participation (65.1 percent versus 58.9 percent), suggesting that later consortium members did not depend on the same issuer characteristics.
Bank involvement by issuer sector and ownership structure

Table 4 Long description
The table has six rows and eight columns. The columns are labeled Sector, Ownership, Bonds, Consortium bonds, Founder bonds, Consortium share (%), Founder share (%), and Countries. The rows are labeled with different sectors and ownership types: Corporate Private, Corporate Government-linked, Financial Private, and Financial Government-linked. Row 1: Corporate, Private, 467, 305, 100, 65.3, 21.4, 27. Row 2: Corporate, Government-linked, 214, 126, 28, 58.9, 13.1, 13. Row 3: Financial, Private, 106, 75, 35, 70.8, 33.0, 14. Row 4: Financial, Government-linked, 281, 152, 67, 54.1, 23.8, 15.
Notes: Analysis covers 2014–2017 GBP-compliant issuances, excluding municipal, agency, and sovereign issuers. Government-linked entities are state-owned, government-sponsored, or majority government-owned firms. Shares report bonds with at least one consortium or founding bank lead manager; founding banks are the four GBP drafters.
Private corporates account for only 10.9 percent of the early-market sample (467 of 4,252 bonds). Activity within this category was concentrated: seventy-six issuers across twenty-seven countries, with a median of three bonds per issuer and the top ten issuers accounting for 48.2 percent of bond-level activity. The heaviest issuers were mid-sized firms with focused environmental project portfolios—a pattern consistent with private corporates serving as “governance laboratories” through depth of repeat engagement (see Appendix S).
From Direct Leadership to Market Infrastructure
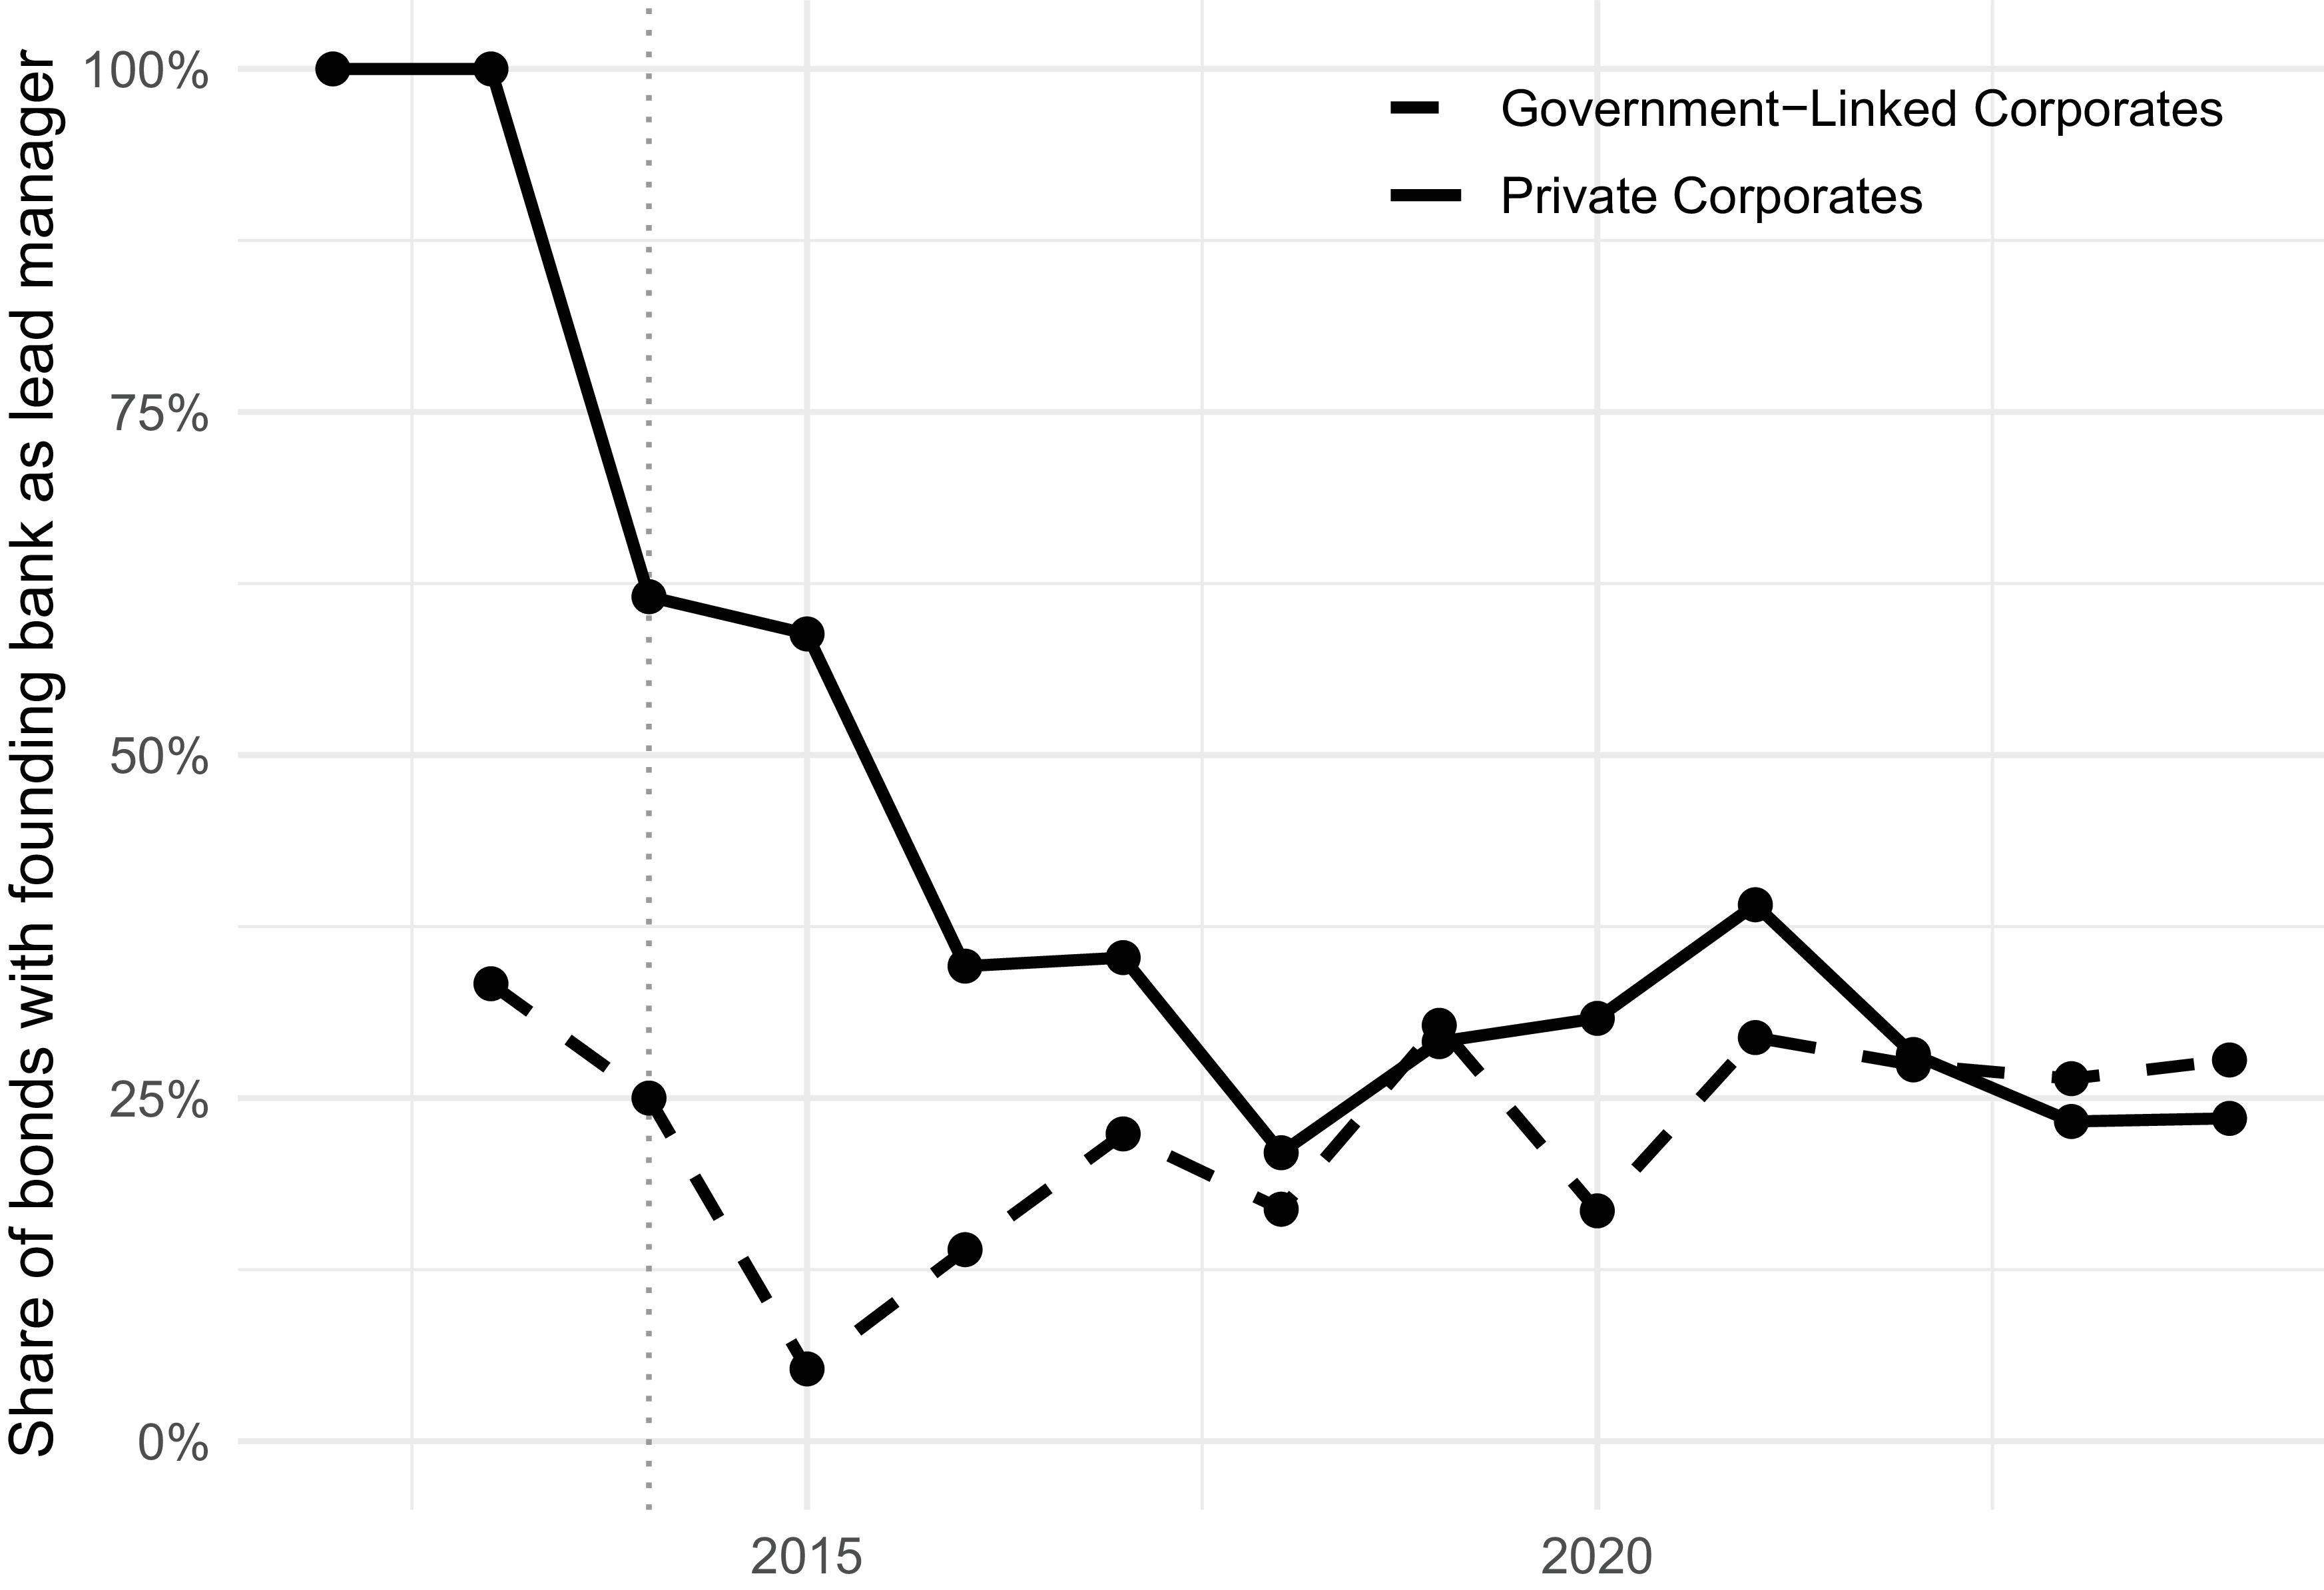
If founding banks built market infrastructure through concentrated early contracting, their direct involvement should decline once standards stabilized. Figure 3 shows this pattern: founding banks participated in 100 percent of private corporate green bond issuances before the GBP launch, fell to 60 percent in 2015 and 30 percent by 2017, then stabilized around 25 percent through 2020. Government-linked corporate involvement declined more gradually, converging with private corporates at 25 to 30 percent by 2020. This sharp post-2014 decline is more consistent with infrastructure accumulation than persistent market power: founding-bank dominance eroded as annual green bond issuance expanded from under twenty bonds in 2013 to over 800 by 2020.
Founding bank involvement over time by corporate ownership
Notes: Share of bonds with at least one founding-bank lead manager, by year and corporate ownership type. Dashed line marks the January 2014 GBP launch. Private corporate coverage falls from 100 percent pre-2014 to about 30 percent by 2017; both series converge at 25 to 30 percent by 2020.

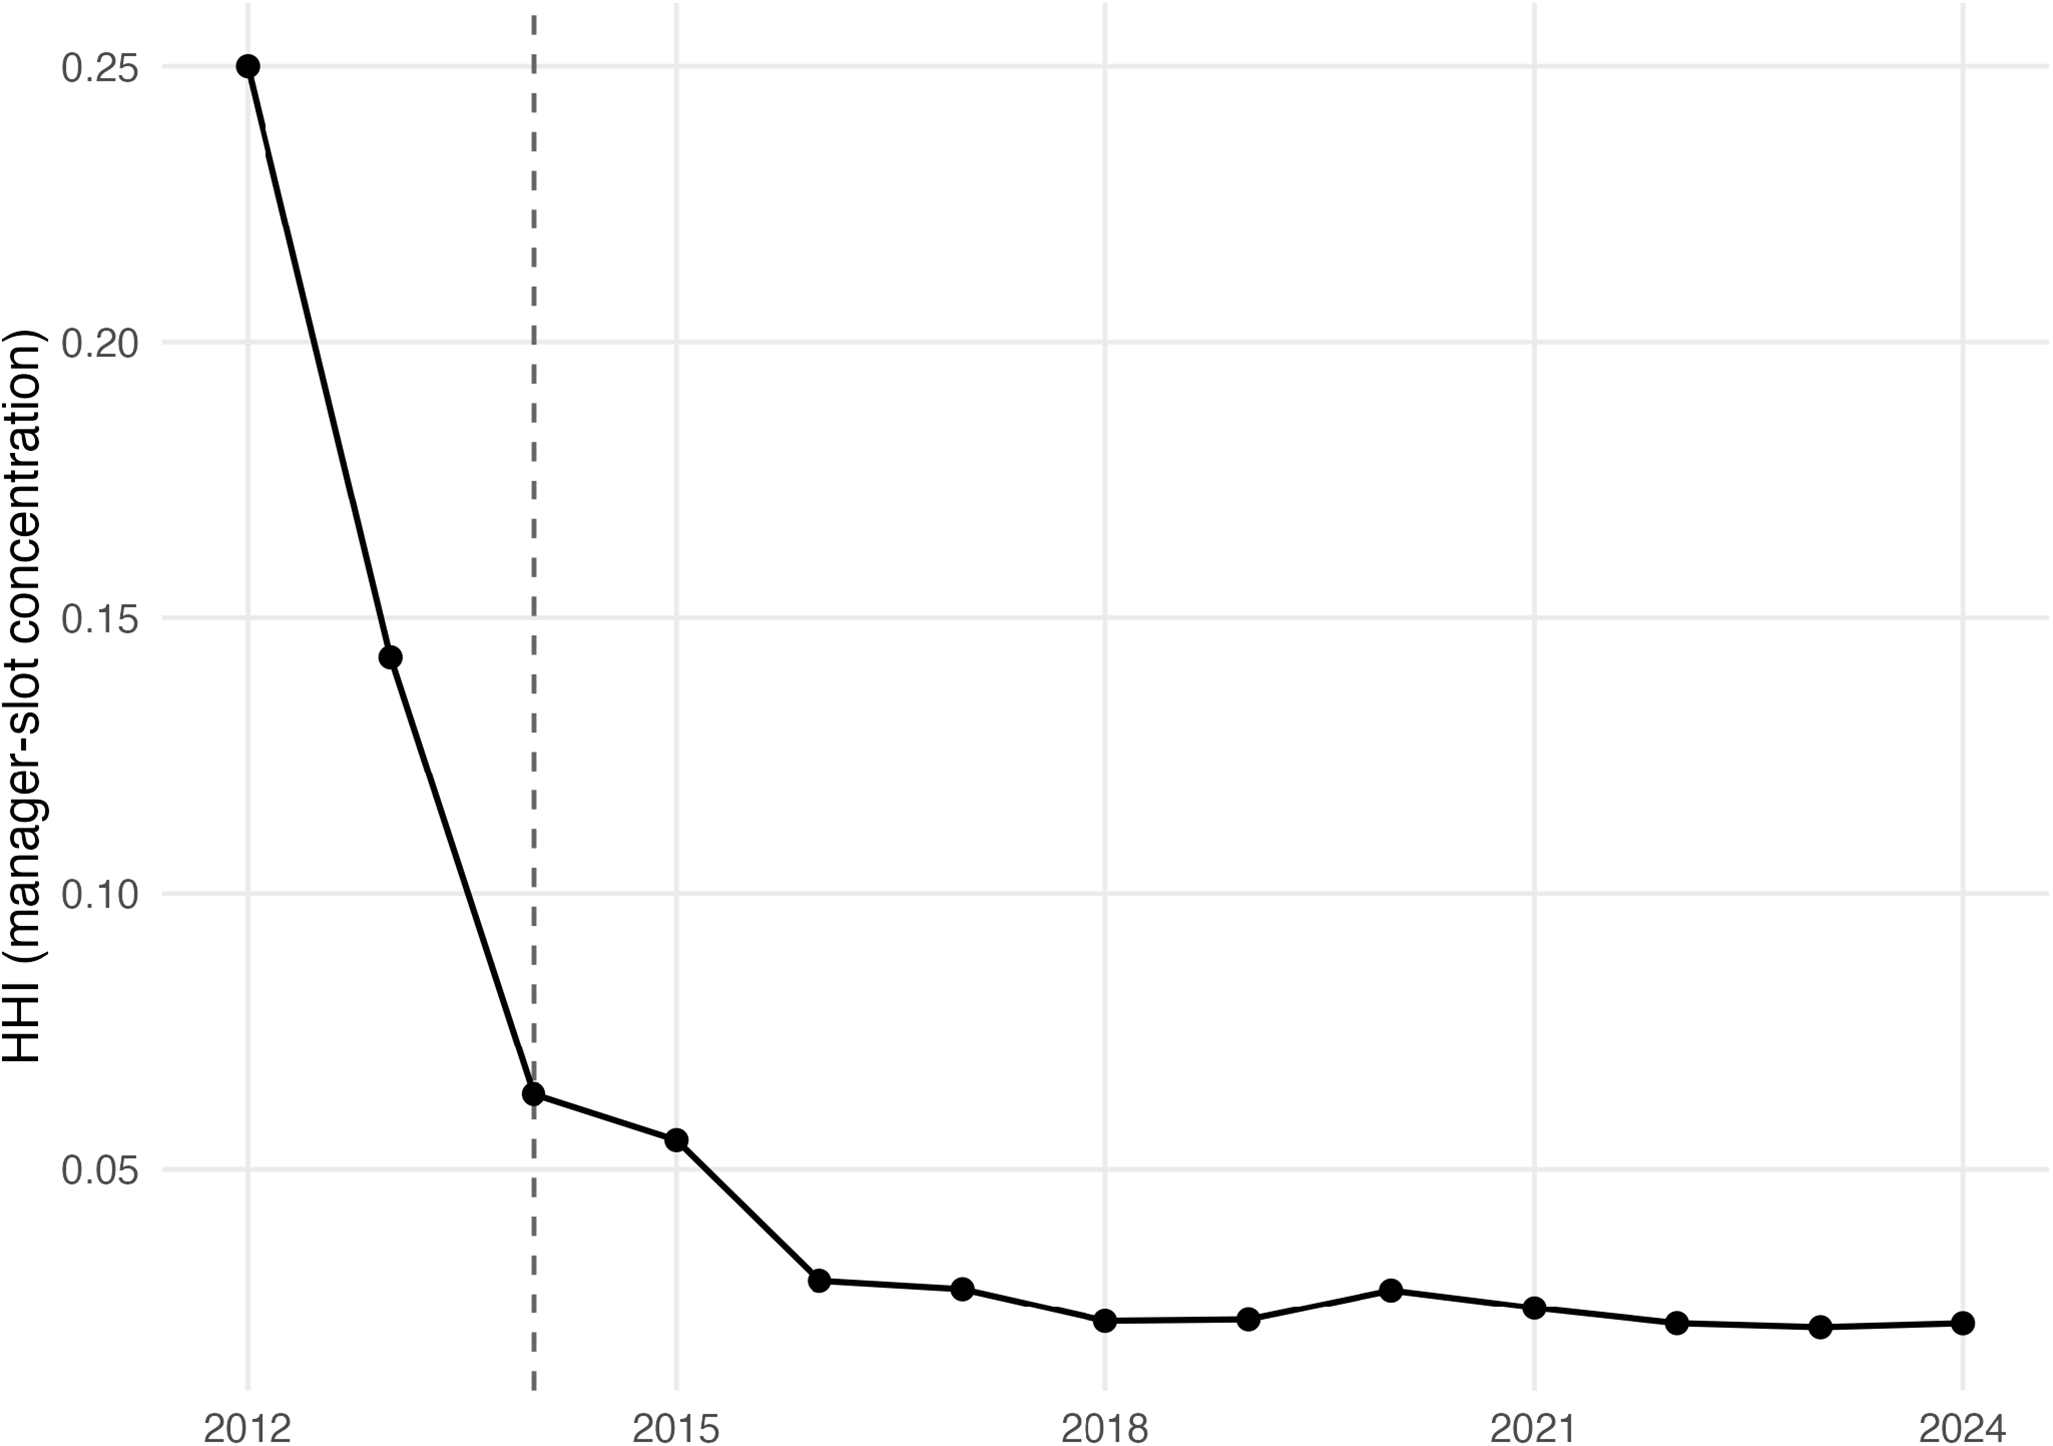
The decline in founding-bank involvement could reflect either market opening or a shift in concentration from founders to a new oligopoly of green specialists. Figure 4 supports the former: the Herfindahl-Hirschman Index (HHI) for private corporate underwriting falls from 0.25 in 2012 to approximately 0.06 by 2014, then stabilizes near 0.02 to 0.03 from 2016 onward, well below the 0.15 competitive-market threshold. The market opened rather than reconcentrated. Once GBP standards codified bank-specific procedural knowledge, underwriting capacity spread across the financial sector, lowering barriers for subsequent corporate issuers and, eventually, sovereigns.
Lead manager concentration in private corporate green bonds over time
Notes: HHI is based on lead-manager shares in private corporate green bonds. Dashed line marks the 2014 GBP launch; HHI 0.25 indicates high concentration and HHI 0.15 indicates competitive markets.

Bank Involvement in Sovereign Market Entry
Once GBP infrastructure became publicly available, sovereigns could, in principle, access it through two pathways: independent adoption (governments replicating established practices without direct bank involvement) or active intermediation (the same banks that built infrastructure through corporate transactions facilitating sovereign entry). The two pathways produce divergent predictions about who underwrites sovereign entry deals.
Founding Banks As Sovereign Market Gatekeepers
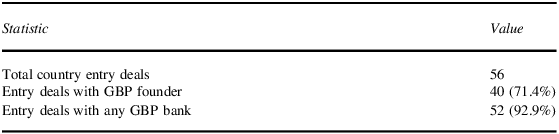
Of the fifty-six country entry deals—the first sovereign green bond issued by each country—71.4 percent include at least one GBP founding bank as lead manager (see Table 5). Expanding to all GBP consortium banks raises coverage to 92.9 percent. This near-universal presence at sovereign market entry is consistent with the institutional intermediation mechanism: sovereign issuers rely heavily on intermediaries with established green bond capabilities rather than developing independent market access.
GBP bank involvement in country entry deals

Table 5 Long description
A table with three rows and two columns. The columns are labeled ‘Statistic’ and ‘Value’. The rows are as follows: Row 1: Statistic, Total country entry deals; Value, 56. Row 2: Statistic, Entry deals with GBP founder; Value, 40 (71.4 percent). Row 3: Statistic, Entry deals with any GBP bank; Value, 52 (92.9 percent). The table provides data on the involvement of GBP banks in country entry deals, highlighting the percentage of deals that include at least one GBP founding bank and the percentage that include any GBP consortium bank.
Notes: Entry deals are defined as the first sovereign green bond issuance by each country. GBP Founders are the four banks that drafted the GBP. GBP Banks include all founding, initial supporter, and early adopter institutions.
Distinguishing Intermediation from Market Dominance
The near-universal GBP presence at sovereign entry is consistent with institutional intermediation but equally consistent with an alternative: that GBP banks simply dominate sovereign debt underwriting generally, in which case their presence reflects baseline market structure rather than green-bond-specific expertise transfer. The two channels produce the same observable implication at the country level.
Two comparisons distinguish them. The first is the league-table baseline: Bloomberg data for 2010 to 2014—the period before the green bond market existed at meaningful scale—show the four founders collectively underwriting 15.5 percent of global bond issuance, against 71.4 percent of sovereign green entry deals. The full twenty-five-bank consortium shows 64.7 percent baseline against 92.9 percent green entry presence. Because the baseline is measured before the green bond market existed at meaningful scale, the gap cannot reflect green-bond-specific market structure—only general underwriting dominance, which the 15.5 percent figure rules out (see Appendix O.1).
The second is a bank-level triangulation focused on the four founding banks. For each case where a founding bank served as lead manager on a country’s sovereign entry deal, I record two priors: whether that founding bank had previously underwritten a corporate green bond in the same country (consistent with the intermediation channel, where bank-built green-bond infrastructure flows to sovereign entry), and whether that same founding bank had previously underwritten a conventional sovereign bond in the same country (consistent with the dominance channel, where founders appear at sovereign green entry because they dominate sovereign underwriting generally). The two priors partition the founder-on-entry observations into discriminating cases (where one prior holds and the other does not) and observationally equivalent cases (where both or neither hold). Table 6 reports the partition for the thirty-two founder-on-entry observations across twenty-four countries where the test can run—countries that had at least one prior corporate green bond and at least one founding bank as lead manager on sovereign entry.
Mechanism test: founders at sovereign green entry

Table 6 Long description
A table categorizing bank-level triangulation data for founding banks involved in sovereign green bond entries. The table has three rows and three columns. The columns are labeled ‘Cell’, ‘n’, and ‘%’. The rows are labeled as follows: Row 1: Cell A: Intermediation only (prior corp. green, no prior conv. sov.), n: 8, %: 25.0. Row 2: Cell B: Dominance only (prior conv. sov., no prior corp. green), n: 4, %: 12.5. Row 3: Cell C: Both priors (observationally equivalent), n: 20, %: 62.5.
Notes: Cell partition of the thirty-two founder-on-entry observations across twenty-four countries where the mechanism can plausibly operate. Conventional sovereign experience identified from Bloomberg league tables, 2010–2024. See Appendix O.
The design’s discriminating power is concentrated in cells A and B, which together account for 37.5 percent of observations. Within this discriminating subset, observations point toward intermediation rather than dominance (8 versus 4): founders appear at sovereign entry in countries where they had prior corporate green experience but no conventional sovereign track record twice as often as the reverse.Footnote 36 The majority of observations, in cell C, are observationally equivalent. The test therefore supports intermediation in the cases where it can speak, but the dominant pattern is co-occurrence rather than clean discrimination—consistent with the theoretical account that the two mechanisms are not mutually exclusive. The contribution of the test is to show that intermediation alone, without conventional sovereign dominance, is sufficient to bring founders into sovereign entry deals in a quarter of observations, which a pure dominance account cannot accommodate.
A complementary country-level test, using only green bond data, reinforces this reading. Of the fifty-six sovereign entry countries, twenty-three had substantive pre-entry private green bond markets (at least three pre-entry corporate or financial private green issuances). In twenty-two of these twenty-three countries (95.7 percent), at least one GBP consortium bank served as lead manager on a pre-entry deal: the GBP consortium was present in the early private market that preceded sovereign entry in nearly every country where a meaningful private market existed. Eleven additional countries had thin pre-entry markets of one or two deals, with GBP banks present in eight of eleven (72.7 percent); together with the substantive cases, GBP-consortium presence holds in thirty of the thirty-four testable countries (88.2 percent). The remaining twenty-two entry countries had no pre-entry private green activity at all and are predominantly small states that issued sovereign green bonds as political signaling instruments rather than in response to accumulated domestic infrastructure (see Appendix O.3). The results are robust to broadening the pre-entry issuer universe (twenty-nine of thirty countries, 96.7 percent; see Appendix O.4) and hold across OECD and non-OECD subsamples, with the founder-level discriminating evidence concentrated in OECD countries where lower rates of prior conventional sovereign experience make the design more informative.
Market Concentration Over Time
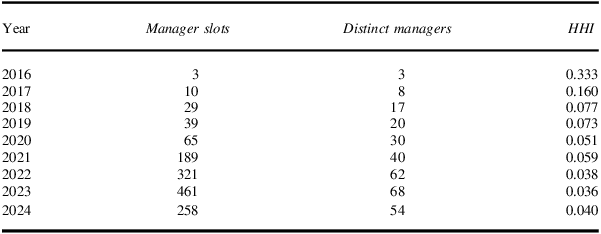
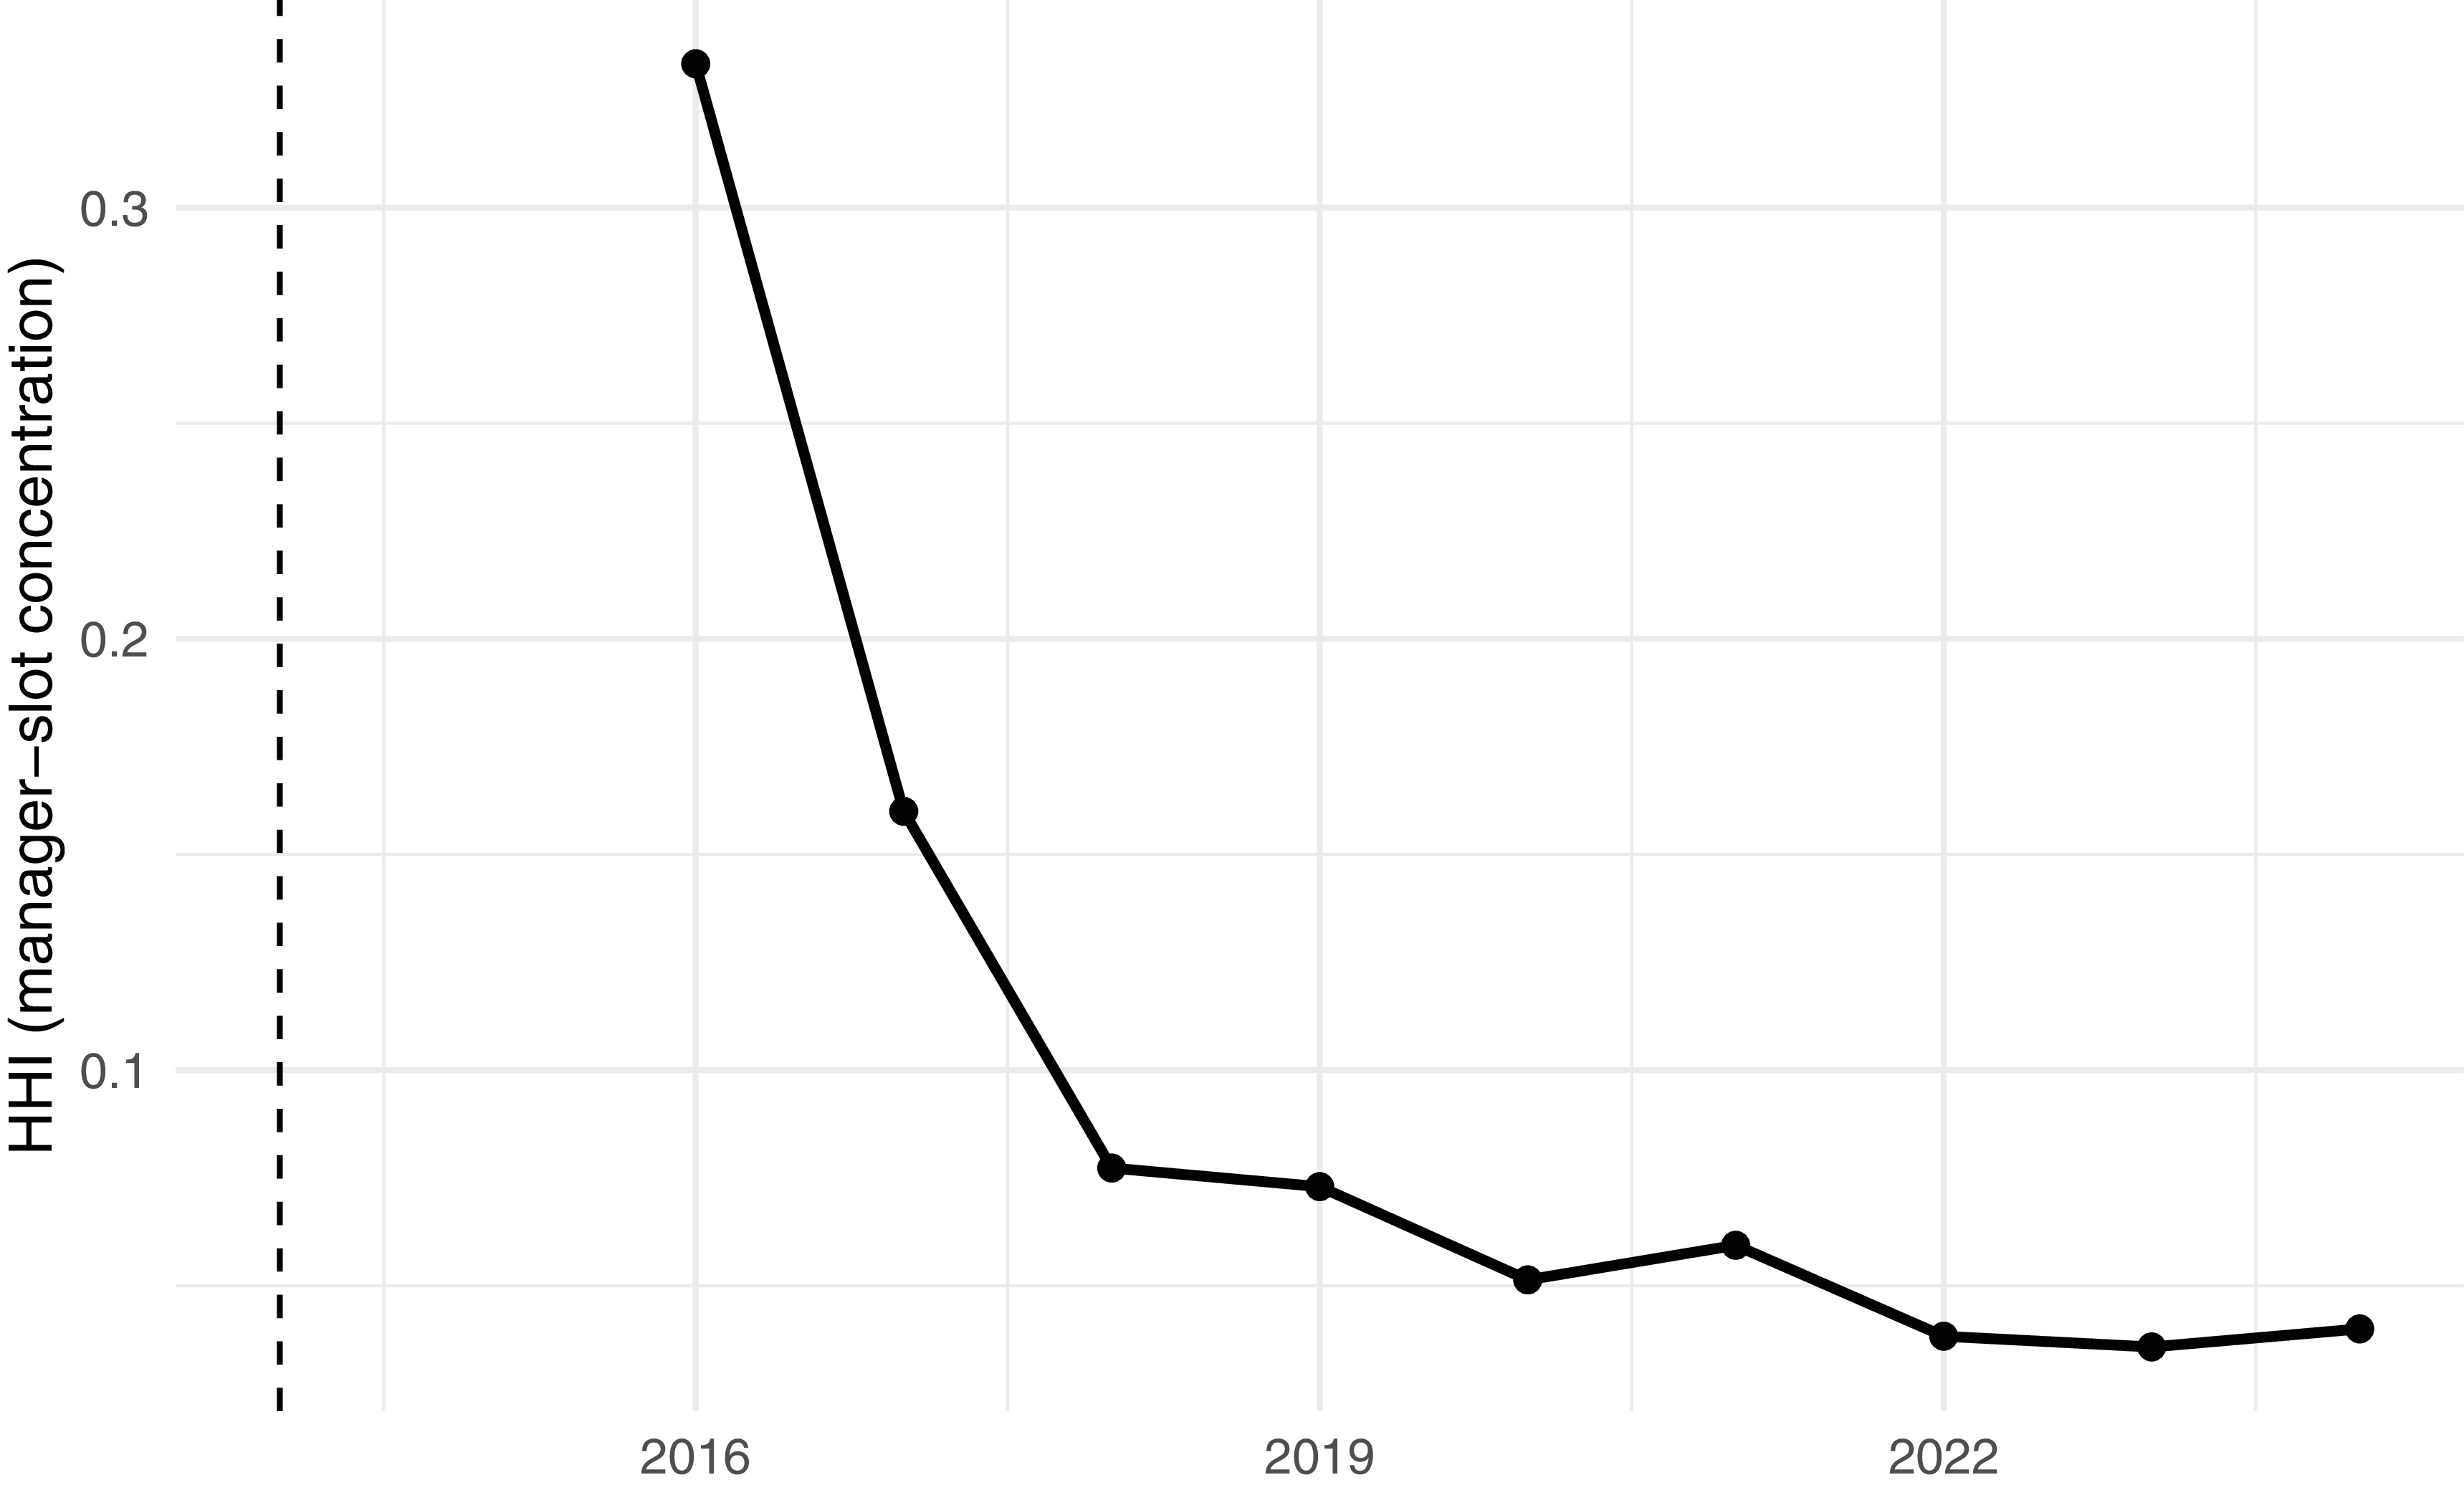
If the infrastructure accumulation mechanism operates as theorized, declining market concentration should accompany the expansion of available templates and trained intermediaries. Table 7 and Figure 5 report the HHI for lead manager positions in sovereign green bonds. In 2016, when only three manager slots existed across all sovereign deals, HHI stood at 0.333. By 2022 to 2023, as the market matured to 321 to 480 annual manager slots, HHI declined to 0.037 to 0.038, reflecting a competitive market with 62 to 68 distinct underwriters.
Lead manager concentration in sovereign green bonds

Table 7 Long description
A table with five columns and nine rows. The columns are labeled Year, Manager slots, Distinct managers, and HHI. The table presents data on the concentration of lead managers in sovereign green bonds over the years. Row 1: 2016, 3, 3, 0.333. Row 2: 2017, 10, 8, 0.160. Row 3: 2018, 29, 17, 0.077. Row 4: 2019, 39, 20, 0.073. Row 5: 2020, 65, 30, 0.051. Row 6: 2021, 189, 40, 0.059. Row 7: 2022, 321, 62, 0.038. Row 8: 2023, 461, 68, 0.036. Row 9: 2024, 258, 54, 0.040.
Notes: HHI uses manager-slot shares; deals may have multiple lead managers. HHI
 $$\gt $$
0.25 indicates high concentration; HHI
 $$\lt $$
0.15 competitive markets.
Sovereign green bond underwriting concentration over time
Notes: HHI for lead manager positions in sovereign green bonds by year. The dashed vertical line marks 2014, the year of the GBP launch. Lower HHI values indicate greater competition.

Empirical Strategy
The analysis tests two empirical implications of the theoretical framework: (1) cumulative private corporate issuance accelerates sovereign entry; and (2) cumulative agency issuance substitutes for it.Footnote 37
Model Specification
The Cox proportional hazards model estimates the timing of a country’s first sovereign green bond issuance.Footnote 38 The event equals one in the year a country first issues a sovereign green bond; countries that do not issue are right-censored. Hazard ratios above one indicate higher issuance likelihood, while ratios below one indicate lower likelihood. Because the key independent variables are cumulative counts, hazard ratios represent the effect of each additional bond added to the accumulated stock, with effects compounding over time.
Models are stratified by OECD membership, allowing separate baseline hazards for developed and developing economies while estimating common covariate effects. Standard errors are clustered by country. Appendix B reports robustness checks with time-varying coefficients, allowing infrastructure effects to evolve as markets mature.
Identification leverages the temporal sequence documented in the earlier section “Bank Leadership in Market Formation”: private corporate deals preceded sovereign entry. Cumulative corporate issuance therefore proxies for the stock of market infrastructure available to potential sovereign entrants. Identification concerns include omitted factors jointly shaping corporate and sovereign timing, reverse causality from anticipated sovereign issuance, and selection into green finance by environmentally committed countries. A later section named “Reverse Causality” addresses these concerns directly.
Variables
The primary independent variables are cumulative bond counts by issuer type: corporate private cumulative
 $$_{t-1}$$
, corporate government cumulative
 $$_{t-1}$$
, financial private cumulative
 $$_{t-1}$$
, financial government cumulative
 $$_{t-1}$$
, agency cumulative
 $$_{t-1}$$
, and municipal cumulative
 $$_{t-1}$$
. The main specifications use counts because the mechanism operates through repeated transactions rather than issuance volume; value-weighted specifications are reported in Appendix E. All are lagged one period to address simultaneity. Distinguishing among issuer types is important because their financing mandates, risk profiles, and political visibility differ, which may shape both their incentives to issue green bonds and the signaling effects on sovereign markets.Footnote
39
Controls capture climate policy commitment, financial and macroeconomic development, and domestic institutions. total climate laws
 $$_{t-1}$$
and climate disasters total
 $$_{t-1}$$
capture domestic climate policy breadth and physical exposure.Footnote
40
Two treaty variables from the International Environmental Agreements Database capture international commitment: treaty cumulative ratified
 $$_{t-1}$$
(total environmental agreements ratified since 1999) and treaty ratified
 $$_{t-1}$$
(a binary indicator of ratification in the previous year), the latter operating as the direct demand-side shifter discussed in the earlier section “Banks As Institutional Entrepreneurs in Green Finance.”Footnote
41
government debt % gdp
 $$_{t-1}$$
accounts for the possibility that sovereign green issuance is shaped by overall debt burdens.Footnote
42
federal is a binary indicator for federal political systems, which create institutional capacity for subnational green issuance that shapes the broader market environment. financial development
 $$_{t-1}$$
, log(gdp per capital)
 $$_{t-1}$$
, gdp growth
 $$_{t-1}$$
, and log(population)
 $$_{t-1}$$
control for economic scale and financial market development.Footnote
43
Domestic institutional factors are captured using electoral local power
 $$_{t-1}$$
and liberal democracy
 $$_{t-1}$$
from Varieties of Democracy.Footnote
44
Empirical Results
Corporate Infrastructure and Sovereign Issuance
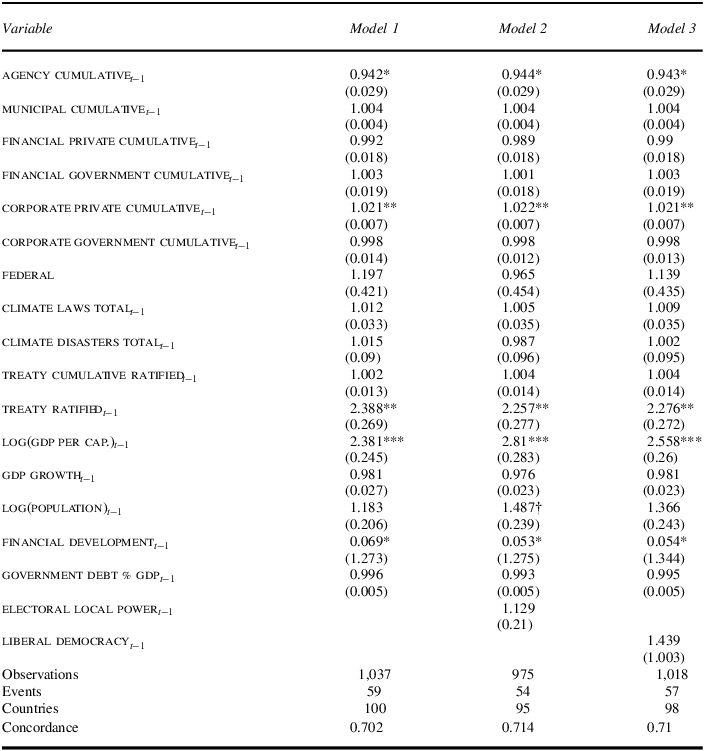
Table 8 reports results from the Cox proportional hazards model stratified by OECD membership; Table 9 summarizes the substantive interpretation of the focal coefficients.
The Cox proportional hazards model: infrastructure accumulation effects

Table 8 Long description
The table presents a comparison of various variables across three models. It has 30 rows and 4 columns. The columns are labeled as Variable, Model 1, Model 2, and Model 3. Each row lists a variable along with its corresponding values in the three models. The variables include AGENCY CUMULATIVE, MUNICIPAL CUMULATIVE, FINANCIAL PRIVATE CUMULATIVE, FINANCIAL GOVERNMENT CUMULATIVE, CORPORATE PRIVATE CUMULATIVE, CORPORATE GOVERNMENT CUMULATIVE, FEDERAL, CLIMATE LAWS TOTAL, CLIMATE DISASTERS TOTAL, TREATY CUMULATIVE RATIFIED, TREATY RATIFIED, LOG(GDP PER CAP.), GDP GROWTH, LOG(POPULATION), FINANCIAL DEVELOPMENT, GOVERNMENT DEBT % GDP, ELECTORAL LOCAL POWER, and LIBERAL DEMOCRACY. Each variable is followed by its value in Model 1, Model 2, and Model 3, along with standard errors in parentheses. The table also includes summary statistics such as the number of observations, events, countries, and concordance for each model.
Notes: Hazard ratios reported. Robust standard errors clustered by country in parentheses. All models stratified by OECD membership.
 $$\dagger$$
 $$p \lt .10$$
; *
 $$p \lt .05$$
; **
 $$p \lt .01$$
; ***
 $$p \lt .001$$
.
Interpretation of key hazard ratio results

Table 9 Long description
A table with four rows and three columns. The columns are labeled Variable, HR, Calculation, and Effect. The rows are as follows: Row 1: Variable, AGENCY CUMULATIVE subscript j-1; HR, 0.942 asterisk; Calculation, (1-0.942) times 100 percent equals 5.8 percent; Effect, Reduces issuance likelihood. Row 2: Variable, CORPORATE PRIVATE CUMULATIVE subscript j-1; HR, 1.021 double asterisk; Calculation, (1.021-1) times 100 percent equals 2.1 percent; Effect, Increases issuance likelihood.
Notes: HR = hazard ratio.
 $$\uparrow$$
indicates increased issuance likelihood;
 $$\downarrow$$
indicates decreased likelihood. Coefficients are from model 1. *
 $$p \lt .05$$
; **
 $$p \lt .01$$
.
The results provide support for the infrastructure accumulation mechanism. corporate private cumulative
 $$_{t-1}$$
is positively and significantly associated with sovereign issuance across specifications, with hazard ratios of 1.021 to 1.022: each additional private corporate green bond in the prior period increases the instantaneous likelihood of sovereign issuance by 2.1 to 2.2 percent.Footnote
45
While the per-bond effect appears modest, the cumulative nature of infrastructure accumulation generates substantial aggregate impacts: ten additional bonds correspond to a 23 percent increase in the issuance hazard, fifty additional bonds to nearly a tripling, consistent with the theoretical account that sovereigns respond to the accumulated infrastructure stock rather than to individual issuances.
By contrast, agency cumulative
 $$_{t-1}$$
is associated with a statistically significant reduction in issuance likelihood, with hazard ratios around 0.942 to 0.944 implying each additional agency bond reduces the hazard by 5.6 to 5.8 percent. Municipal and financial-sector issuance show no consistent relationship with sovereign issuance. The positive coefficient on private corporate issuance captures the downstream effect of bank-built infrastructure documented in the “Bank Leadership in Market Formation” section on sovereign issuance decisions. Results are robust under time-varying coefficient specifications (Appendix B.2).Footnote
46
The strongest single predictor of sovereign issuance is treaty ratified
 $$_{t-1}$$
, with hazard ratios of 2.26 to 2.39 across specifications. Ratification more than doubles the instantaneous likelihood of sovereign green bond issuance, suggesting that treaty commitments create demand for visible climate action. But commitments alone do not provide the market infrastructure needed to operationalize a sovereign green bond program. Prior corporate transactions supply that infrastructure, and its uneven distribution helps explain why roughly half of Paris Agreement ratifiers in the sample have not issued sovereign green bonds (see Table J2 in the appendix).Footnote
47
The three-year median corporate-to-sovereign lag is consistent with this joint-conditions account: treaties raise the political return to issuance; infrastructure lowers its institutional cost.
Agency Substitution Effects
Hazard ratios for agency cumulative
 $$_{t-1}$$
ranging from 0.942 to 0.944 imply that each additional agency bond reduces the instantaneous likelihood of sovereign issuance by 5.6 to 5.8 percent; ten agency bonds correspond to a 44 percent reduction. Agency bonds provide an alternative channel for public-sector green finance: development banks, state-owned utilities, and government-sponsored enterprises fulfill public financing objectives and signal climate commitment without sovereign issuance.
Table 10 illustrates these dynamics. The United States is the extreme case: more than 9,000 agency and 20,000 municipal green bonds since 2012, but no sovereign issuance.Footnote 48 Japan and Australia entered only after long agency-led periods, while Norway and Finland remain outside the sovereign market despite substantial agency issuance. These cases suggest that agency bonds can replace, not merely postpone, sovereign entry.
Agency activity and sovereign issuance: country cases

Table 10 Long description
The table compares agency bonds, first agency year, and sovereign adoption across countries. It has five columns: Country, Agency bonds, First agency, Sov. adopted?, and Sov. year. The rows are as follows: United States: 9,614 All, 5,740 Non-social, 2012 Year, No Sov. adopted, blank Sov. year; Japan: 287 All, 120 Non-social, 2016 Year, Yes Sov. adopted, 2024 Sov. year; China: 101 All, 100 Non-social, 2016 Year, Yes Sov. adopted, 2025 Sov. year; Norway: 45 All, 45 Non-social, 2013 Year, No Sov. adopted, blank Sov. year; Germany: 37 All, 37 Non-social, 2013 Year, Yes Sov. adopted, 2020 Sov. year; Finland: 16 All, 11 Non-social, 2016 Year, No Sov. adopted, blank Sov. year; Netherlands: 16 All, 8 Non-social, 2014 Year, Yes Sov. adopted, 2019 Sov. year; Australia: 15 All, 10 Non-social, 2013 Year, Yes Sov. adopted, 2024 Sov. year; Sweden: 14 All, 14 Non-social, 2015 Year, Yes Sov. adopted, 2020 Sov. year; Spain: 13 All, 6 Non-social, 2015 Year, Yes Sov. adopted, 2021 Sov. year.
Notes: Agency bonds are counted through the year prior to sovereign entry; for non-adopters. All includes every agency bond in the database (Green, Social, and Sustainability labels); Non-Social excludes Social-labeled issuance, matching the green universe used elsewhere in the research note.
Use-of-proceeds disclosures (Table 2) clarify the nature of this substitution. Agencies concentrate in green buildings (83.7 percent) and energy efficiency (33.1 percent), reflecting the mandates of housing finance entities and public utilities. Sovereigns tag broader portfolios across climate adaptation (64.8 percent), biodiversity conservation (51.3 percent), and natural resource management (64 percent)—categories largely absent from agency activity. Agencies therefore substitute politically rather than categorically: they satisfy demand for visible public-sector green debt without requiring governments to issue bonds tied to the broader, more contested portfolio of national climate priorities. When agencies meet this signaling demand, the marginal political return to sovereign entry falls.
Reverse Causality
A natural concern is that the corporate–sovereign relationship reflects common preferences rather than infrastructure accumulation: countries with stronger environmental commitments may attract earlier corporate issuance and faster sovereign entry. A second concern is reverse causality: anticipated sovereign issuance could stimulate corporate activity if firms expect government programs to validate the market, as the conventional sovereign-first model would predict.
To assess this possibility, I reverse the Cox model, using cumulative sovereign issuance to predict first corporate green bond issuance. Sovereign issuance is negatively but insignificantly associated with subsequent corporate issuance (HRs = 0.56 to 0.77; Appendix C and Table C1). This provides little support for common preferences or sovereign catalysis.
Three further tests address related identification concerns. An anticipation test fails to reject the null (
 $$p = 0.139$$
; Appendix P.1); longer-lag specifications at
 $$t-2$$
,
 $$t-3$$
, and
 $$t-4$$
leave the focal hazard ratio positive and significant, with magnitudes growing monotonically (Appendix P.2); and the per-bond effect is statistically homogeneous across subgroups, including when Anglophone OECD countries and the top decile of treatment are excluded (Appendix Q). Unobserved country-level characteristics could still shape both corporate and sovereign timing. But the reverse specification, absence of anticipation effects, and subgroup homogeneity provide meaningful evidence against the most prominent identification threats.
Conclusion
Sovereign green bond markets did not emerge from sovereign leadership alone. They were shaped by financial intermediaries that first built procedural infrastructure through private corporate transactions and later carried that infrastructure into sovereign entry deals. Consistent with this argument, corporate private activity significantly accelerates sovereign issuance: fifty additional corporate bonds nearly triple the hazard of sovereign entry. Agency issuance, by contrast, substitutes for sovereign participation rather than facilitating it. Bank-level evidence complements these results: GBP founding banks underwrote 100 percent of private corporate green bonds before the principles existed, concentrated early contracting among private rather than government-linked firms, and led nearly three-quarters of countries’ sovereign entry deals. Where the design can discriminate between intermediation and general sovereign-debt dominance, the data favor intermediation, though most founder-on-entry observations remain observationally equivalent.
The transmission mechanism’s bite lies in the authority it carries. The GBP consortium did not exercise evaluative authority—assessing actors within an existing market, as credit rating agencies do, or codifying standards later ratified by public bodies, as in Büthe and Mattli.Footnote 49 It exercised constitutive authority: it built the market within which sovereign participation became possible. The procedural expectations, verification conventions, and reputational benchmarks against which sovereign green bonds would be evaluated were established through corporate transactions sovereigns had no role in shaping.
This study specifies a transmission mechanism the bottom-up governance literature has largely treated as a black box.Footnote 50 Financial intermediaries occupying dual positions in private and sovereign debt markets transfer expertise across the public–private divide, making the channel between private market construction and sovereign issuance visible.
Whether the GBP’s authority is durable remains an empirical question. The EU Green Bond Standard, binding since December 2023, partially reasserts public authority by tying proceeds to the EU Taxonomy, but it coexists with the GBP framework rather than replacing it. Subsequent frameworks—regional adaptations, taxonomies, and product-specific instruments—specialized the GBP template rather than displacing it, leaving the GBP as the foundational architecture for later standards (see Appendix T).
The findings carry implications for climate finance strategy. Where corporate markets remain nascent, accelerating sovereign issuance may require building intermediary infrastructure rather than directly incentivizing sovereign entry. Where agency programs are large, the case for sovereign participation must be made on political grounds: accumulated infrastructure alone will not generate entry. As new climate instruments emerge—biodiversity credits, transition bonds, debt-for-nature swaps—the broader logic identified here may recur: intermediaries leveraging dual positions across the public–private divide to shape the terms of sovereign participation.
Acknowledgments
I thank Cameron Ballard-Rosa, Jeff Colgan, Nikhar Gaikwad, Zoe Ge, Layna Mosley, Peter Rosendorff, and the participants at DebtCon8, the Third Annual Politics of Sovereign Finance Conference, and the Climate Pipeline Conference for comments and suggestions. I also thank the editors and three anonymous reviewers for their generous feedback.
Data Availability Statement
Replication files for this research note may be found at <https://doi.org/10.7910/DVN/UQ2ZQS>.
Supplementary Material
Supplementary material for this research note is available at <https://doi.org/10.1017/S0020818326101507>.