INTRODUCTION
Secondary succession involves a feedback mechanism between vegetation and environment. Environmental factors affect plant growth and survival, population dynamics, biotic interactions, and thus community dynamics (Holmgren et al. Reference HOLMGREN, SCHEFFER and HUSTON1997, Loik & Holl Reference LOIK and HOLL2001); in turn, vegetation structure modifies the environmental conditions, determining where, when and which species can regenerate (Lebrija-Trejos et al. Reference LEBRIJA-TREJOS, PÉREZ-GARCÍA, MEAVE, BONGERS and POORTER2010a). The environment also affects soil biota and ecosystem functioning, for example, by influencing nutrient decomposition and cycling (Mayer Reference MAYER2008). Spatial heterogeneity is an important component of environmental variability (Levins Reference LEVINS1968). It is related, for example, to differential emergence, survivorship, and growth of individuals and species within the same habitat (Bazzaz Reference BAZZAZ1996). It can promote coexistence of species with different resource requirements (Pérez-García et al. Reference PÉREZ-GARCÍA, MEAVE, VILLASEÑOR, GALLARDO-CRUZ and LEBRIJA-TREJOS2010, Questad & Foster Reference QUESTAD and FOSTER2008) or reduce species diversity when conditions beyond the tolerances of the species occur (Loucks Reference LOUCKS1970). Environmental seasonality also strongly affects plant establishment and development. It can increase or decrease spatial environmental heterogeneity (Hennenberg et al. Reference HENNENBERG, GOETZE, SZARZYNSKI, ORTHMANN, REINEKING, STEINKE and POREMBSKI2008) or interact with it to create conditions that may be favourable during one season but detrimental in another (Warren Reference WARREN2008).
Vegetation canopy structure has a large influence in the prevailing understorey environmental conditions and resources. Species composition, canopy openness, tree density and vertical stratification affect the light environment in the forest floor (Brown & Parker Reference BROWN and PARKER1994, Canham et al. Reference CANHAM, DENSLOW, PLATT, RUNKLE, SPIES and WHITE1990). A decrease in irradiance following canopy closure entails a decrease in temperature and vapour pressure deficit (Brown Reference BROWN1993, Heithecker & Halpern Reference HEITHECKER and HALPERN2007). Similarly, foliage density and vertical distribution, along with the presence of litter, also modifies soil water content (Camargo & Kapos Reference CAMARGO and KAPOS1995, Marthews et al. Reference MARTHEWS, BURSLEM, PATON, YANGÜEZ and MULLINS2008).
Within the tropical biome, dry forests host a distinct species composition, and possess a lower diversity and a simpler three-dimensional architecture of plant cover compared to wet forests (Murphy & Lugo Reference MURPHY and LUGO1986). Furthermore, one outstanding feature of dry forests is a recurrent leafless canopy for several months each year. Dry forests comprise around 40% of tropical forests worldwide (Mayaux et al. Reference MAYAUX, HOLMGREN, ACHARD, EVA, STIBIG and BRANTHOMME2005), yet few studies have recorded environmental conditions in them (McLaren & McDonald Reference MCLAREN and MCDONALD2003). We are aware of one study that specifically addresses its microclimate (Pinker Reference PINKER1980), but not in the context of vegetation change.
Here we analyse the range and heterogeneity of environmental conditions in temperature, vapour pressure deficit, irradiance and soil water potential to which seeds and seedlings are exposed (regeneration environment), in a series of tropical dry forest (TDF) fallows covering over 60 y of succession and for a mature forest. We test the main hypothesis that the understorey environment of fallows changes predictably with succession (fallow age) and that the changes are distinctly shaped by the structure and seasonality of tropical dry forests. With successional development, the regeneration environment is expected to change from hot, sunny and dry to cooler, shady and moist. As dry forests have a relatively simple vertical stratification, we further hypothesize that such environmental changes are less marked in dry than in wet tropical forests. For the same reason, we also test the hypothesis that changes in basal area and vegetation cover are good predictors of the successional changes in the regeneration environment. Regarding the characteristic seasonality of TDF, we test the hypothesis that it strongly affects the variation in environmental conditions along succession; specifically, that more homogeneous conditions, within and between fallows, occur in the dry leafless season. Our findings are compared with those from other dry and wet tropical forests and the results are discussed in the light of their implications for plant performance and vegetation change.
METHODS
The study was conducted in the tropical dry forest region of Nizanda (16°39ʹ30ʹʹN, 95°00ʹ40ʹʹW), Oaxaca State, southern Mexico. The area has a marked dry season (monthly rainfall < 10 mm) lasting around 6 mo (December–May). Mean total annual rainfall is c. 900 mm and mean annual temperature is c. 26 °C. The vegetation is low-statured TDF (7−8 m) with > 75% of the trees being deciduous, and with few prominent trees attaining 15 m or more (Pérez-García et al. Reference PÉREZ-GARCÍA, MEAVE and GALLARDO2001, Reference PÉREZ-GARCÍA, MEAVE, VILLASEÑOR, GALLARDO-CRUZ and LEBRIJA-TREJOS2010). Large extensions of well-preserved mature or old-growth forest form a matrix including patches of secondary forest derived from agricultural (mostly maize) old-fields (Lebrija-Trejos et al. Reference LEBRIJA-TREJOS, BONGERS, PÉREZ-GARCÍA and MEAVE2008).
The environmental change associated with successional development was assessed by measuring photosynthetically active radiation (PAR), air temperature, relative humidity (RH), soil temperature, and soil water potential (SWP) in the understorey of 18 fallows with ages ranging from 1 to 60 y, and in a mature forest site. Fallow patches have typically a size of < 2500 m2, mostly c. 1000 m2. Permanent plots established in these sites for monitoring succession contain eight 4-m2 quadrats spaced regularly for measuring regeneration (see Lebrija-Trejos et al. Reference LEBRIJA-TREJOS, BONGERS, PÉREZ-GARCÍA and MEAVE2008 for details). Fallow ages were estimated by interviewing land-owners and conducting chronological analyses of tree rings (Brienen et al. Reference BRIENEN, LEBRIJA-TREJOS, VAN BREUGEL, PÉREZ-GARCÍA, BONGERS, MEAVE and MARTÍNEZ-RAMOS2009). Chronosequence trends and development pathways in structure and species composition of individual plots have shown remarkable consistency (Lebrija-Trejos et al. Reference LEBRIJA-TREJOS, MEAVE, POORTER, PÉREZ-GARCÍA and BONGERS2010b).
Environmental measurements were taken in or nearby 144 quadrats in the middle of both the rainy season (lasting from late May to November) and the dry season (lasting from December to May). To reduce the influence of edge-effects to the minimum, the permanent sampling plots have a buffer strip of at least 4 m and no sensor was placed close to this strip. PAR was measured with Licor quantum sensors (Li-190, LI-COR, Lincoln, Nebraska, USA) placed at 50 cm height in seven out of the eight randomly chosen quadrats per plot. Another sensor was raised above the canopy to calculate the percentage PAR reaching the understorey (henceforth simple referred to as PAR). PAR measurements during one day provide good estimates of relative long-term light conditions of understorey micro-sites that are useful for comparisons among forests (Engelbrecht & Herz Reference ENGELBRECHT and HERZ2001). Sensors were placed simultaneously in two plots to record 10-min averages with a 5-s sampling interval. After recording continuously for 2 d, sensors were moved to two other plots until all plots were characterized.
Daylight air temperature and RH were measured at 50 cm height every hour during c. 1.5 mo per season (the approximate length of the PAR measurement period). We randomly placed three HOBO Pro Temp/RH dataloggers (Onset, Bourne, Massachusetts, USA) in ten plots and three HOBO Pro Temp dataloggers in eight plots. Simultaneous records of temperature and RH were used to calculate air vapour pressure deficit (VPD; VPD = VPsaturated air − VPair; VPair = VPsaturated air × RH/100).
Soil temperature was measured using digital thermometers with 12.7-cm-long probes (Alla, Chemillé, France). Thermometers were placed in the same quadrats where SWP was assessed. Temperature was recorded every 3 h from 07h00 to 22h00 during the second day of PAR recordings. For each record, a relative measure of soil temperature was calculated to compare between plots (soil relative temperature = soil temperature − ambient temperature; ambient temperature was recorded by a local meteorological station). The SWP was calculated using the filter-paper method, which allows measurements down to −100 MPa, following the methods for estimation of the soil matric potential described in the D5298–03 standard of American Society for Testing and Materials International, and using the formulas of Leong et al. (Reference LEONG, HE and RAHARDJO2002). Soil samples (0–10 cm depth) were taken on an overcast day in all plots, from six quadrats of a plot.
Seasonal averages for all environmental variables were obtained by calculating the daily mean per quadrat or datalogger, averaging them to obtain the mean for the quadrat or datalogger when necessary, and averaging these in turn to obtain a single final value per fallow. The coefficient of variation (CV) was calculated to indicate environmental heterogeneity in space (in some plots the CVs of air temperature and RH were not calculated because only two out of the three dataloggers were found or worked properly). The successional trends of environmental change were analysed using mean and CV plotted against fallow age. To account for curvilinear relationships, we used GraphPad Prism v. 5.00 to fit non-linear models with a maximum of three parameters, and used Akaike's information criterion corrected for small sample sizes to select the parsimonious model that best described the trends (Motulsky & Christopoulos Reference MOTULSKY and CHRISTOPOULOS2004). Models included polynomial, logarithmic, power and exponential functions used to describe biological responses in time (Ratkowsky Reference RATKOWSKY1990). Effects of seasonality on successional trends were assessed with a repeated-measures analysis of covariance (ANCOVA) using fallow age as covariate. Variables were log10 or square-root transformed when needed to meet the statistical assumptions.
The daily march of environmental factors was illustrated from four plots representative of the successional gradient: a recently abandoned field (< 1 y old), an early to mid-successional fallow (9 y old), a mid- to late one (42 y old) and a mature forest (age unknown). Each point in time is the average of the measurements per quadrat or datalogger.
A principal components analysis (PCA) of environmental variables (air and soil temperature, PAR, RH, SWP and VPD) was used to reveal the major gradients of environmental variation with fallow age. To include RH, an important indicator of atmospheric humidity and the transpiration demand of plants, we estimated missing RH values from the air temperature measurements of the plot. Interpolations were obtained from a linear function fitted to data from 10 plots in which both variables were recorded (RH = −3.59 × air temperature + 180, R = 0.78, P < 0.01). The same procedure was used for VPD (VPD = 0.29 × air temperature − 7.06, R = 0.94, P < 0.001), which is a less common but more direct measure of evapotranspiration demand (Katul et al. Reference KATUL, PALMROTH and OREN2009). As these two variables are closely related by definition and in their dependency on temperature, VPD was excluded from the calculations of the PCA axes but included afterwards as an overlay in the ordination diagram to show its relationship to the gradients of environmental variation. Fallow age was also included as an overlay vector. All variables were standardized to have zero mean and unit variance.
Using simple linear regression we compared the potential of fallow age and forest structure (basal area and vegetation cover) to predict the environmental conditions during succession. Calculations of structural variables included all individuals ≥ 1 cm diameter at 1.3 m height. Vegetation cover was estimated from the sum of the areas of the crowns of individual plants. We took two perpendicular measurements of each crown and used the formula of an ellipse to calculate area; details on the calculation of other structural variables for the fallows are provided in Lebrija-Trejos et al. (Reference LEBRIJA-TREJOS, BONGERS, PÉREZ-GARCÍA and MEAVE2008). For these analyses, the age of the mature forest was set at 90 y; tropical secondary forests older than 80 y are comparable to undisturbed or primary forests (Brown & Lugo Reference BROWN and LUGO1990), and recovery of forest structure in our study area is almost complete by the selected age (Lebrija-Trejos et al. Reference LEBRIJA-TREJOS, BONGERS, PÉREZ-GARCÍA and MEAVE2008). The percentage of PAR was linearized using a log10 transformation. For SWP a quadratic model was used because attempts to linearize this variable were unsuccessful. This was shown by the significance of non-parametric runs test (e.g. standardized runs statistic = −2.43, P = 0.01, for basal area) conducted to check the validity of the simple linear model by testing the null hypothesis that the residuals of the fit are randomly distributed around the expected value (Motulsky & Christopoulos Reference MOTULSKY and CHRISTOPOULOS2004). Runs tests for the residuals of the quadratic fit were not significant.
RESULTS
Seasonal and successional changes in environmental conditions
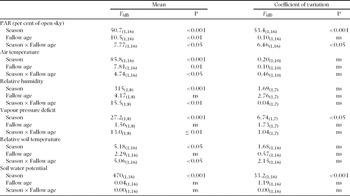
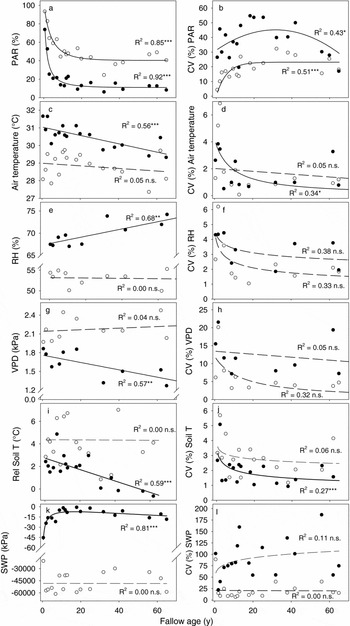
All environmental variables differed strongly with season, whereas fallow age was significant only in the case of PAR and air temperature (Table 1). The apparent irrelevance of fallow age arises from the interaction between season and fallow age, which was significant for all factors but SWP. Most environmental factors changed with fallow age in the wet season, but not in the dry season (Figure 1). Spatial variation (CV) in environmental variables at a given fallow age was highest for SWP and PAR, moderate for VPD, and relatively low for the other environmental variables (Figure 1). The expected differences in spatial variation between seasons were significant for three variables (PAR, VPD, SWP; Table 1), with higher values in the wet than in the dry season (Figure 1).
Results of the repeated-measures ANCOVAs for the averages and the coefficients of variation of six environmental variables measured in 17 tropical dry-forest fallows (secondary-successional sites), plus a mature forest site in Nizanda (Oaxaca), Mexico, in two seasons (rainy and dry). Time since abandonment in fallows ranged from 1 to 60 y. Fallow age was used as the covariate. Means were obtained by calculating the daily means per quadrat/datalogger, averaging them to obtain quadrat/datalogger means, and then averaging these to obtain a single value per fallow. ns = not significant.

Successional variation in environmental conditions of the understoreys of 17 tropical dry forest fallows plus a mature-forest site. Developmental trends of mean conditions (left) and coefficients of variation (right) of photosynthetically active radiation (PAR; a, b), air temperature (c, d), relative humidity (RH; e, f), vapour pressure deficit (VPD; g, h), relative soil temperature (i, j) and soil water potential (SWP; k, l) are modelled using polynomial, logarithmic, power or exponential functions with a maximum of three parameters. Best-fit models were chosen through Akaike's information criterion adjusted for small sample sizes. Lines are continuous for significant fits and broken for non-significant ones. Closed circles indicate data from the wet season, open circles are data from the dry season (* = P < 0.05; ** = P < 0.01; *** = P < 0.001).

Understorey irradiance declined steeply over the first 10 y of succession and more strongly in the wet season (from c. 75% to 15% PAR) than in the dry season (95–45%). PAR changed little afterwards (Figure 1a). The spatial variation in PAR was the second highest after SWP. In the dry season, PAR heterogeneity was initially low and then it stabilized after 20 y; wet-season variation was much higher and had a unimodal pattern with a maximum around 30 y (Table 1; Figure 1b).
The wet-season understorey environment was hotter (overall mean daily air temperature = 30.5 °C) than the dry-season one (28.8 °C) but in the wet season it became cooler with increasing fallow age. The spatial heterogeneity in air temperature did not vary between seasons and was generally low (highest CV < 7%). However, it decreased with fallow age in the dry season (Figure 1d).
As expected, the wet season was more humid and with lower VPD than the dry season (wet-season mean RH = 70% and mean VPD = 1.6 kPa; dry-season mean RH = 53% and mean VDP = 2.2 kPa). From young to old fallows, wet-season RH increased around 10% and VPD decreased around 0.5 kPa. Again, no successional trend was observed in the dry season (Figure 1e, g). The spatial variation of VPD was moderate (with CVs up to 22%) while that of RH was low (Figure 1f, h). The general pattern of greater heterogeneity in the wet season was significant for VPD but not for RH (Table 1).
Patterns in soil temperature resembled those of air temperature (Figure 1i, Table 1). Relative soil temperatures in the wet season were on average 1.6 °C above ambient temperature, whereas in the dry season they were 4.4 °C above it. The wet-season soil temperature decreased with fallow age from above ambient temperature in early and mid-succession, to below it in late-successional and old-growth forests (Figure 1i). Mean soil water potentials were much lower in the dry season (−48 MPa) compared to the wet season (−13 kPa). SWP sharply increased within the first 10 y of succession and declined gradually afterwards (Figure 1k). The spatial heterogeneity of soil temperature did not differ between seasons but declined with fallow age in the wet season (Figure 1j). The spatial heterogeneity of SWP in the wet season was high throughout succession (mean CV = 89%; Figure 1l).
Diurnal patterns
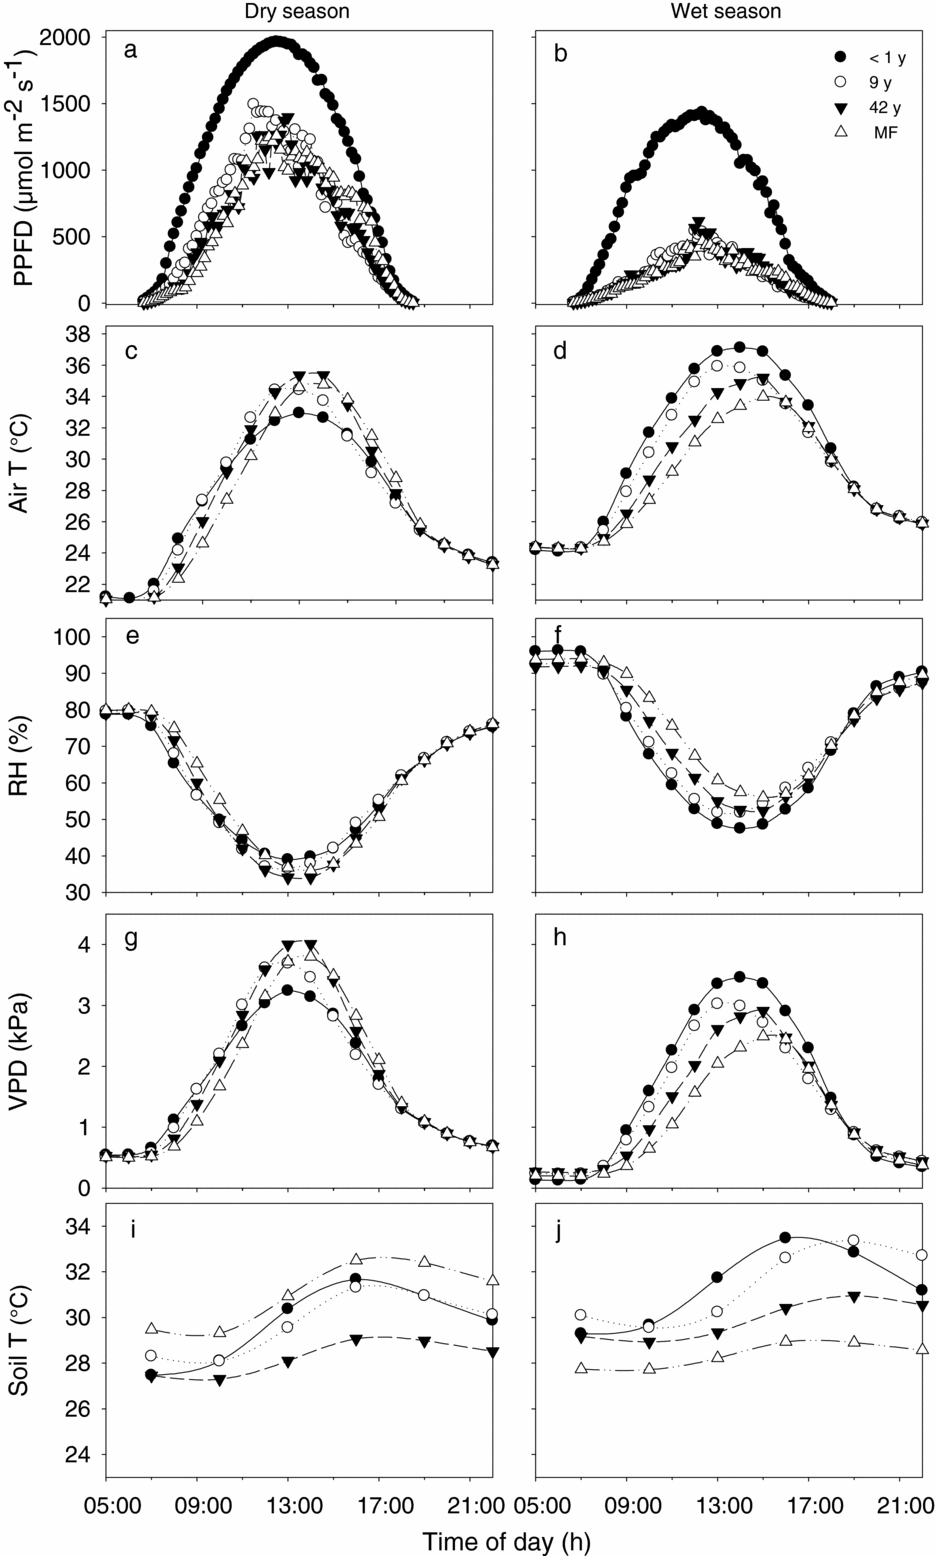
The daily course of PAR in two young and two old plots (< 1 y, 9 y, > 40 y old and mature forest) illustrate that a considerable amount of light reaches the understorey during the dry season despite the significant decline in PPFD with fallow age (Figure 2). Even in the oldest fallows, light levels between 1000–1500 μmol m−2 s−1 occurred for several hours. Such dry-season light availability was well above the midday maxima in the wet season (c. 500 μmol m−2 s−1; Figure 2a, b). The variability with fallow age and between seasons implies large differences in total daily PPFD: the youngest fallow had a total daily PPFD of 48.9 mol m−2 and 32.5 mol m−2 for the dry and wet season, respectively, while in the mature forest this was 26.3 mol m−2 in the dry and 8.2 mol m−2 in the wet season.
Daily marches of understorey environmental conditions of four plots representing the successional gradient of the tropical dry forest in Nizanda, Oaxaca, Mexico: a recently abandoned fallow (< 1 y; closed circles), a 9-y-old fallow (open circles), a 42-y-old fallow (closed triangles), and a mature forest (MF; open triangles). Levels of photosynthetic photon flux density (PPFD; a, b), air temperature (T; c, d), relative humidity (RH; e, f), vapour pressure deficit (VPD; g, h), and soil temperature (i, j) are shown for the dry season (left panels) and the wet season (right panels).
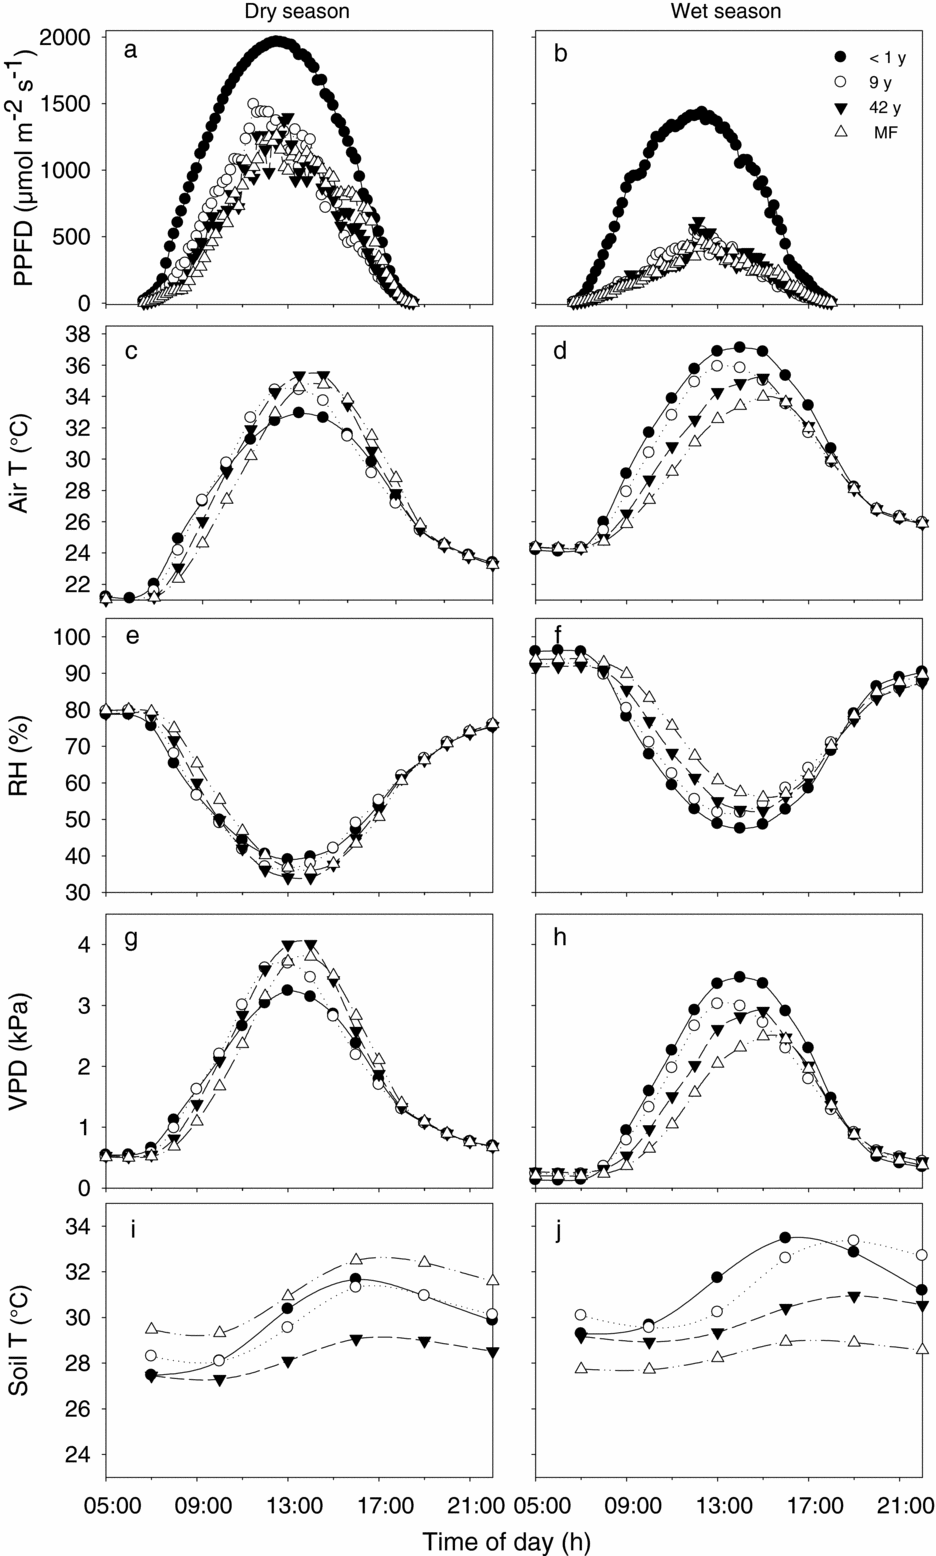
Dry-season differences between the environment of young and old fallows were inconsistent during the day. In early morning hours, young fallows were hotter, less humid and had higher VPD than older fallows, but this pattern reversed around midday (Figure 2c, e, g). In contrast, wet-season patterns were consistent and showed large differences between fallows during most of the day: for instance, from 09h00 to 16h00, the young fallow and the old-growth forest differed from 2.9 °C to 4.7 °C in air temperature, 7.5 to 16.3 percentage points in RH, and 0.6 to 1.4 kPa in VPD (Figure 2d, f, h).
Absolute soil temperatures during the day were mostly higher in the wet than in the dry season (Figure 2i, j). Daily oscillations in the wet season were higher in the youngest than in the oldest plots (3.8 °C–4.2 °C for the young fallows and 1.7 °C–2.0 °C for the old plots), but this was not the case in the dry season when the daily courses of soil temperature were relatively similar between young and old plots (Figure 2i, j).
Multivariate axes of environmental variation
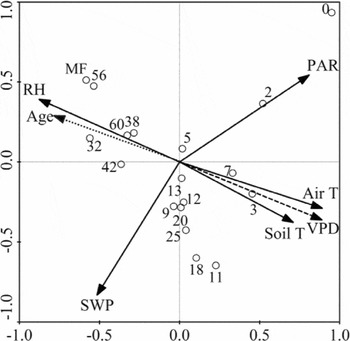
The first axis of the wet-season PCA of environmental factors accounted for 59.7% of total variation. This axis was strongly related (in decreasing order of strength) to air temperature, VPD, RH, PAR and soil temperature (all absolute loadings ≥ 0.7, P < 0.05; Figure 3). The second axis accounted for 27.3% of the variation and was most strongly related to SWP, although PAR was also related to it significantly and with opposite sign (loads = −0.83 and 0.54, respectively). The PCA also shows that temperature variables, RH and VPD are highly correlated among themselves but less so to PAR (minimum r = 0.48 between PAR and soil temperature; all correlations significant at P < 0.05; Figure 3). PAR was the only variable significantly correlated to SWP (r = −0.65, P < 0.01). The first axis of the dry-season PCA explained 48.1% of the environmental variation but still correlated mainly with air and soil temperatures, VPD and RH (not shown).
Principal Components Analysis (PCA) of environmental conditions in the understorey of 17 successional tropical dry-forest fallows plus a mature-forest site. Measures of air temperature (Air T), photosynthetically active radiation (PAR), relative humidity (RH), soil temperature (Soil T) and soil water potential (SWP) were conducted in the wet season. Vapour pressure deficit (VPD) was not included in the PCA calculations but its vector of change (dashed arrow) is included in the plot as an overlay. The figures next to the circles indicate fallow age; the vector of change in fallow age (dotted arrow) is also overlaid. The scaling of the ordination diagram reflects the relationship between the environmental variables and their approximate loadings on the ordination axes. All variables were standardized to mean zero and unit variance.

Effects of forest structure on the environment
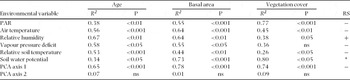
Age, basal area and vegetation cover explained the environmental variation during the wet season (Table 2). Vegetation cover was the best predictor of light availability and SWP; basal area was the best predictor of air temperature, and fallow age was the best predictor of soil temperature, RH and VPD. Basal area, nonetheless, best explained the environmental variation summarized by the first axis of the wet-season PCA (R 2 = 0.78, P < 0.001 versus R 2 = 0.65, P < 0.001 for age). Neither forest structure nor age was related to the second axis of the wet-season PCA. Also, no relation was found between forest structure and age with the dry-season PCA, which confirms that the relationship between environmental variation and succession is largely lost in the dry season.
Proportion of understorey environmental variation (R 2) explained by fallow age (Age), basal area, and vegetation cover, for 17 tropical dry forest fallows plus a mature forest site in Nizanda (Oaxaca), Mexico, during the wet season. Simple linear models were used for the regression except for soil water potential, which was analysed using a quadratic regression model (*). The sign of the regression slope (RS) is shown in the column at the far right of the table. PAR is per cent of open-sky measurement reaching the understorey. Soil temperature is relative to ambient. PCA = principal components analysis. ns = not significant.

DISCUSSION
Changes in average environmental conditions during TDF succession
As expected, sites turn from sunny to shady, from hot to relatively cool, and from very dry to rather moist with development of forest structure, but these changes are mostly noticeable during the wet season, when most species are physiologically more active. The seasonality of the TDF climate is therefore one of its key characteristics and thus has a major influence on the regeneration environment and its variation.
The changes we found through succession are qualitatively, but not quantitatively, similar to those in temperate and humid tropical forests (Bazzaz Reference BAZZAZ1996, Fetcher et al. Reference FETCHER, OBERBAUER and STRAIN1985). Light availability declines sharply with the prompt growth of pioneers (Lebrija-Trejos et al. Reference LEBRIJA-TREJOS, PÉREZ-GARCÍA, MEAVE, BONGERS and POORTER2010a). Nonetheless, because TDF has a low canopy height, a simple vertical stratification and a low leaf biomass (Bullock et al. Reference BULLOCK, MOONEY and MEDINA1995, Lebrija-Trejos et al. Reference LEBRIJA-TREJOS, BONGERS, PÉREZ-GARCÍA and MEAVE2008), the light differential created throughout succession is much weaker than in temperate or humid tropical forests, where, for instance, only < 1% to ~5% of full sunlight reaches the closed-canopy understorey (Canham et al. Reference CANHAM, DENSLOW, PLATT, RUNKLE, SPIES and WHITE1990, Richards et al. Reference RICHARDS, WALSH, BAILLIE and GREIG-SMITH1996), vs. 6–22% in our fallows. Daily total PAR in the understorey of our old-growth forest is at least eight times higher than in tropical rain forests (TRF, sensu lato), where it is generally less than 1 mol m−2 d−1 (Richards et al. Reference RICHARDS, WALSH, BAILLIE and GREIG-SMITH1996).
Like PAR, SWP changed rapidly early in succession. Depending on the balance between evaporation and transpiration, open areas may have a lower, similar or higher soil water content compared with the closed forest understorey (Marthews et al. Reference MARTHEWS, BURSLEM, PATON, YANGÜEZ and MULLINS2008). The relationship between vegetation cover and SWP in our fallows was hump-shaped (Table 2), indicating that soils of young, sparsely covered sites have low SWP because direct irradiance leads to strong evaporative soil-drying. Increased shading with vegetation development leads to a reduction in soil drying; SWP values were highest when pioneer density peaked (Lebrija-Trejos et al. Reference LEBRIJA-TREJOS, MEAVE, POORTER, PÉREZ-GARCÍA and BONGERS2010b). SWP was lower again later in succession, suggesting that the increase of vegetation cover (i.e. transpiration) leads to a decrease in the relative importance of evaporation (Marthews et al. Reference MARTHEWS, BURSLEM, PATON, YANGÜEZ and MULLINS2008).
The linear change in air and soil temperatures, RH and VPD with fallow age, and their relatively weak relationship to PAR (Figure 3), suggests that these changes do not depend solely on the decrease in radiation driven by fast canopy development during early succession. Basal area and soil litter, which change more gradually than vegetation cover (Guariguata & Ostertag Reference GUARIGUATA and OSTERTAG2001, Lebrija-Trejos et al. Reference LEBRIJA-TREJOS, BONGERS, PÉREZ-GARCÍA and MEAVE2008), also modify the understorey environment.
Wet-season SWP was measured during a period of frequent rainfall, so that its values were as high as in TRF during this season (Camargo & Kapos Reference CAMARGO and KAPOS1995, Santiago & Mulkey Reference SANTIAGO and MULKEY2005). However this is not always the case; wet-season SWP can be notably lower in TDF due to high rainfall variability (Veenendaal et al. Reference VEENENDAAL, SWAINE, BLAY, YELIFARI and MULLINS1996). In the dry season, soils dry to SWP levels where water is unavailable to plants.
Tropical forests differ in structure and hence, in the formation of environmental gradients in their understoreys. A comparison with 12 different old-growth TRFs reveals that the mean air temperatures in open and closed areas (22–38 °C, at 0.7–1.5 m above the forest floor) are very similar compared with our dry forest. However, maximum air temperatures are 2–12 °C higher below our TDF closed-canopy sites than in TRF understoreys (Ashton Reference ASHTON1992, Brown Reference BROWN1993, Chiarello Reference CHIARELLO, Medina, Mooney and Vázquez-Yánez1984, Denslow Reference DENSLOW1980, Fetcher et al. Reference FETCHER, OBERBAUER and STRAIN1985, Schulz Reference SCHULZ1960, Whitmore Reference WHITMORE1998). Accordingly, temperatures in the understorey of our old-growth forest are only 3.1 °C cooler than in surrounding open areas, whereas this difference ranges between 3.4 °C and 9.5 °C in TRF. Pinker (Reference PINKER1980) found equally small differences between open and closed areas in a dry forest in Thailand (3 °C).
Differences in relative humidity and VPD between the compared forests show similar patterns. The understorey of our closed dry forests is notably less humid and more desiccating than that of closed TRF (more than 12 percentage points difference in minimum RH and 0.8–2.6 kPa difference in maximum VPD; Camargo & Kapos Reference CAMARGO and KAPOS1995, Chiarello Reference CHIARELLO, Medina, Mooney and Vázquez-Yánez1984, Denslow Reference DENSLOW1980, Fetcher et al. Reference FETCHER, OBERBAUER, CHAZDON, McDade, Bawa, Hespenheide and Hartshorn1994, Kapos Reference KAPOS1989, Schulz Reference SCHULZ1960, Whitmore Reference WHITMORE1998). The same qualitative differences between forest types apply for the open areas (2–24 percentage points difference in minimum RH, and 0.4–2.3 kPa difference in maximum VPD). Besides these spatial differences there may be also important temporal differences in environmental gradients between forest types: for instance, Fetcher et al. (Reference FETCHER, OBERBAUER and STRAIN1985) found that environmental differences between clear-cut and closed-canopy areas of TRF persist for a very short time because of the fast re-growth of vegetation in the clearing (e.g. only ~2 y for VPD and air temperature in a 0.5-ha clearing) whereas differences persist for a much longer time in TDF because of the slow regrowth (Figure 1).
As in other tropical forests, we found higher soil temperatures than air temperatures in open areas, while the opposite was true in closed forests. Comparing soil temperatures amongst studies is complicated by differences in sampling depths, as changes in temperature occur within a few centimetres of soil depth. Additionally, soil temperature is affected by several factors such as soil type, litter cover and canopy cover (Marthews et al. Reference MARTHEWS, BURSLEM, PATON, YANGÜEZ and MULLINS2008, Schulz Reference SCHULZ1960). Absolute soil temperatures in both open and closed areas in our dry forests appear to be higher than in TRF. While mean annual temperature in our dry forest is within the range of rain forests (25–28.5 °C), the maximum soil temperatures at 12 cm soil depth below the closed canopy of our dry forests are 2.5–3.4 °C hotter than in TRF (at 5 cm depth); open areas in our TDF are 2–3 °C hotter than in TRF (absolute differences are conservative as values at same depth would be larger; Ashton Reference ASHTON1992, Lawson et al. Reference LAWSON, ARMSTRONG-MENSAH and HALL1970, Marthews et al. Reference MARTHEWS, BURSLEM, PATON, YANGÜEZ and MULLINS2008, Schulz Reference SCHULZ1960).
Diurnal changes in environmental conditions
The observed diurnal patterns of environmental change highlight the role of seasonality in the differentiation of the regeneration environments in these successional forests. In the dry season the understoreys of both young and old-growth forests are well lit and, depending on the site's orientation, hot and dry at some time of the day. In the wet season, in contrast, the understoreys of young fallows are much hotter and drier than the understoreys of old-growth forests for most daylight time (Figure 2).
As in other forests, diurnal environmental oscillations are larger in open than in closed areas (Figure 2, Ashton Reference ASHTON1992, Schulz Reference SCHULZ1960). However, oscillations in our TDF are higher than in TRF, both under open (young) and under closed (mature) forests. Even under the canopy of mature TDF, daily oscillations in temperature, RH and VPD within the understorey are intense: e.g. 9.7 °C for air temperature vs. 2–7.5 °C in moister tropical forests. The similarity in dry and wet season conditions found between our forest and other TDF (Asbjornsen et al. Reference ASBJORNSEN, ASHTON, VOGT and PALACIOS2004, McLaren & McDonald Reference MCLAREN and MCDONALD2003 for PAR, Cervera et al. Reference CERVERA, ANDRADE, GRAHAM, DURÁN, JACKSON and SIMÁ2007, Ishida et al. Reference ISHIDA, DILOKSUMPUN, LADPALA, STAPORN, PANUTHAI, GAMO, YAZAKI, ISHIZUKA and PUANGCHIT2006 for VPD, Kieft Reference KIEFT1994 for SWP in drought-stressed systems) supports the hypothesis that in the TDF both forest structure and climatic seasonality jointly shape the environmental conditions below its canopy.
Understorey environment and forest structure
Leaves play a key role in light interception and evapotranspiration, and therefore vegetation cover correlated strongly with light availability and SWP. The strong correlation of basal area with temperature and its related variables may be because leaf area scales closely with basal area (Enquist Reference ENQUIST2002); leaf area reduces the transmission of radiation to the forest interior (Asner Reference ASNER1998) whereas tree stems significantly absorb infrared radiation and redistribute heat under the forest canopy (Haverd et al. Reference HAVERD, CUNTZ, LEUNING and KEITH2007, Michiles & Gielow Reference MICHILES and GIELOW2008). Fallow age predicted better than basal area the successional changes in RH, VPD and soil temperature, because it is a variable that integrates various ecosystem processes that affect the understorey environment (e.g. accumulation of soil litter and organic matter; Felton Reference FELTON1979, Uhl et al. Reference UHL, CLARK, CLARK and MURPHY1981). Unbiased and precise estimates of fallow age are difficult to obtain (Brienen et al. Reference BRIENEN, LEBRIJA-TREJOS, VAN BREUGEL, PÉREZ-GARCÍA, BONGERS, MEAVE and MARTÍNEZ-RAMOS2009) and fallow age does not necessarily reflect successional development (van Breugel et al. Reference VAN BREUGEL, MARTÍNEZ-RAMOS and BONGERS2006). Thus, the general strong power of basal area to predict environmental change shows that such a simple and often recorded measure of structural development can be used as a proxy to infer TDF understorey environmental conditions (cf. Brown & Parker Reference BROWN and PARKER1994).
Spatial heterogeneity in environmental conditions
In individual fallows, spatial heterogeneity was higher in the wet than in the dry season, and larger for resources (i.e. water and light) than for conditions (air and soil temperatures, RH and VPD). These results emphasize the relevance of leaf phenology as a seasonal micro-environment driver and may have important implications for differential species growth and survival.
The heterogeneity of light in early succession is relatively low owing to a sparse re-growth of TDF vegetation (Ewel Reference EWEL1980). The light reduction caused by vegetation patches is attenuated by diffuse light scattering from the surrounding open areas. Light contrasts increase with succession, as the vegetation clumps expand vertically and horizontally. Simultaneously, (pioneer) tree mortality increases (Lebrija-Trejos et al. Reference LEBRIJA-TREJOS, MEAVE, POORTER, PÉREZ-GARCÍA and BONGERS2010b), creating canopy gaps which may explain the maintenance of a high PAR heterogeneity until mid- to late succession. In later successional stages, the spatial distribution of trees recruiting into the canopy becomes more regular (Ishii et al. Reference ISHII, TANABE and HIURA2004), decreasing heterogeneity of PAR. Even when mean light availability is similar between closed-canopy sites, its spatial heterogeneity is still substantial, as in temperate and tropical forests (Messier et al. Reference MESSIER, PARENT and BERGERON1998, Nicotra et al. Reference NICOTRA, CHAZDON and IRIARTE1999).
The large spatial heterogeneity in SWP is most likely the result of simultaneous changes occurring along succession. In early stages, SWP heterogeneity may mainly correspond to differences in evapotranspiration rates between vegetation patches and bare soil. As vegetation cover increases, heterogeneity may also result from marked differences in water consumption (and thus transpiration) by (1) species belonging to different functional groups, which coexist mostly at mid-succession (Huc et al. Reference HUC, FERHI and GUEHL1994, Lebrija-Trejos et al. Reference LEBRIJA-TREJOS, MEAVE, POORTER, PÉREZ-GARCÍA and BONGERS2010b), and (2) individuals of different sizes (Küppers et al. Reference KÜPPERS, MOTZER, SCHMITT, OHLEMACHER, ZIMMERMANN, HORNA, KÜPPERS, METTE, Beck, Bendix, Kottke, Makeschin and Mosandl2008), whose frequency distribution reaches its highest variability in old-growth forests (Clark Reference CLARK1996, E. Lebrija-Trejos unpubl. data). The patchy structure of early-successional vegetation may also cause temperature heterogeneity to be higher in early- than in late-successional stages, as in open areas the heating of the soil by direct radiation, and the vertical turbulence and mixing of the air are more localized than under shade (Felton Reference FELTON1979).
Potential implications for species performance
Temperature, RH and VPD varied strongly throughout succession and are key factors steering TDF succession (Lebrija-Trejos et al. Reference LEBRIJA-TREJOS, PÉREZ-GARCÍA, MEAVE, BONGERS and POORTER2010a). High temperature and VPD have negative effects on plant carbon balance and plant water status (Jones Reference JONES1992, Larcher Reference LARCHER2003). Even if water is freely available, short periods with relatively mild levels of VPD (>2 kPa), as found even under closed canopies, markedly reduce photosynthetic gains of tropical drought-avoiding species (Ishida et al. Reference ISHIDA, DILOKSUMPUN, LADPALA, STAPORN, PANUTHAI, GAMO, YAZAKI, ISHIZUKA and PUANGCHIT2006, Shirke & Pathre Reference SHIRKE and PATHRE2004). Many TDF species are filtered out from early successional communities, and recruit more numerously in the shadier and moister late-successional communities (Aerts et al. Reference AERTS, NEGUSSIE, MAES, NOVEMBER, HERMY and MUYS2007, Lebrija-Trejos et al. Reference LEBRIJA-TREJOS, PÉREZ-GARCÍA, MEAVE, BONGERS and POORTER2010a, Lieberman & Li Reference LIEBERMAN and LI1992).
A decreasing irradiance early in succession reduces the time window for pioneer regeneration in these dry forests (Lebrija-Trejos et al. Reference LEBRIJA-TREJOS, PÉREZ-GARCÍA, MEAVE, BONGERS and POORTER2010a). However, the size of this light differential is relatively small, supporting the idea that plant adaptations to shade may be less important in TDF than in wet forests (Gerhardt Reference GERHARDT1996, Swaine et al. Reference SWAINE, LIEBERMAN and HALL1990). In TDF it may be more useful to study plant adaptations to shade in relation to edaphic- and atmospheric drought (Poorter Reference POORTER2009, Valladares Reference VALLADARES2003).
The extreme dry conditions in the atmosphere (RH, VPD) and the soil (SWP) recorded during the dry season are in line with the fact that seedling mortality in TDF occurs mainly in this season (Lieberman & Li Reference LIEBERMAN and LI1992). It also agrees with the fact that most TDF woody plants are drought avoidant (deciduous), contrasting with a limited number of evergreen drought-tolerant species (Eamus & Prior Reference EAMUS and PRIOR2001, Givnish Reference GIVNISH2002) that occur mostly in the mature forests. The low pioneer diversity in TDF (Ewel Reference EWEL1977, Lebrija-Trejos et al. Reference LEBRIJA-TREJOS, BONGERS, PÉREZ-GARCÍA and MEAVE2008) may also be a direct consequence of the year-round harshness of the early successional environment.
The formation of successional microclimatic gradients and the increase in environmental heterogeneity in the rainy season may lead to large growth differences from place to place. Such growth differences may have, in turn, large consequences for dry-season survival as taller and bigger plants have access to water from deeper soil layers or have more carbohydrates and water reserves to survive the dry season (Lieberman & Li Reference LIEBERMAN and LI1992, Myers & Kitajima Reference MYERS and KITAJIMA2007, Poorter Reference POORTER, Burslem, Pinard and Hartley2005). The large spatial heterogeneity in soil water and light availability hence most likely represent important opportunities for resource partitioning. Although lower than in the rainy season, environmental variability during the dry season may be important for established individuals of evergreen and succulent species that remain active during the dry season (Pérez-García et al. Reference PÉREZ-GARCÍA, MEAVE and GALLARDO2001).
Our results suggest that the dry-season environment may be most relevant for plant survival, whereas the wet-season environment may have stronger consequences for plant establishment and growth. However, climatic seasonality should not be simply viewed as an alternation of suitable and unsuitable periods for plant performance: the interplay of the environmental variation observed at several spatial and temporal scales (successional, seasonal, within-fallow spatial) results in a complex and highly dynamic mosaic of environmental conditions. Such complex spatio-temporal changes in conditions and resources are a basic component of habitat diversity and niche differentiation, and are likely to imply differential opportunities for species to enter these communities at different moments in space and time.
ACKNOWLEDGEMENTS
We thank the people of Nizanda for their hospitality and support. Thanks to B. Aranjo, J. López, A. Reyes and G. Reyes for fieldwork collaboration. E. Lebrija-Trejos acknowledges CONACYT, Mexico, for the awarded scholarship. This research was supported by CONACYT-SEMARNAT (grant: 2002-C01-0267) and PAPIIT-UNAM (IN216007-3).