




1. Introduction
Willingness to compete varies strongly across individuals and predicts achievement in education and the labor market. Initial studies in experimental economics focused on documenting that women are less willing to compete in incentivized experimental tasks relative to men (Gneezy et al., Reference Gneezy, Niederle and Rustichini2003; Niederle and Vesterlund, Reference Niederle and Vesterlund2007). A growing follow-up literature shows that competitiveness – measured through incentivized choices or survey items – is a strong predictor of labor market outcomes. People who are more competitive choose more challenging study majors, are more successful in their professional careers, and are more likely to hold leadership positions (Buser et al., Reference Buser, Niederle and Oosterbeek2014; Buser et al., Reference Buser, Niederle and Oosterbeek2026).
In this paper, we provide a more nuanced view of competitiveness by differentiating between different motivations for competing with others. Intuitively, being “competitive” can both refer to an enjoyment of competition and to a desire to win or outperform others. Moreover, people may enter competitions for personal development motivations – to improve themselves. It is largely an open question which of these dimensions of competitiveness are picked up by the measures used in the literature, and how they relate to career outcomes and gender gaps. Another question that has so far not been tackled by the literature is in how far measures of willingness to compete pick up a general drive to seek new challenges, whether competitive or not.
The lab-based literature following Niederle and Vesterlund (Reference Niederle and Vesterlund2007) is mainly focused on gender differences and typically measures willingness to compete as an incentivized binary choice between a winner-takes-all tournament and individual piece-rate incentives.Footnote 1 These studies explicitly posit taste for competition as a new, separate preference. A disadvantage of using incentivized tournament choices to measure this preference is that they are partially determined by expected performance and risk preferences.Footnote 2 Some more recent studies instead measure preferences for competition through non-incentivized questionnaire-based measures. Buser et al. (Reference Buser, Niederle and Oosterbeek2026), for instance, introduce a generally worded single-item survey measure of competitiveness and – using the same survey panel used in this study – demonstrate that it predicts the same career outcomes that are predicted by the incentivized choice measure of Niederle and Vesterlund (Reference Niederle and Vesterlund2007).Footnote 3 They also show that competitiveness is a better predictor of career outcomes than questionnaire-based measures of confidence or risk preferences.Footnote 4 This literature raises the question of what exactly is picked up by these experimental and survey measures.
We first investigate which of the three dimensions of competitiveness – enjoyment of competition, desire to win, and competition for personal development – are picked up by two standard measures of competitiveness: the incentivized measure of Niederle and Vesterlund (Reference Niederle and Vesterlund2007) and the survey question of Buser et al. (Reference Buser, Niederle and Oosterbeek2026), and to what extent these relationships can be explained by general challenge seeking. We then ask how the different dimensions predict career outcomes and wellbeing, and how they relate to other personality traits and preferences. We also analyze how they differ between men and women and whether they can statistically explain gender differences in labor market outcomes.
We do this through a detailed questionnaire which is based on different competition scales from the psychology literature. The questionnaire is an augmented version of Urbig et al. (Reference Urbig, Bönte, Schmutzler, Curcio and Andonova2021), who also differentiate between enjoyment of competition, desire to win, and competition for personal development motives.Footnote 5 The questionnaire contains several questions for each of the competition motives. We elicit these questions in a representative Dutch survey panel. We then link our data to extensive panel data on other psychological traits – including the Big Five personality traits (Goldberg et al., Reference Goldberg, Johnson, Eber, Hogan, Ashton, Cloninger and Gough2006), grit (Duckworth and Quinn, Reference Duckworth and Quinn2009), the “dark triad” traits (Jonason and Webster, Reference Jonason and Webster2010), risk seeking (Dohmen et al., Reference Dohmen, Falk, Huffman, Sunde, Schupp and Wagner2011), and social preferences (Falk et al., Reference Falk, Becker, Dohmen, Huffman and Sunde2023). The panel data also contains detailed indicators of professional achievement and personal wellbeing.
We document several new patterns. 1. Traditional measures of competitiveness mainly pick up a mix of enjoyment of competition and desire to win. 2. Both enjoyment of competition and desire to win predict success in the labor market, but desire to win is negatively correlated with measures of happiness, mental health, and career satisfaction, while these correlations are positive for enjoyment of competition. 3. Of the three dimensions of competitiveness, enjoyment of competition differs most between men and women and has the highest explanatory power for gender gaps in labor market outcomes. 4. Enjoyment of competition is most strongly correlated with risk taking, confidence, extroversion, and mental stability. Desire to win is most strongly correlated with negative reciprocity, lower agreeableness, lower mental stability, Machiavellianism (a tendency to manipulate others), and narcissism. 5. Survey measures of competitiveness partially pick up general willingness to seek challenges but much less so when controls for standard personality traits and economic preferences are added.
Some of these results confirm the findings of the few past studies that have investigated subsets of our research questions. Bönte et al. (Reference Bönte, Lombardo and Urbig2017) correlate competitiveness due to personal development motives as well as a composite measure of other competitiveness items (some of which also appear in the Urbig et al. (Reference Urbig, Bönte, Schmutzler, Curcio and Andonova2021) measure of enjoyment of competition which we use in our questionnaire) with an incentivized competition choice. Similar to our findings, they show that general competitiveness predicts the incentivized choice, but willingness to enter competitions for personal development does not. Urbig et al. (Reference Urbig, Bönte, Schmutzler, Curcio and Andonova2021) show that of the three dimensions of competitiveness, enjoyment of competition differs most strongly between men and women, which is confirmed by our results. They also correlate the different dimensions of competitiveness with established personality traits, finding similar correlations. In terms of the correlations between the different dimensions of competitiveness with career outcomes, we confirm the finding of Urbig et al. (Reference Urbig, Bönte, Procher and Lombardo2020) that enjoyment of competition is a better predictor of entrepreneurship than desire to win or competition for personal development and the finding of Bönte and Piegeler (Reference Bönte and Piegeler2013) that the gender difference in enjoyment of competition can explain part of the gender gap in entrepreneurship.
2. Data
We collected the data on the Dutch LISS (Longitudinal Internet Studies for the Social Sciences) panel. This is an ongoing online survey panel that has been operating since late 2007. It is based on a true probability sample of households drawn from the population register by Statistics Netherlands (www.lissdata.nl). Approximately 7,500 panel members answer yearly “core” questionnaires which cover topics including work, education, wealth, family, and personality. On top of this, researchers can pay to run questionnaires on the panel, which can then be linked to all other data that is available on the respondents. All LISS data, including researcher-run questionnaires, is publicly available to all researchers.
Our competitiveness survey was conducted in July 2021. On top of the questions that elicit the competitiveness dimensions and challenge seeking, the survey also elicited a range of social preferences (Falk et al., Reference Falk, Becker, Dohmen, Huffman and Sunde2023), general willingness to take risk (Dohmen et al., Reference Dohmen, Falk, Huffman, Sunde, Schupp and Wagner2011), grit (Duckworth and Quinn, Reference Duckworth and Quinn2009), and general confidence.Footnote 6 We additionally link this data to the yearly LISS personality core module, which contains the Big Five personality traits (Goldberg et al., Reference Goldberg, Johnson, Eber, Hogan, Ashton, Cloninger and Gough2006) and a follow-up questionnaire that measures the dark triad personality traits and two measures of cognitive skills (need for cognition and cognitive reflection). We also link our competitiveness questionnaire to two general measures of competitiveness collected on the LISS panel by Buser et al. (Reference Buser, Niederle and Oosterbeek2026): an incentivized measure elicited through a procedure that closely followed the design of Niederle and Vesterlund (Reference Niederle and Vesterlund2007) and a generally worded single survey item (“How competitive do you consider yourself to be?”).
The competitiveness survey elicits three dimensions of competitiveness – enjoyment of competition, desire to win and competition for personal development motives – plus general challenge seeking. Most of the questions are taken from the questionnaire of Urbig et al. (Reference Urbig, Bönte, Schmutzler, Curcio and Andonova2021) who also differentiate between enjoyment of competition, desire to win, and competition for personal development motives.Footnote 7 The questionnaire contains the following items – elicited in a randomized order – where respondents are asked to express their agreement on a scale from 1 to 7.
Our questionnaire contains three additional questions compared to the questionnaire of Urbig et al. (Reference Urbig, Bönte, Schmutzler, Curcio and Andonova2021). The first addition consists of the two challenge-seeking questions. We could not find a validated challenge-seeking scale and therefore created our own items, which we kept as general and neutral as possible. The second addition is the fifth desire-to-win question. We added this fifth item based on the intuition that desire to win is also characterized by an aversion to losing. In the online appendix, we show all our main results when excluding this item from the measure of desire to win. Results look very similar.
The social preference questionnaire is based on the Global Preferences Survey of Falk et al. (Reference Falk, Becker, Dohmen, Huffman and Sunde2023) and includes six questions on negative reciprocity, willingness to punish someone who treats others unfairly (third party punishment), positive reciprocity, trust, and altruism. We construct four social preference measures. Negative reciprocity is the mean of the following two questions: “How willing are you to punish someone who treats you unfairly, even if there may be costs for you?” and “If I am treated very unjustly, I will take revenge at the first occasion, even if there is a cost to do so.” Trust is measured as the mean of “I assume that people have only the best intentions” (Falk et al., Reference Falk, Becker, Dohmen, Huffman and Sunde2023) and “Generally speaking, would you say that most people can be trusted, or that you can’ t be too careful in dealing with people?”.Footnote 8 Prosociality is measured as the mean of “When someone does me a favor I am willing to return it” and “How willing are you to give to good causes without expecting anything in return?” (altruism and positive reciprocity). Third-party punishment is measured by agreement with the statement “How willing are you to punish someone who treats others unfairly, even if there may be costs for you?”. Our grit questionnaire is based on the short grit scale of Duckworth and Quinn (Reference Duckworth and Quinn2009). Table A1 in the online appendix shows descriptive statistics for all survey measures we use in the paper. We also use data from a follow-up questionnaire we conducted in February 2023 that elicits the so-called dark triad traits – Machiavellianism (a tendency to manipulate and exploit others), psychopathy (lack of empathy and remorse), and narcissism (excessive self-love and entitlement) – through the short scale of Jonason and Webster (Reference Jonason and Webster2010). The same questionnaire also contains two measures of cognitive skills – a short version of the need for cognition scale (Lins de Holanda Coelho et al., Reference Lins de Holanda Coelho, Hanel and Wolf2020)Footnote 9 and the three-item cognitive reflection test (Frederick, Reference Frederick2005).Footnote 10
We also use the LISS core questionnaires as the source of measures of labor market outcomes and individual wellbeing. The LISS background data contains each respondent’s monthly gross income and level of education. Respondents are asked to update this information every time they answer a survey. The Work and Schooling core module asks respondents to classify their profession.Footnote 11 From this, we construct three indicators of professional position: “Management” (respondent indicated that they hold a “higher supervisory profession” at least once over the five years leading up to our survey), “Supervisor” (respondent indicated that they hold a “higher supervisory profession” or an “intermediate supervisory profession”), and “Professional” (respondent indicated that they work in a “higher academic or independent profession”). We also create indicators of entrepreneurship and self-employment.Footnote 12 The Work and Schooling core module asks respondents how satisfied they are with several aspects of their current employment.Footnote 13 We use the mean of the answers as an indicator of how happy respondents are with their career.
We also use the LISS data to construct several indicators of general wellbeing. The Personality module asks respondents to rate their general happiness on a scale from 0 to 10. The same module asks respondents to rate how close they feel to others, using the Inclusion of Others in the Self scale (Aron et al., Reference Aron, Aron and Smollan1992). Finally, we use the binary response to the question whether respondents take medication for depression or anxiety from the Health module as an “objective” indicator of wellbeing. Fallucchi et al. (Reference Fallucchi, Nosenzo and Reuben2020) find that their non-incentivized measure of competitiveness predicts being a professional athlete. Inspired by this finding, we include a binary indicator for practicing sports as an additional non-labor market life outcome.Footnote 14
Our ability to differentiate between the different dimensions of competitiveness will partially depend on how strongly they are correlated. The correlation matrix in Figure A1 in Online Appendix A shows that they are highly correlated with each other and with challenge seeking, with correlation coefficients between 0.36 and 0.76. We will therefore base our conclusions mainly on multivariate regressions where we include all measures simultaneously.
An often-cited issue when correlating different survey measures with each other is spurious correlation due to common method bias (Podsakoff et al., Reference Podsakoff, MacKenzie, Lee and Podsakoff2003). Our empirical design includes several procedural remedies. First and most importantly, we temporally separated the collection of the different competitiveness measures. The general single-item measure of competitiveness and the incentivized choice measure were collected in March 2017 and April 2018 respectively (Buser et al., Reference Buser, Niederle and Oosterbeek2026). More than three years therefore passed between the elicitation of our new questionnaire measures and the elicitation of the standard competitiveness measures we correlate them with. Likewise, the various life outcome measures we correlate with our survey items were collected through the core LISS modules over the course of several years leading up to our survey. Second, there is methodological separation in that different scales were used for our new survey items (1-7) and the single-item measure (0-10) or the incentivized choice (binary). The same is true for the life outcomes and other personality traits which are all measured on different and diverse scales. Third, item order was randomized across respondents within our competitiveness questionnaire. Finally, respondents to the LISS panel are aware that their anonymity is secured, which should reduce social desirability bias that could be correlated across surveys.Footnote 15
3. Results
We present our results in four steps. First, we investigate which of the three dimensions of competitiveness are picked up by traditional measures of competitiveness, and to what extent these measures pick up a general willingness to seek challenges. Second, we show how the dimensions predict labor market outcomes and personal wellbeing. Third, we take a closer look at gender differences. And fourth, we analyze to which extent each dimension of competitiveness is correlated with other personality traits and economic preferences.
3.1. Which motivations for competing are picked up by standard competitiveness measures?
We will first ask which of the three motivations for competing are picked up by the generally worded survey question of Buser et al. (Reference Buser, Niederle and Oosterbeek2026) and an incentivized tournament entry decision à la Niederle and Vesterlund (Reference Niederle and Vesterlund2007).Footnote 16 The results are shown in Table 1. Columns (1) to (4) show results from regressions of the survey measure on enjoyment of competition, desire to win, and competing for personal development. All measures are standardized and the coefficients therefore represent the increase (in standard deviation units) in general competitiveness that is associated with a one-standard deviation increase in each of the competitiveness dimensions, keeping the other dimensions fixed. In column (2), we add our new survey measure for general challenge seeking. In column (3), we additionally control for risk seeking and confidence, two controls that are often added to regressions to isolate preferences for competition from risk preferences and beliefs. In column (4), we add a range of standard personality traits that are measured in many datasets (grit, extroversion, agreeableness, conscientiousness, stability, and openness). In columns (5) to (8), we repeat these analyses with the incentivized competition choice as the outcome variable. Here, we additionally control for performance in the two baseline rounds. The coefficients therefore represent the difference in the likelihood of choosing the tournament over the piece rate that is associated with a one-standard deviation increase in each of the competitiveness dimensions (relative to a mean sample proportion who choose the tournament of 0.26).
What is picked up by standard measures of competitiveness?

Table 1 Long description
The table examines the relationship between various factors and competitiveness using survey and choice measures. Enjoyment and winning consistently show positive correlations with competitiveness, with enjoyment coefficients ranging from 0.165 to 0.256 and winning from 0.281 to 0.326 in survey measures. Development shows a negative correlation with competitiveness, with coefficients between -0.097 and -0.118 in survey measures and -0.043 to -0.049 in choice measures. Challenge has a positive correlation in survey measures but shows negligible impact in choice measures. Adjusted R-squared values indicate moderate explanatory power, with survey measures ranging from 0.201 to 0.248 and choice measures from 0.082 to 0.099. The table controls for risk, confidence, personality traits, and score in certain columns, which may affect the interpretation of results.
Note: The table shows OLS regressions of the standardized single-item survey measure of competitiveness (columns 1 to 4) and the incentivized tournament choice (columns 5 to 8) on the new competitiveness measures. The single-item survey measure and the incentivized choice measure were collected on the LISS panel by Buser et al. (Reference Buser, Niederle and Oosterbeek2026) in 2017 and 2018 respectively. Personality controls include grit, extroversion, agreeableness, conscientiousness, stability, and openness. Columns 5 to 8 control for performance in the two baseline rounds of the experiment. Robust standard errors in parentheses;
* p<0.10,
** p<0.05,
*** p<0.01.
Without controls, the generally worded single-item survey measure of Buser et al. (Reference Buser, Niederle and Oosterbeek2026) picks up a combination of enjoyment of competition and desire to win. The survey measure also picks up general challenge seeking but controlling for challenge seeking only weakly affects the coefficients on enjoyment of competition and desire to win. When we add controls for risk preferences and confidence in column (3) and other personality traits in column (4), the coefficient on challenge seeking shrinks much more strongly than the coefficients on the competitiveness dimensions. This indicates that standard controls for preferences and personality can help isolate competitiveness from more general challenge seeking. The results for the incentivized choice look quite similar, with enjoyment of competition and desire to win being the two competitiveness dimensions that positively and significantly predict tournament entry. However, the incentivized choice is never significantly associated with our measure of general challenge seeking.
Main result 1:
The measures of competitiveness typically used in the literature are most strongly correlated with enjoyment of competition and desire to win. The survey measure of Buser et al. (Reference Buser, Niederle and Oosterbeek2026) additionally picks up general willingness to seek challenges, but this applies to a much lesser extent when standard personality traits are controlled for.
3.2. Competitiveness and life outcomes
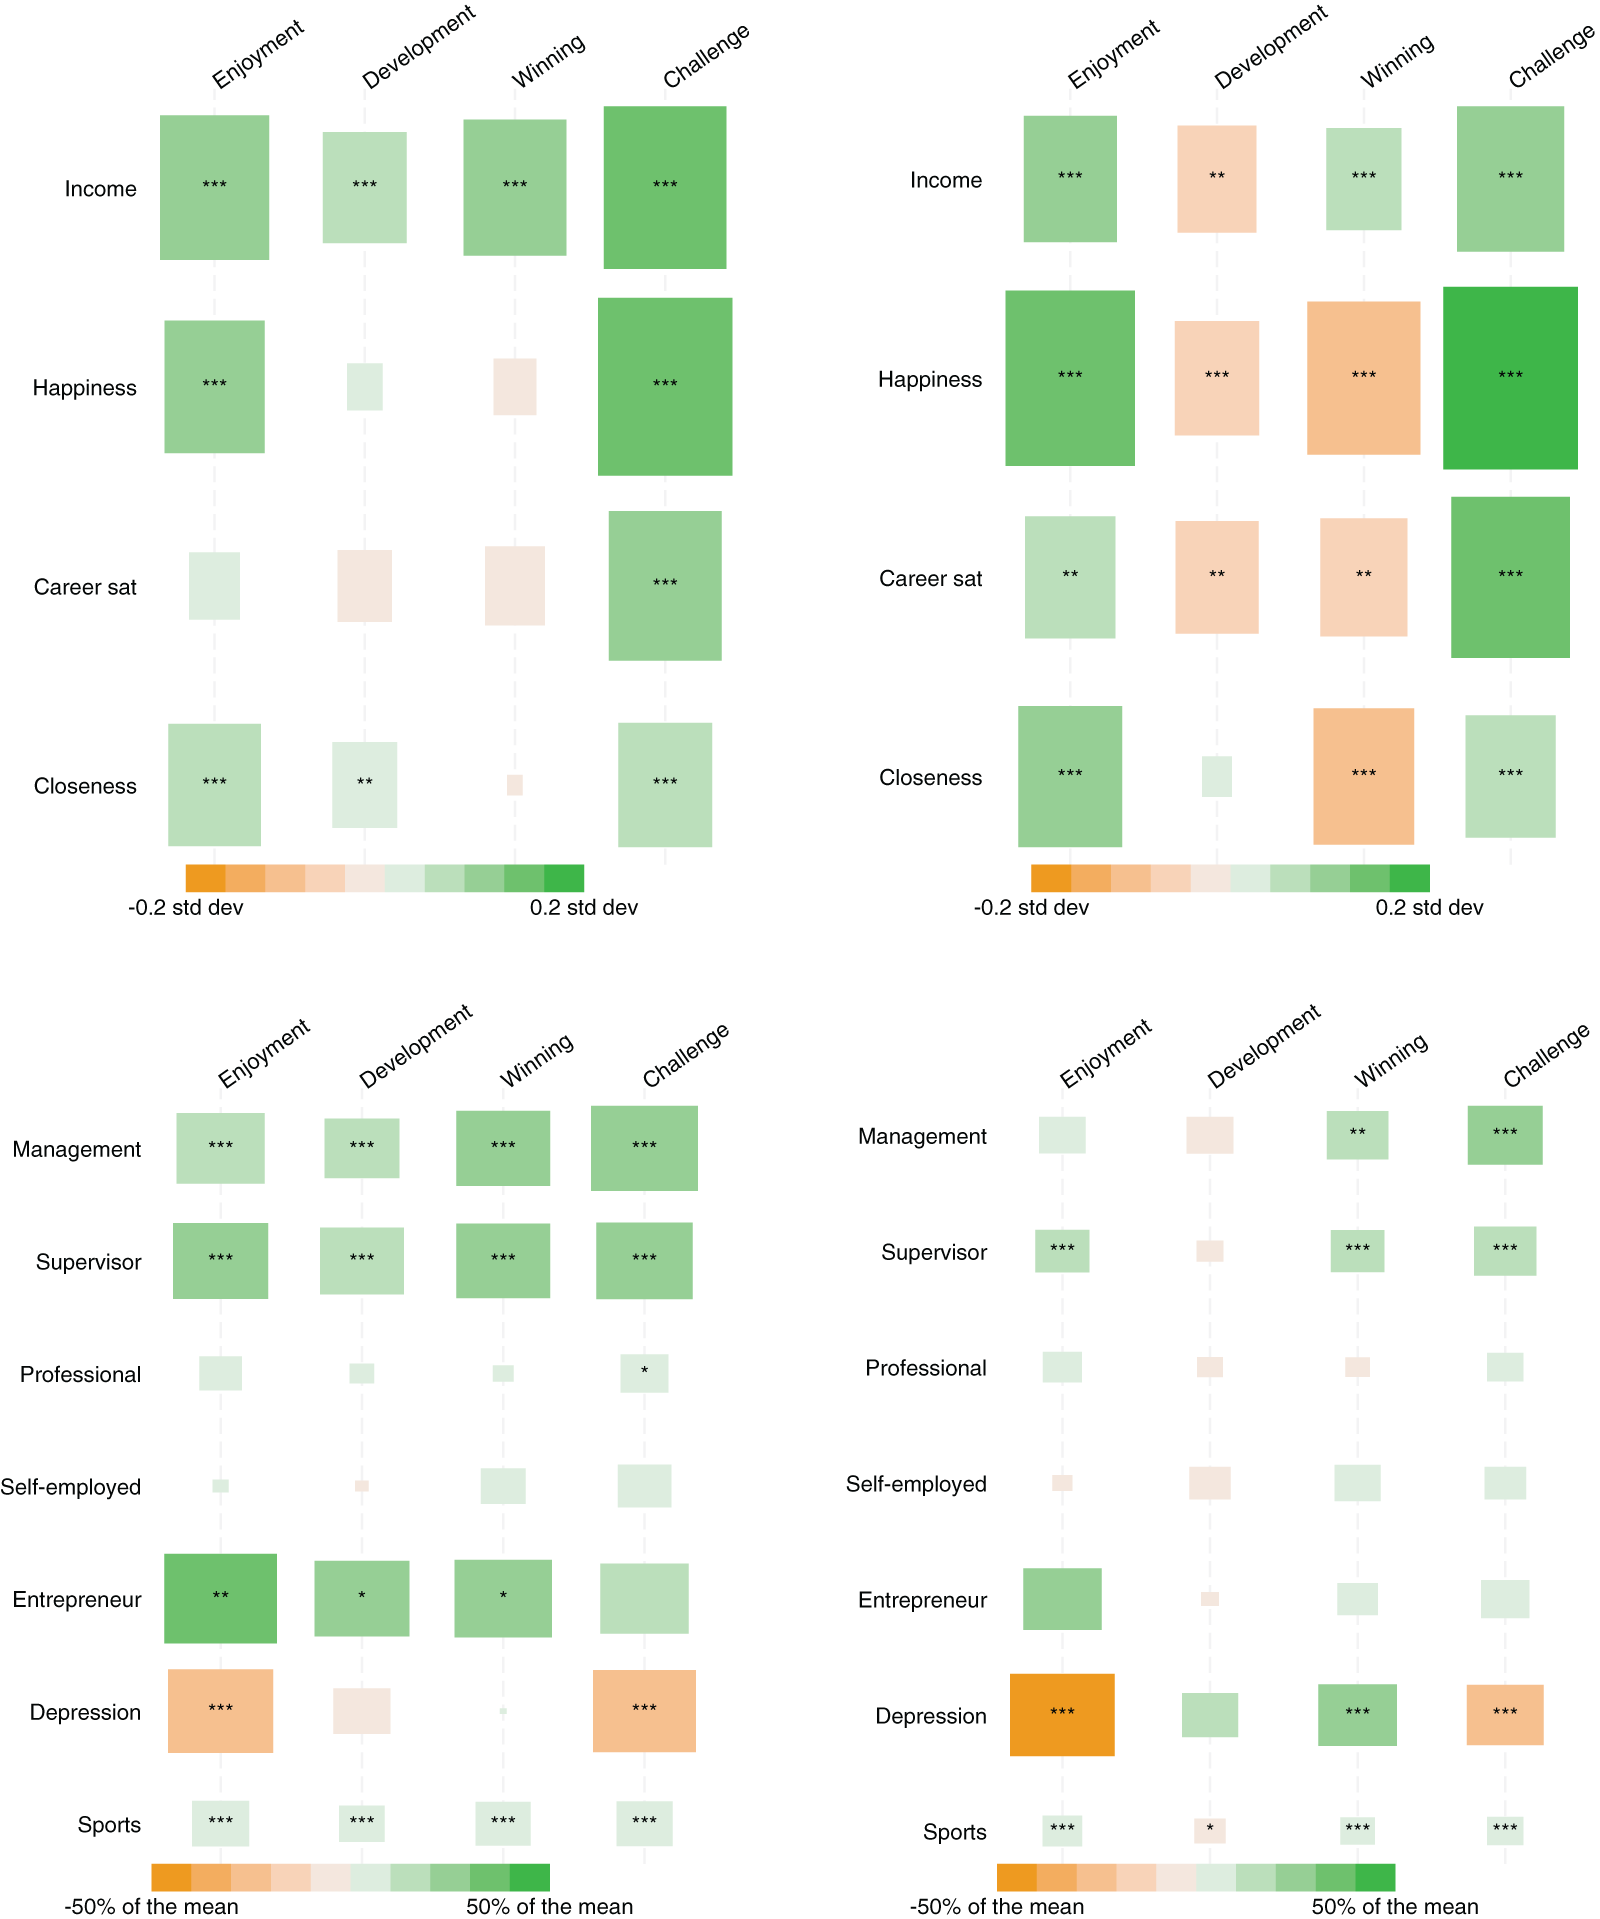
Next, we investigate the predictive power of the three dimensions of competitiveness and general challenge seeking for life outcomes. Figure 1 shows the magnitude and statistical significance of the coefficients from OLS regressions of outcome measures on the standardized competitiveness measures, when included individually and simultaneously. All regressions control for age, gender and education level and the graphs therefore present conditional correlations. Results for continuous outcomes are shown in the top panels. The outcome measures are standardized and the coefficients therefore represent the conditional correlation between a one-standard deviation increase in each competitiveness measure and the outcome in terms of standard deviations. Results for binary outcomes are shown in the bottom panels. To make coefficients comparable across common and rare outcomes, we show the conditional correlations in terms of percent of the sample mean of the outcome variable.Footnote 17 The underlying regression coefficients are shown in the tables in Online Appendix B.
Conditional correlations between competitiveness and life outcomes

Figure 1 Long description
The image consists of four heatmaps, each illustrating correlations between dimensions of competitiveness (enjoyment, development, winning, challenge) and various life outcomes. The top left heatmap shows correlations with income, happiness, career satisfaction and closeness, with varying degrees of positive correlations indicated by green shading and negative correlations by orange shading. The top right heatmap presents similar correlations but with different intensities. The bottom left heatmap displays correlations with management, supervisor, professional, self-employed, entrepreneur, depression and sports, again using green and orange shading to indicate positive and negative correlations, respectively. The bottom right heatmap shows similar correlations with different shading intensities. Each heatmap includes a color scale at the bottom, ranging from negative 0.2 standard deviations to positive 0.2 standard deviations and from negative 50 percent to positive 50 percent of the mean, indicating the strength and direction of the correlations.
We consider several indicators of labor market success and individual wellbeing. The labor market outcomes consist of monthly income at the time of the survey plus binary indicators for having held a management position, having held a supervisory position, having held a professional position, and having been self-employed or an entrepreneur during the five years leading up to the survey. The indicators of individual wellbeing consist of self-rated happiness, self-rated job satisfaction, self-rated closeness to others, and a binary indicator for having taken medication for depression or anxiety during the five years leading up to the survey. We also include practicing sports as an additional non-labor market life outcome that is plausibly related to competitiveness.
The left-hand side graphs show coefficients from regressions where the competitiveness dimensions and challenge seeking are included separately, controlling for gender, age, and education level. Enjoyment of competition, desire to win, competing for personal development, and general challenge seeking all positively and significantly predict success in the labor market as measured by income or holding a management or supervisory position. Enjoyment of competition also significantly predicts entrepreneurship but not self-employment. While all dimensions of competitiveness predict labor market outcomes, only enjoyment of competition and challenge seeking also positively and significantly predict wellbeing. All dimensions of competitiveness correlate with practicing sports.
The magnitudes of these correlations are economically meaningful. For example, a one-standard deviation increase in enjoyment of competition is associated with increases in income and happiness of 0.11 and 0.09 standard deviations respectively. It is also associated with an increase of roughly 20 percent in the likelihood of having held a management or supervisory position.
The right-hand side graphs show coefficients from regressions where the three dimensions of competitiveness and challenge seeking are included simultaneously. Given the strong correlations between the four measures, this will help to disentangle which dimension of competitiveness predict which outcomes. The results show that enjoyment of competition, desire to win, and challenge seeking – but not competing for personal development motives – are all statistically significant predictors of labor market success. However, while both enjoyment of competition and challenge seeking are positively associated with wellbeing, desire to win is consistently negatively associated with wellbeing conditional on the other competitiveness dimensions. A one-standard deviation increase in desire to win is associated with 0.07-0.12 standard deviations lower happiness, career satisfaction and closeness, as well as with a 25 percent increase in the likelihood of recently having taken medication for depression or anxiety.
Main result 2:
Enjoyment of competition and desire to win are both strong predictors of labor market success but have very different implications when it comes to wellbeing. Desire to win is negatively associated with happiness and mental health while associations are positive for enjoyment of competition.
3.3. Gender differences
The economic literature on willingness to compete has to a large extent been focused on gender differences. Most experimental studies either document gender differences in competitiveness (Gneezy et al., Reference Gneezy, Niederle and Rustichini2003; Niederle and Vesterlund, Reference Niederle and Vesterlund2007) – typically finding that women are on average less willing to compete than men – or investigate mechanisms to mitigate the gender gap.Footnote 18 Studies linking measures of willingness to compete to labor market outcomes have investigated whether the gender gap in competitiveness can statistically explain gender differences in education and labor market outcomes.Footnote 19 In this section, we compare the explanatory power of the competitiveness dimensions for gender differences in income and professional status.
Figure A2 in Online Appendix A shows gender differences in competitiveness and labor market outcomes. The upper panel shows the mean of the standardized competitiveness dimensions and challenge seeking – plus the single-item survey question of Buser et al. (Reference Buser, Niederle and Oosterbeek2026) – by gender. Men score themselves significantly higher on all dimensions (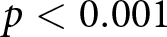 $p \lt 0.001$ in all cases).Footnote 20 The gender difference is largest for enjoyment of competition (0.49 standard deviations) and smallest for challenge seeking (0.19 standard deviations).Footnote 21 Women also have a 1452 lower average monthly income than menFootnote 22 and are much less likely to have held a management, supervisory, or professional position, or to have been an entrepreneur (
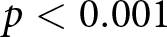 $p \lt 0.001$ in all cases). There is no gender difference in the likelihood of being self-employed.
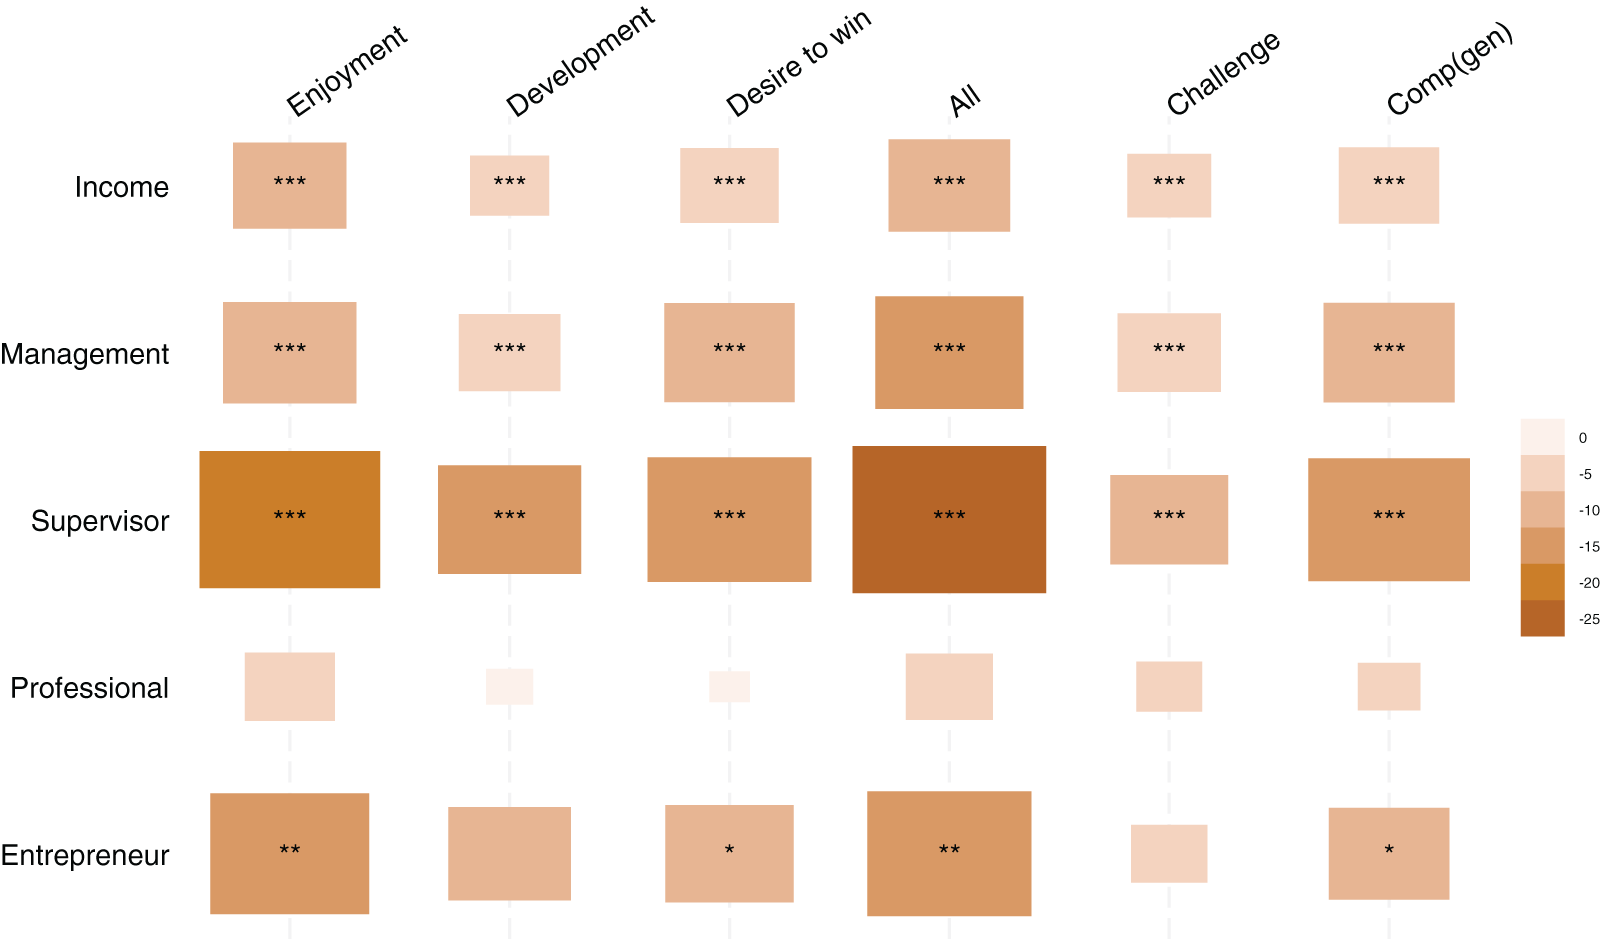
Figure 2 shows the impact of including each of the competitiveness dimensions – as well as all three combined – on the gender gap in the five mentioned labor market outcomes for which we find a significant gap, controlling for age and education. For comparison purposes, the figure also shows the impact of including challenge seeking and the single-item measure of Buser et al. (Reference Buser, Niederle and Oosterbeek2026). Consistent with enjoyment of competition differing most between men and women – and it being a strong predictor of labor market outcomes – it has the strongest explanatory power for gender differences among the three competitiveness dimensions. Inclusion of enjoyment for competition in a regression diminishes the estimated gender gap in income by approximately 8 percent. It also shrinks the gender gap in holding a supervisory position by 21 percent, the gender gap in holding a management position by 11 percent, and the gender gap in entrepreneurship by 16 percent.
Explanatory power of competitiveness for gender gaps in labor market outcomes

Fig. 2 Long description
The heatmap illustrates the impact of different competitiveness dimensions on gender gaps across various labor market outcomes. The dimensions include enjoyment, development, desire to win, all combined, challenge and comp left parenthesis gen right parenthesis. The outcomes measured are income, management, supervisor, professional and entrepreneur. Each cell contains symbols indicating significance levels, with a color gradient representing the magnitude of impact, ranging from zero to negative twenty-five. The supervisor role shows the strongest impact across all dimensions, while the professional role shows the least impact. The symbols used are asterisks, with three asterisks indicating high significance and one asterisk indicating lower significance.
Including all three measures at the same time increases the power to explain gender gaps relative to including each dimension separately. Competitiveness can then explain 10 percent of the gender income gap, 24 percent and 14 percent of the gaps in supervisory and management positions, and 17 percent of the gender difference in entrepreneurship. The explanatory power of challenge seeking is much lower throughout. It is also notable that combining the three detailed measures of competitiveness increases the explanatory power for gender differences in labor market outcomes relative to the generally worded single-item measure. This means that – when possible given space and time constraints – it may be worth eliciting our 15-item questionnaire rather than just a single general item.
Main result 3:
The gender difference in enjoyment of competition statistically explains a significant part of gender differences in income and professional rank. Controlling for the three competitiveness dimensions simultaneously further increases explanatory power, also relative to using a single-item measure of competitiveness.
3.4. Competitiveness and other psychological traits
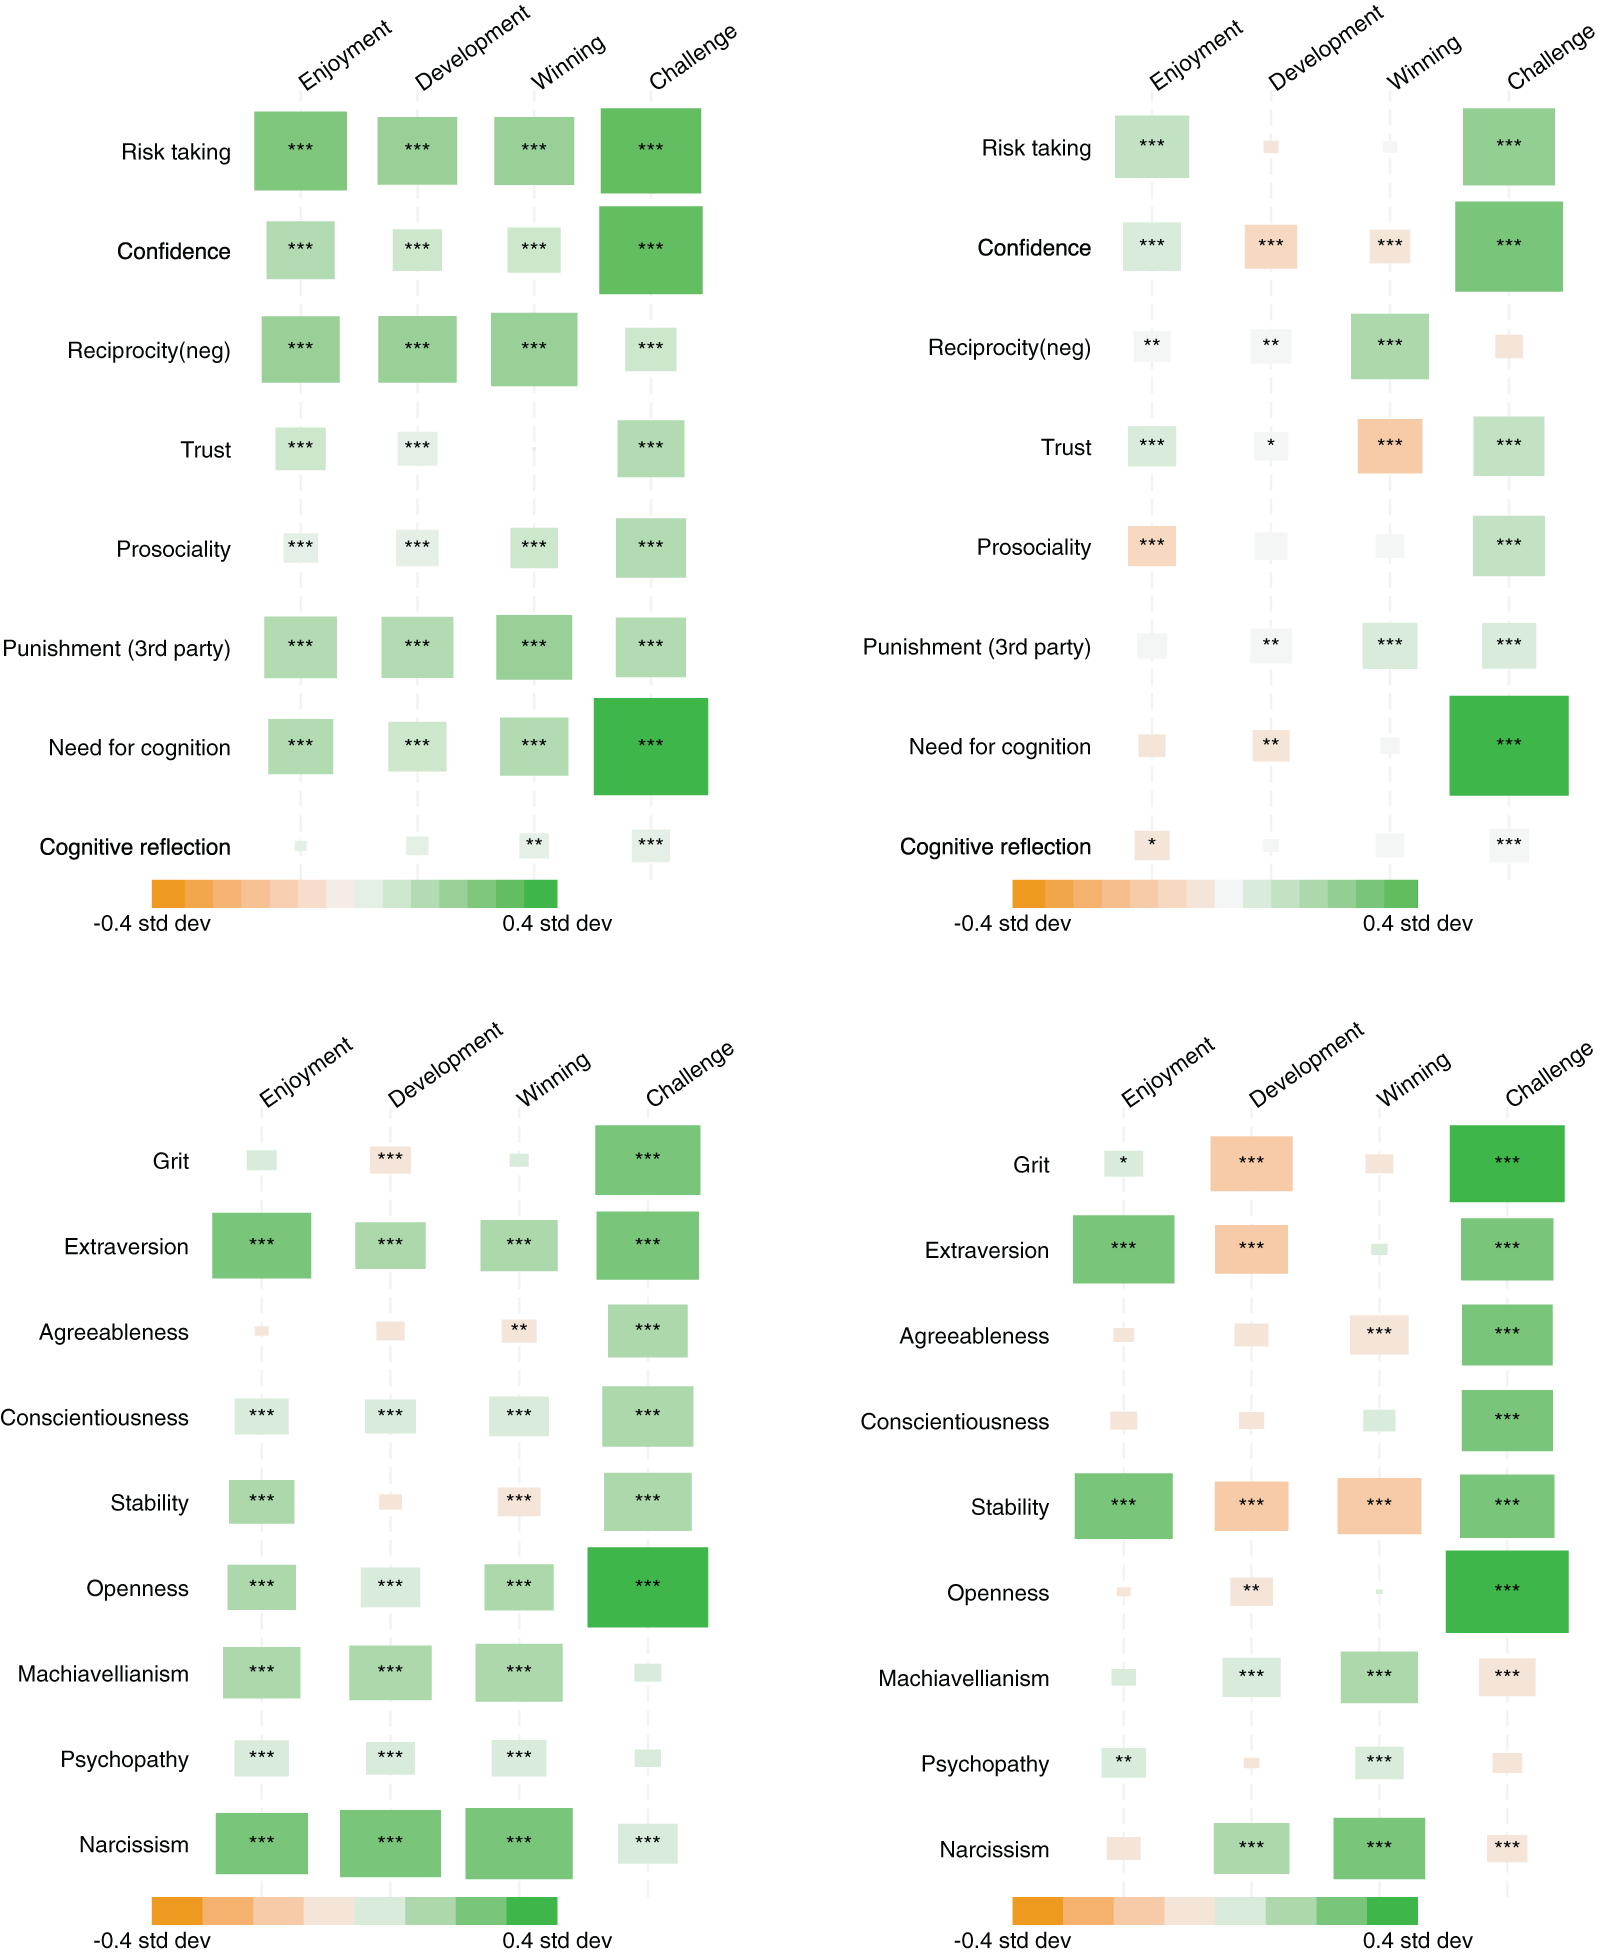
Finally, we investigate how the three dimensions of competitiveness and challenge seeking relate to other personality traits and preferences. On top of the competitiveness measures, our questionnaire also elicited risk seeking (Dohmen et al., Reference Dohmen, Falk, Huffman, Sunde, Schupp and Wagner2011), grit (Duckworth and Quinn, Reference Duckworth and Quinn2009), a range of social preferences (Falk et al., Reference Falk, Becker, Dohmen, Huffman and Sunde2023), and general confidence. In a follow-up questionnaire, we elicited the “dark triad” personality traits (Jonason and Webster, Reference Jonason and Webster2010) and two measures of cognitive skills: the need for cognition scale (Lins de Holanda Coelho et al., Reference Lins de Holanda Coelho, Hanel and Wolf2020) and the cognitive reflection test (Frederick, Reference Frederick2005). We additionally use the Big Five personality traits (Goldberg et al., Reference Goldberg, Johnson, Eber, Hogan, Ashton, Cloninger and Gough2006) which are elicited in the yearly LISS personality core module. Figure 3 shows the magnitude and significance of the coefficients from OLS regressions of these traits on the four competitiveness and challenge seeking measures, both when included individually and simultaneously. The underlying regression coefficients are reported in the regression tables in Online Appendix C.
Conditional correlations between competitiveness and other psychological traits

Fig. 3 Long description
The image contains four heatmaps displaying correlations between various psychological traits and four dimensions of competitiveness: enjoyment, development, winning and challenge. Each heatmap is divided into rows and columns. The rows represent different psychological traits such as risk taking, confidence, reciprocity (negative), trust, prosociality, punishment (third party), need for cognition, cognitive reflection, grit, extraversion, agreeableness, conscientiousness, stability, openness, Machiavellianism, psychopathy and narcissism. The columns represent the four dimensions of competitiveness: enjoyment, development, winning and challenge. Each cell in the heatmaps shows the correlation value, indicated by color intensity, ranging from negative zero point four standard deviation to positive zero point four standard deviation. The color gradient bar at the bottom of each heatmap indicates the range of correlation values, with negative values in orange and positive values in green. Asterisks within the cells denote the significance level of the correlations.
The left-hand side graphs of Figure 3 show coefficients from regressions where the measures are included individually, controlling for gender and age. The right-hand side graphs show coefficients where the four measures are included simultaneously. In the top panels, we report results for economic preferences and cognitive skills (risk seeking, confidence, negative reciprocity, trust, prosociality, third party punishment, need for cognition, and cognitive reflection). In the bottom panels, we look into correlations with classic personality traits (grit, the Big Five traits, and the dark triad).
The first thing that stands out is that challenge seeking is much more strongly correlated with most of the other traits than the three competitiveness dimensions. The exceptions are negative reciprocity and the dark triad traits which are not or only weakly correlated with challenge seeking. This again indicates that controlling for standard personality traits and economic preferences in regressions can help isolate competitiveness from general challenge seeking. It also extends the conclusion of Buser et al. (Reference Buser, Niederle and Oosterbeek2026) that competitiveness is a separate trait that is not well captured by traditionally measured traits and preferences to our new, more detailed survey measures.Footnote 23
We will now look at the multivariate regressions on the right to check whether enjoyment of competition, desire to win, and competition for personal development are differentially associated with other traits and preferences. Enjoyment of competition is most strongly correlated with risk taking, confidence, extroversion, and mental stability. Desire to win and personal development competition are more strongly associated with negative reciprocity, lower mental stability, and higher levels of Machiavellianism and narcissism. Personal development competition is additionally associated with lower levels of confidence and grit. The results further confirm that enjoyment of competition and desire to win – although strongly correlated – are distinct tendencies, with desire to win presenting a darker side of competitiveness.
Main result 4:
General challenge seeking is well-captured by traditionally measured personality traits and preferences. Enjoyment of competition and desire to win are more weakly correlated with other traits, confirming that competitiveness is an important trait in its own right. Enjoyment of competition is most strongly associated with extroversion, mental stability, confidence, and risk seeking, while desire to win is most strongly associated with negative reciprocity, narcissism, Machiavellianism, and lower mental stability.
Other studies have documented correlations between competitiveness and classic personality traits and preferences. Most importantly, Urbig et al. (Reference Urbig, Bönte, Schmutzler, Curcio and Andonova2021) relate the three dimensions of competitiveness – enjoyment of competition, desire to win, and competing for personal development – to the six personality traits defined by the HEXACO framework.Footnote 24 They find that, in a sample of Colombian university students, desire to win is negatively correlated with agreeableness, competing for personal development is positively correlated with emotionality (a trait that is negatively related to mental stability), and enjoyment of competition is positively correlated with extroversion and negatively with emotionality. Our results confirm all of these associations. Buser et al. (Reference Buser, Niederle and Oosterbeek2026) show that their single-item measure of general competitiveness is positively correlated with extroversion and openness (and to a lesser extent mental stability and conscientiousness), as well as risk tolerance and confidence. Many experimental studies present evidence that incentivized competition decisions are predicted by measures of risk preferences and confidence (Niederle and Vesterlund, Reference Niederle and Vesterlund2011; Niederle, Reference Niederle, Kagel and Roth2016). Balafoutas et al. (Reference Balafoutas, Kerschbamer and Sutter2012) experimentally investigate the link between competitiveness and distributional preferences and find that efficiency-minded participants choose competition more often, while spiteful and inequality averse participants avoid it (see also Bartling et al., Reference Bartling, Fehr, Marechal and Schunk2009; Buser et al., Reference Buser, Cappelen and Tungodden2025; Buser and Sangi, Reference Buser and Sangi2025).
4. Conclusion
Individual preferences for competition have consistently been shown to predict education and labor market outcomes as well as gender differences in career choices. In this paper, we provide a more nuanced view of competitiveness by differentiating between different motivations for competing with others. The main narrative that emerges from our data is that willingness to compete – as measured in the literature – captures at least two separate dimensions: enjoyment of competition and desire to win. While these two dimensions are strongly correlated, they are differentially associated with life outcomes and other personality traits.
Both people who compete because they enjoy it and people who are driven to compete by a desire to win and outperform others are professionally more successful than other people. But otherwise, they look very different. People who enjoy competing tend to be happy, mentally stable, extroverted, and willing to take risk. People driven by a desire (or need) to win tend to be less happy, more neurotic, more disagreeable, more manipulative, and more willing to engage in negative reciprocity.
Our results also show that while competitiveness is strongly associated with general challenge seeking, it is distinct. Enjoyment of competition and desire to win predict labor market outcomes and personal wellbeing on top of general challenge seeking. Moreover, challenge seeking is relatively well captured by standard personality traits and preferences, indicating that controlling for other traits partially succeeds in differentiating willingness to compete from a general willingness to seek challenges. Finally, we contribute to the large literature on gender differences in competitiveness by showing that enjoyment of competition differs more between women and men and has stronger explanatory power for gender differences in labor market outcomes than desire to win or general challenge seeking.
Combined, our detailed measures of competitiveness have stronger explanatory power for gender differences than a single-item questionnaire measure of general willingness to compete, indicating that – time and space permitting – it is worth eliciting a detailed competitiveness scale rather than a single item. We also show that for some outcomes, enjoyment of competition and desire to win show divergent correlations, indicating that collecting our more detailed questionnaire rather than a single-item measure can lead to additional qualitative insights. Nevertheless, it is important to emphasize that the three dimensions of competitiveness are strongly correlated with each other and with the single-item measure of Buser et al. (Reference Buser, Niederle and Oosterbeek2026), indicating that there is a general preference for competition that is picked up by either measure.
Past studies have documented associations between competitiveness and many labor market and education outcomes (Lozano et al., Reference Lozano, Ranehill and Reuben2022). Other studies have uncovered features of the cultural and social environment that correlate with and influence preferences for competition (Gneezy et al., Reference Gneezy, Leonard and List2009; Almås et al., Reference Almås, Cappelen, Salvanes, Sørensen and Tungodden2015; Alan and Ertac, Reference Alan and Ertac2019; Boneva et al., Reference Boneva, Buser, Falk and Kosse2022; Buser et al., Reference Buser, Cappelen, Gneezy, Hoffman and Tungodden2021; Jø rgensen et al., Reference Jørgensen, Piovesan and Willadsen2022). When thinking about the origins and consequences of individual and gender differences in preferences for competition, it is interesting to have a close look at what exactly “competitiveness” means. Recent studies have used a variety of methods to differentiate preferences for competition from beliefs and general risk seeking (Gillen et al., Reference Gillen, Snowberg and Yariv2019; Buser et al., Reference Buser, Niederle and Oosterbeek2026; Van Veldhuizen, Reference Van Veldhuizen2022; Lozano and Reuben, Reference Lozano and Reuben2025). Our results indicate that the reason someone is attracted to competition might matter too.
Supplementary material
The supplementary material for this article can be found at https://doi.org/10.1017/esa.2026.10032.
Funding statement
This project has received funding from the European Research Council (ERC) under the European Union’ s Horizon 2020 research and innovation programme (Grant agreement No. 850590).
Competing interests
The authors have no conflicts of interest to report.





 Open access

