

Introduction
Quinoa (Chenopodium quinoa Willd.) is one of the most important food crops of the Andean region of South America (Cusack, Reference Cusack1984). It is an allotetraploid (2n = 4x = 36) that shows disomic inheritance for most qualitative traits (Simmonds, Reference Simmonds1971; Risi and Galwey, Reference Risi and Galwey1984; Ward, Reference Ward2000). The seeds of quinoa are high in protein (~16%) and contain an excellent balance of the amino acids essential to the human diet (Ruales and Nair, Reference Ruales and Nair1992; Ruales et al., Reference Ruales, de Grijalva, Lopez-Jaramillo and Nair2002). Quinoa is uniquely adapted to the harsh conditions that characterize much of the Andean Altiplano (high plains), including high altitudes (3500–3850 m asl), arid (80–600 mm/year) and saline soils as well as frequent frost.
Heightened awareness of quinoa's role in food security issues in Andean South America, and its unique potential as a crop for marginal soils worldwide, and a growing health food export market for quinoa, has led to increased interest in quinoa and the establishment of several new breeding programmes throughout South America. Essential to these breeding programmes is the development of quinoa germplasm collections. We estimate that there are approximately 5000 diverse landraces of quinoa maintained in collections worldwide, including 2700 in Bolivia, 1029 in Peru (Ortiz et al., Reference Ortiz, Ruiz-Tapia and Mujica-Sanchez1998) and 232 in the USDA National Plant Germplasm System (NPGS). An undocumented number of accessions exist in Chile, Argentina, Ecuador and Colombia (Jacobsen, Reference Jacobsen2000; Rojas et al., Reference Rojas, Barriga and Figueroa2000; F. Fuentes, personal communication).
There are relatively few published efforts to characterize genetic diversity within quinoa germplasm collections. Wilson (Reference Wilson1988b) used morphological data combined with data from six isozyme loci to characterize 98 diverse quinoa accessions. His research suggested that (i) the centre of quinoa diversity is likely located in the southern Andean highlands; (ii) accessions of quinoa cluster into two main groups: Andean highland and coastal lowland (hereafter denoted as highland and lowland); (iii) the lowland varieties originated from the southern highland populations; and (iv) the origin of domestication was likely located in the Peruvian/Bolivian region with subsequent dispersals to the north and south.
Ortiz et al. (Reference Ortiz, Ruiz-Tapia and Mujica-Sanchez1988) characterized the 1029 accessions of the Peruvian quinoa germplasm bank at the Universidad National del Altiplano-Puno (UNAP) using eight phenotypic descriptors. Their goal was to derive a representative core collection of 103 accessions using a sampling strategy based primarily on altitude of origin in a geographically stratified, non-redundant procedure. They reported that quantitative trait variation and altitude were highly correlated and demostrated the ability to represent a majority of the range of variation with a 10% core subset.
In another study, Rojas et al. (Reference Rojas, Barriga and Figueroa2000) analysed phenotypic variation within 1512 accessions of the Bolivian national quinoa collection using three multivariate procedures for 17 traits (15 quantitative, two qualitative). Their study included genotypes collected in Chile, Argentina and Peru, as well as native Bolivian materials. Using principal component, cluster and discriminate function analyses, they classified quinoa germplasm into seven distinct groups, including five within the Altiplano and two from lower altitude valleys of the eastern Andean mountain range. Their characters did not discriminate for the Chilean lowland germplasm, which grouped with one of their Altiplano clusters.
The ability to identify genetic variation is indispensable to effective germplasm management and conservation (Roa, Reference Roa2004). Molecular markers provide unique and effective tools for evaluating and characterizing plant genetic diversity in a way that is unaffected by the environment (Gupta and Varshney, Reference Gupta and Varshney2000). Indeed, molecular marker information has proven valuable in several aspects of germplasm management, including (i) identification of genetic identities within collections, (ii) development of genetically diverse core collections (a genetically representative subset of the reserve collection), (iii) monitoring of natural and artificial changes in the genetic collections (e.g. contaminants, hybridizations or mixtures) and (iv) identification of phylogenetic relationships within the germplasm collection and with related weedy species (Hokanson et al., Reference Hokanson, Szewc-McFadden, Lamboy and McFerson1998; Dean et al., Reference Dean, Dahlberg, Hopkins, Mitchell and Kresovich1999; McGregor et al., Reference McGregor, van Treuren, Hoekstra and van Hintum2002). Among the various molecular markers, microsatellites (also known as simple sequence repeats or SSRs), have emerged as the genetic marker system of choice for plant genetic resource analysis, owing to their ease of use, highly polymorphic nature and abundance throughout plant genomes (Maughan et al., Reference Maughan, Saghai Maroof, Buss and Huestis1996; Mace and Godwin, Reference Mace and Godwin2002).
The conclusions derived from Wilson (Reference Wilson1988a, Reference Wilsonb) and the development of the first set of quinoa microsatellite markers (Mason et al., Reference Mason, Stevens, Jellen, Bonifacio, Fairbanks, Coleman, McCarty, Rasmussen and Maughan2005) provide a foundation for an in-depth molecular survey of genetic diversity in this species. We report on the use of 36 fluorescence-tagged SSRs to genetically characterize 153 quinoa accessions from the USDA-NPGS and CIP-FAO collections. Using the patterns of genetic diversity detected within the C. quinoa accessions we discuss Wilson's (Reference Wilson1988a, Reference Wilsonb) hypotheses regarding quinoa's centre of diversity, including highland and lowland clustering patterns, origin of lowland varieties and the origin of domestication.
Materials and methods
Plant material and DNA isolation
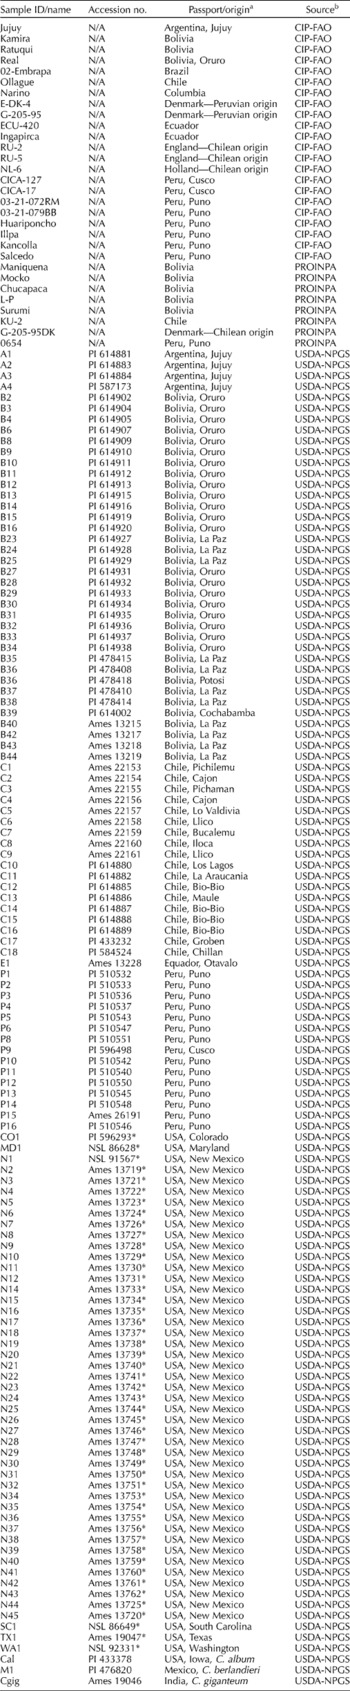
The C. quinoa plant material utilized in this investigation were derived from several sources, namely 121 accessions from the USDA North Central Regional Plant Introduction Station of the US National Plant Germplasm System (Ames, IA; David Brenner), 22 accessions that make up the publicly available international nursery collection developed by the Centro Internacional de la Papa (CIP; Mujica et al., Reference Mujica, Jacobsen, Izquierdo and Marathee1998; Angel Mujica, National University of the Altiplano, Puno, Peru) and eight accessions used as parents in several genetic mapping populations provided by Alejandro Bonifacio (The Foundation for the Promotion and Investigation of Andean Products; PROINPA) (Table 1). We note that the USDA Chenopodium collection consists of 41 accessions included in this analysis that were collected by Emigdio Ballón (Traditional Native American Farmers Association, NM, USA) for which passport (origin) data are unavailable. Hereafter we refer to this specific portion of the USDA collection as the Ballón collection. Personal conversations with Emigdio Ballón suggest that this material was increased in New Mexico prior to its donation to the USDA collection on 15 May 1990.
Passport data on Chenopodium accessions used for microsatellite analysis

a Source of materials was determined from the USDA Germplasm Resources Information Network (GRIN). Accessions lacking specific passport data are denoted with an asterisk and were assigned the US state from which they were donated as their source ID. Accessions donated to the USDA by Emigdio Ballón (Ballón collection) were assigned the source ID ‘USA, New Mexico’.
b USDA-NPGS, USDA North Central Regional Plant Introduction Station of the US National Plant Germplasm System (Ames, IA); CIP-FAO, Centro Internacional de la Papa; PROINPA, The Foundation for the Promotion and Investigation of Andean Products.
Additionally, one accession of C. giganteum D. Don (Ames 19046; a related chenopod crop species) and one accession of C. album L. (PI 433378; lambsquarters or fat hen) were also provided by David Brenner (USDA-NPGS, Ames, IA) and included in our analysis for comparative purposes.
All plant material was grown at 25°C with a 12 h photoperiod in greenhouses at Brigham Young University, Provo, UT, USA. Equal amounts of leaf material were harvested from three individuals and bulked for DNA isolation using a freeze-dried leaf tissue protocol described by Sambrook et al. (Reference Sambrook, Fritsch and Maniatis1989) with modifications described by Todd and Vodkin (Reference Todd and Vodkin1996).
Fluorescent SSR analysis
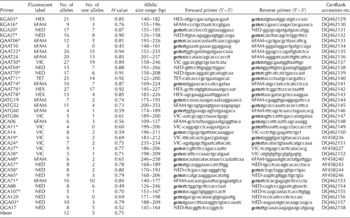
In total, 36 highly reproducible microsatellite primer pairs that produced a simple banding pattern (i.e. all markers amplified a single polymorphic band with the exception of one marker (AAT71) that amplified a second monomorphic band) in prescreen tests and exhibited high heterozygosity values (range 0.33–0.85; mean = 0.59; Mason et al., Reference Mason, Stevens, Jellen, Bonifacio, Fairbanks, Coleman, McCarty, Rasmussen and Maughan2005) were selected for genotyping. Thirty-two of the microsatellite loci were previously described by Mason et al. (Reference Mason, Stevens, Jellen, Bonifacio, Fairbanks, Coleman, McCarty, Rasmussen and Maughan2005), while the remaining four were developed by P. J. Maughan et al. (unpublished data). GenBank accession numbers for all loci are reported in Table 2.
Number of alleles, number of rare alleles, heterozygosity value, primer sequences and GenBank accession number for each microsatellite marker used to assess genetic variation in 150 accessions of quinoa

A total of 420 alleles were amplified across the C. quinoa genotypes ranging from three to 27 alleles per locus (mean = 11.7). Primers that differed for the most common allele between the lowland and highland groups are denoted with an asterisk. Bolded portions of the primer sequences represent the nucleotides (gcttct) added to the primer to facilitate PCR.
Fluorescent labels were added to either the forward or reverse primer with the strongest 3′ end (i.e. the end with the fewest mononucleotide repeats; Table 2). Each fluorescently labelled primer was synthesized by Applied Biosystems (Foster City, CA, USA) with one of the following fluorophores: 6-FAM, TET, HEX, VIC or NED (Table 2). Since all primer pairs for each of the microsatellite loci were originally designed to amplify PCR fragments in a narrow base pair range (150–250 bp) to allow maximal size separation (Mason et al., Reference Mason, Stevens, Jellen, Bonifacio, Fairbanks, Coleman, McCarty, Rasmussen and Maughan2005), allele size multiplexing was not attempted in this experiment. To avoid cross-amplification among primer pairs, each microsatellite was amplified separately in uniplex PCR reactions. PCR reactions consisted of 60 ng of quinoa genomic DNA, 0.2 mM dNTPs, 2.5 mM MgCl2, 1 × PCR buffer, 1.0 μM primer and 1 U of Taq polymerase in a reaction volume of 15 μl. The amplification profile was as follows: 18 cycles of 94°C for 60 s, 67°C for 30 s, 72°C for 60 s, followed by 20 cycles using 58°C as annealing temperature, followed by a final 10 min extension step at 72°C. After amplification, PCR products labelled with three different fluorophores were pooled by combining 2 μl aliquots from each and diluting in 64 μl of HPLC-grade H2O. A 2 μl aliquot of the pooled dilution was then dried down and submitted for size analysis at the BYU DNA sequencing centre (Provo, UT, USA). A size standard (GS-500) containing DNA fragments ranging in size from 35 to 500 bp labelled with the fluorescent dye ROX was added to each pooled sample. Amplified fragments were separated electrophoretically using an ABI 3100 Genetic Analyzer (Applied Biosystems).
Data analysis
Fluorescent peaks were analysed with the GENESCAN prism software version 3.7. Microsatellite alleles sizes were estimated with the GENOTYPER software version 2.1 (Applied Biosystems) and scored using the local southern base calling method for allele sizing (Elder and Southern, Reference Elder, Southern, Bishop and Rawlings1987). The microsatellite data set was converted to binary digits for presence (1) or absence (0) of specific alleles. Loci and accessions for which 25% or greater of the data were missing were removed from the data set. Various diversity measures were calculated from the resulting data, including mean number of alleles per locus, total number of alleles and number of unique alleles. Heterozygosity values for each marker locus were determined following published procedures (Mason et al., Reference Mason, Stevens, Jellen, Bonifacio, Fairbanks, Coleman, McCarty, Rasmussen and Maughan2005).
The data were subsequently analysed using the SIMQUAL subprogram of NTSYS-PC (Rohlf, Reference Rohlf2000) to generate similarity matrices. These similarity matrices were subsequently analysed phenetically using both clustering and ordination algorithms in NTSYS-pc (Rohlf, Reference Rohlf2000). An unweighted pair-group method with arithmetic averages (UPGMA) dendrogram was constructed using a double-centred Jaccard's similarity matrix and rooted using C. album and C. giganteum as outgroups. Principle components analysis (PCA) was performed using a variance–covariance matrix of the data.
Results
Microsatellite diversity
A total of 420 alleles were identified by the 36 microsatellite loci among the 152 quinoa accessions analysed (control species were not included in the analysis). The number of alleles per locus ranged from three (QAAT10) to 27 (QAAT50 and QAAT76) with an average of 11.7 alleles per locus (Table 2). The tri-nucleotide repeat primers amplified a significantly greater number of alleles (t-test; P ≤ 0.05) per locus (average 15.2; n = 15) than did the di-nucleotide repeats (average 9.1; n = 21).
Heterozygosity (H ) values for the microsatellite loci ranged from 0.45 to 0.94 with a mean value of 0.75. As expected, the mean H value in this experiment is larger than the average H value (0.57) reported by Mason et al. (Reference Mason, Stevens, Jellen, Bonifacio, Fairbanks, Coleman, McCarty, Rasmussen and Maughan2005). The increase in the average heterozygosity value in this study is likely due to: (i) the inclusion of only highly informative markers; (ii) better resolution of marker alleles (single base pair resolution) due to the use of capillary electrophoresis; and (iii) the screening of a much larger and likely more diverse panel of genotypes. All of these factors should lead to an increase in number of alleles observed and consequently increased H values. According to the definition of Ott (Reference Ott1992), markers are considered polymorphic if H ≥ 0.1 and highly polymorphic if H ≥ 0.7, thus all of the microsatellite markers utilized in this study were polymorphic and 25 (69%) were highly polymorphic.
The allelic size range variation (defined as base pairs from smallest to largest allele) at a microsatellite locus was highly correlated (P ≤ 0.01) with the total number of alleles identified per locus (r = 0.71; Table 2). Since different microsatellite loci carrying the same fluorescent label can be simultaneously analysed in the same gel lane/capillary column if their allele size ranges do not overlap, the determination of the full allelic size range for these microsatellite markers represents an important step towards the future development of multiplex marker sets based on allele size ranges. Such multiplexed sets will dramatically reduce the cost associated with genotyping. Several researchers have reported the development of six- and nine-plex marker systems for a wide variety of crop species including soybean (Diwan and Cregan, Reference Diwan and Cregan1997), sunflower (Tang et al., Reference Tang, Kishore and Knapp2003) and rape seed (Tommasini et al., Reference Tommasini, Batley, Arnold, Cooke, Donini, Lee, Law, Lowe, Moule, Trick and Edwards2003). In the present study, the average allelic range across the microsatellites was 37 bp (Table 2).
Rare and high-frequency microsatellite alleles
Rare alleles, defined as those that were observed in less than 5% of the accessions were detected at all loci, except QAAT10, QCA11 and QCA120 (Table 2). QAAT50 displayed the highest number of alleles (27), and the highest percentage (70%) of rare alleles (19/27 alleles; Table 2). Not unexpectedly, and as seen by other researchers (Jain et al., Reference Jain, Jain and McCouch Lima, Peru2004), a positive significant correlation existed between the number of rare alleles and the number of alleles per locus (r = 0.96). Rare alleles are of particular value for variety identification via DNA fingerprinting.
High-frequency alleles (common alleles) were seen within the majority of the loci analysed. Indeed, on average 76 (50%) of the 152 accessions shared a common allele at any given locus. A negative correlation between the frequency of the most common allele at a locus and the number of alleles per locus was observed (r = − 0.78). Within the group of 81 highland accessions the average frequency of shared alleles was 53%, whereas within the group of 71 lowland (including the Ballón collection) ecotypes the frequency of shared alleles rose to 61%, suggesting a lower level of genetic diversity within the coastal ecotypes. Moreover, a comparison of the most common allele observed in the highland and lowland ecotype groups indicated that the most common allele differed between the groups in 25 of the 36 microsatellite loci (microsatellite markers that differed for the most common alleles between the two groups are marked with an asterisk in Table 2). Based on the highest allele frequency alone, the two groups could be distinguished from each other at 69% of the microsatellite loci.
Heterogeneity
Genetic heterogeneity, detected as multiple alleles at a genetic locus within an individual accession (allele mixtures), was observed on average in 32% of the quinoa accessions per microsatellite locus. The presence of heterogeneity in the quinoa accessions was not unexpected and may be explained by low levels of residual heterozygosity at individual loci due to outcrossing during seed maintenance (outcrossing estimates range from 8 to 10%; A. Bonifacio, personal communication) or as a result of seed mixtures of contrasting homozygous (or heterozygous) lines inherent to the heterogeneous quinoa seed lots, which would be detected as a result of the leaf-bulking strategy utilized in the DNA preparation of each accession. Indeed, phenotypic inspection of field-grown seed lots revealed low levels of phenotypic diversity in many of the accessions utilized in these experiments, suggesting the presence of genetic heterogeneity within accessions and the need for future characterization of within-line genetic diversity. Loci that produced multiple alleles were scored as having all alleles present.
Phenetic analysis and genetic similarities
Jaccard's similarity coefficients for quinoa accessions ranged from 0.038 to 1, with the least genetic similarity detected between the Bolivian highland accession B15 (PI614002) and the lowland Chilean accession C15 (PI614888), whereas the greatest genetic similarity was observed between the genetically identical lowland accessions WA (NSL92331) and SC (NSL86649). Distinct genetic profiles were identified for all other accessions.
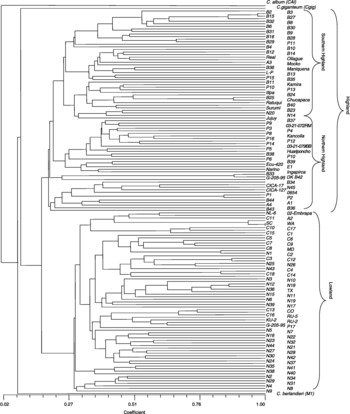
The UPGMA and Jaccard's similiarity coefficients were used to produce a dendrogram of quinoa accessions and the two control Chenopodium control species (Fig. 1). C. album and C. giganteum clustered at the root of the UPGMA dendrogram with the Mexican accession M1 (Fig. 1; see Discussion). This Mexican accession (M1) was extremely distinct from all other quinoa accessions as shown by it low pairwise similarity value (0.073) and was thus removed from subsequent analyses. The remaining 150 quinoa accessions, clustered into two large, but clearly distinct, clusters corresponding to the highland Andean and lowland coastal accessions (Fig. 1). The highland cluster consisted of accessions from Peru, Bolivia, Ecuador and Argentina and are broken down into two subgroups: northern highland and southern highland. All four of the Ecuadorian accessions clustered together with all but four (P11, P15, P6 and P17) of the Peruvian accessions in the northern highland subgroup, whereas all but three Bolivian accessions (B37, B38 and B39) clustered with the majority of the Argentinian accessions in the southern highland subgroup (Fig. 1). One Argentinian accession (A2) clustered with the coastal lowland accessions. The Chilean accessions all clustered in the coastal lowland group with the exception of ‘Ollague’, a highland ecotype originating from northern Chilean Altiplano. Most of the USDA-Ballón collection clustered in the lowland coastal group, with the exception of N20 and N14 which grouped with the accessions in the southern highland subgroup (Table 1; Fig. 1).
Dendrogram showing the 150 accessions of Chenopodium quinoa, one accession of C. berlandieri Moq. ssp. nuttaliae (M1) and the two control species (C. album —Cal; C. giganteum —Cgig), from UPGMA cluster analysis using allelic data from 36 microsatellite markers. C. quinoa accessions are clustered into two main groups: highland (top) and lowland (bottom) ecotypes.

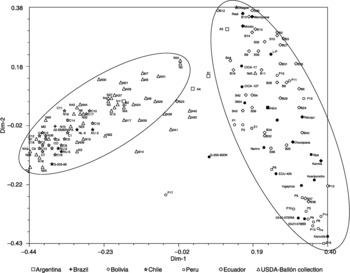
PCA formed two well-separated groups (highland and lowland; Fig. 2). The plot of PCA Dim-1 against Dim-2 accounted for 21.8% (Dim-1 = 15.9%; Dim-2 = 5.9%) of the total variation observed in the 152 quinoa accessions analysed. The lowland cluster forms a single continuum along the Dim-1 axis. Within this continuum, the Chilean lowland and Ballón accessions segregate to the opposite extremes, with the Ballón accessions stretching towards the highland cluster (Fig. 2). No discrete breaks occur between the Chilean and Ballón accessions. The highland variation forms a single continuum, easily seen along the Dim-2 axis, with northern (Ecuadorian and Peruvian) and southern (Bolivian and Argentinian) accessions stretching to opposite extremes of the Dim-2 axis. Some Peruvian (northern highland) and Bolivian (southern highland) accessions intermingle within the centre of the highland cluster, preventing the separation of northern and southern highland accessions into discrete entities.
The two-dimensional scaling resulting from the PCA analysis of 150 Chenopodium quinoa accessions using genetic diversity data from 36 microsatellite markers. Circled areas represent the major highland and lowland clusters identified in the dendrogram. Accessions are coded for their country of origin as described in the legend. Blackened symbols indicate accessions from CIP-FAO and PROINPA collections.

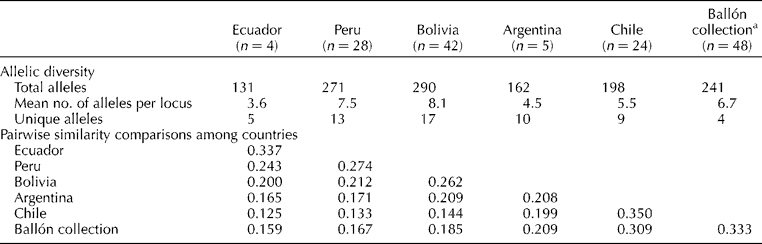
Pairwise comparisons of the similarity coefficient within the highland group (mean = 0.23) are significantly lower (t-test; P ≤ 0.01) than comparisons within the lowland group (mean = 0.34), suggesting that the lowland group contains less genetic diversity. Table 3 presents the average similarity value between accessions based on country of origin (or collector in the case of the Ballón collection). The highest similarities between countries were observed between the Chilean genotypes and the Ballón collection (0.31). In contrast, the greatest dissimilarity between countries was observed between the Chilean and Ecuadorian genotypes, followed closely by the comparison of the Chilean and Peruvian genotypes (0.12 and 0.13, respectively). Interestingly, the genetic similarity comparisons between the Ballón collection and Peruvian and Bolivian genotypes were intermediate (0.19 and 0.17, respectively) as compared to the distances between the Chilean material and the Peruvian and Bolivian genotypes (0.13 and 0.14, respectively).
Total alleles, mean number of alleles per region, unique alleles and pairwise similarity comparisons given for each country represented in the analysis (the single quinoa accession from Brazil (02-Embrapa) is not included in the analysis)
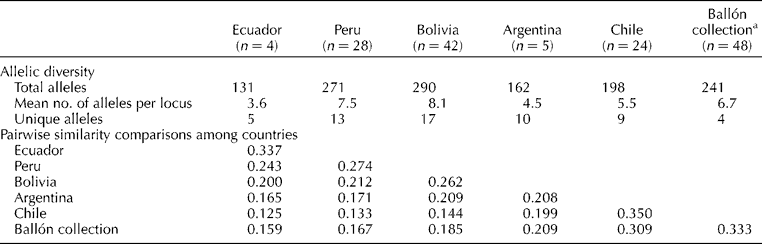
a The Ballón collection lack specific passport information regarding country of origin. According to the phenetic analysis they are more similar to the lowland accessions originating from Chile.
Discussion
Phenetic analyses of quinoa accessions show that the lowland and highland accessions segregate into two discrete clusters consistent with Wilson's (Reference Wilson1988a) hypothesis. Additionally, the highland cluster segregates into northern (northern Peru/Ecuador) and southern (southern Peru/Bolivia/northern Argentina) highland subgroups (Fig. 2). Gandarillas (Reference Gandarillas and Tapia1979) and Wilson (Reference Wilson1988b) suggested that the southern highlands region near Lake Titicaca represents the centre of diversity for quinoa based on the high levels of morphological and isozyme diversity observed in this region. Diversity measures based on the molecular data reported herein support this view since the regions to the north and south of this region show a decrease in genetic variation (Table 3). The reduction in genetic diversity levels in the northern highland and coastal lowland regions could be a result of founder effects associated with the dispersal of the crop from its centre of origin or alternatively as a response to selective adaptation in the more uniform ecological regions of the northern highlands and coastal lowlands. Given quinoa's ancient association with the Incan civilization any interpretation of quinoa's spread through South America needs to consider the broad implications of human intervention (Wilson, Reference Wilson1988a).
Two hypotheses (Gandarillas, Reference Gandarillas and Tapia1979; Tapia, Reference Tapia and Tapia1979; Wilson, Reference Wilson1988a) have been proposed to explain the origin of quinoa domestication: (i) quinoa originated in Colombia and spread southwards along the Andes; and (ii) quinoa originated in the southern highlands of Peru and Bolivia. As Gandarillas (Reference Gandarillas and Tapia1979) noted, the evidence in support of a northern origin are tenuous at best, as it appears to be mostly anecdotal and linguistic in inspiration (Tapia, Reference Tapia and Tapia1979). Gandarillas (Reference Gandarillas and Tapia1979) noted a Peruvian–Bolivian centre of morphological diversity and subsequently proposed the Peruvian and Bolivian southern highlands as the centre of domestication. Our data support the Peruvian–Bolivian centre of diversity; however the lack of accessions from Ecuador and Colombia in the USDA collection precludes the elimination of a northern hypothesis of the origin of domestication of quinoa and further suggests that concentrated collections of quinoa accessions are needed from these countries.
The phenetic analysis showed an interdigitation of Peruvian and Bolivian accessions in both the UPGMA dendrogram and in the PCA analysis, which is likely due to the geographic proximity of some genotypes along the border of Bolivia and Peru on the southern Andean Altiplano. Ecuadorian accessions form a single group within the northern highland subgroup of the cluster analysis, although they are somewhat scattered within the northern subgroup (Fig. 2), suggesting that the Ecuadorian accessions were likely introduced from the Andean highland group followed by subsequent adaptation. Interestingly, the Argentinian accessions are scattered with no discernible pattern within the dendrogram (Fig. 1) or the PCA (Fig. 2), with one accession (A4) even grouping with coastal Chilean lowland accessions. Although our understanding of Argentinian germplasm is limited by the small sample size available to us in the USDA collection, it does appear that the Argentinian accessions included in this study potentially represent reintroductions of quinoa into Argentina from both the southern highland and lowland genotypes. Future systematic and phyletic analysis of quinoa would undoubtedly benefit from the inclusion of a wider array of Argentinian accessions collected from indigenous populations.
Tapia et al. (Reference Tapia, Mujica and Canahua1980) classified highland quinoa into four distinct ecotypes, Valle, Yungas, Altiplano and Salares, based on altitude, height of the plants, amount of branching, length of growing period and salt tolerance. Wilson (Reference Wilson1988a) noted that these classifications were not well supported by isozyme data. Other than the tendency of the Salares types to cluster together along Dim-2, we could detect no correlation between these ecotypes and genetic diversity as revealed in our phenetic analyses. Furthermore, we observed no significant correlation (P ≤ 0.05) of genetic diversity using PCA Dim-1 or Dim-2 with altitude, latitude or longitude (data not shown), although we note these correlations were hindered by a lack of reliable passport data for many of the accessions (Pratt and Clark, Reference Pratt and Clark2001).
Examination of the lowland cluster shows evidence of two subgroups, the first from lowland Chile and the second made up of populations collected by the Bolivian agronomist Emigdio Ballón. The Chilean subgroup is less diverse as compared to the Peruvian and Bolivian populations (Table 3). The lack of genetic diversity in the Chilean populations supports Wilson's (Reference Wilson1988a, Reference Wilsonb) hypothesis of an ancient founder effect followed by long periods of drift in Chilean populations. t-Tests of Jaccard's similarity measures between Chile and Bolivia as well as Chile and Peru showed that the reduction of variation in Chile is statistically significant (P ≤ 0.001) for both comparisons. Wilson (Reference Wilson1988a) additionally hypothesized that Chilean populations originated from the southern Andes. This hypothesis is further supported by pairwise comparisons of the Jaccard's similarity values based on country of origin which indicated that Chilean populations are more similar to the southern highland genotypes from Argentina (0.199) and Bolivia (0.144) than they are to the northern highland genotypes from Peru (0.133) and Ecuador (0.125).
An anomaly in the data is the Mexican accession M1 (PI 476820, ‘Santa Elena 7’) which grouped by itself in the phenetic analysis and was genetically distinct from all other quinoa accessions, with a substantially reduced average genetic similarity value of 0.073 (7.3%) when compared to all other quinoa accessions. The USDA's Germplasm Resources Information Network (GRIN) lists M1 as C. quinoa, but also lists ‘huazontle’ as an additional name for this accession. Huazontle is the common name used to refer to C. berlandieri Moq. ssp. nuttalliae, a cultivated chenopod grown in central Mexico. Nelson (Reference Nelson1968) refers specifically to ‘Santa Elena #7’ as C. nuttalliae Safford, a former classification for C. berlandieri ssp. nuttalliae. Huazontle and quinoa are both members of the series Foveosa (subsect Cellulata, sect Chenopodium), and the two cross readily. Aellen (Reference Aellen1929) treated the two as conspecific. They are separated geographically and distinguished by slight differences in leaf shape and seed pigmentation (Simmonds, Reference Simmonds1965; Nelson, Reference Nelson1968). M1 is from within the range of huazontle, and well outside the area where C. quinoa is commonly found. Hence, the data presented here suggest that M1 is misclassified as C. quinoa and should be reclassified as C. berlandieri Moq. ssp. nuttaliae.
USDA-Ballón collection subset
Many of the accessions available in the USDA collection were collected by Emigdio Ballón. Unfortunately, the GRIN database lacks passport information for the vast majority of these genotypes. The UPGMA dendrogram clustered the majority (>90%) of the Ballón genotypes with the Chilean lowland accessions (Fig. 1). The PCA analysis (Fig. 2) also places them within the Chilean lowland group, however the Ballón collection is oriented between the Chilean populations and the southern highland populations, indicating a potential affinity with southern highland accessions that is further supported by pairwise comparisons of Jaccard's similarity values (Table 3).
Shared allelic patterns between the Ballón, Chilean lowland and highland accessions are particularly interesting. Highland, Chilean and the Ballón accessions share a common predominant allele at 31% of the loci. However, at 44% of the loci, the Ballón and Chilean accessions shared a predominant allele while the highland accessions exhibited a different predominant allele. In contrast, the Ballón and highland accessions shared a predominant allele at only 7% of the marker loci. At the remaining loci (18%) the Ballón accessions have a predominant allele that differs from the predominant allele identified in the highland and Chilean lowland groups. The Ballón collections also show higher diversity measures and they harbour a number of alleles not found in the lowland accessions but present in highland accessions. Thus the Ballón collection appears to be coastal Chilean in terms of predominant alleles, but further enriched by highland alleles.
One intriguing hypothesis that may explain the intermediate position of the Ballón collection is that it may represent a distinct geographic ecotype. One potential geographic area to which this collection could belong is the Yungas region (Tapia et al., Reference Tapia, Mujica and Canahua1980), which stretches along the eastern slopes of the Bolivian Andes. Evidence in support of this hypothesis includes: (i) the intermediate position of the Ballón populations along Dim-1 of the PCA; (ii) diversity values that are intermediate between Chilean and highland values; (iii) intermediacy of the similarity values for the Ballón accessions as compared to the other geographical regions; and (iv) patterns of predominant alleles. We note that Wilson (Reference Wilson1988a) included a single representative of the Yungas ecotype in his isozyme analysis which he reported was distinctive. However, this ecotype is not present in the USDA collection and was, therefore, unavailable for inclusion in this study. If the Ballón collection represents a distinct geographical ecotype, the lack of similarly clustering accessions from the CIP-FAO international nursery collection suggests that it is potentially underrepresented in even the international quinoa germplasm collections. Tracing the origins of the Ballón collection should be a primary objective for the curation efforts of the USDA quinoa germplasm.
Conclusions
The results of this study hold several implications for quinoa conservation and improvement programmes. Multiple alleles were observed at marker loci for several of the accessions utilized in the study, suggesting that quinoa accessions (both those held by the USDA and those in the CIP-FAO collection) represent potentially heterogeneous lines of mixed genotypes that should be carefully screened and potentially purified prior to breeding. The lack of passport and morphological data associated with many of the publicly available quinoa accessions in the USDA germplasm system may potentially hinder their utility in traditional breeding programmes. We note, however, that extensive collections that are well documented are available in the Peruvian, Bolivian and Chilean germplasm collections. Application of these microsatellite markers to these South American germplasm collections will further elucidate the full range of genetic diversity within C. quinoa. Additionally, this study highlights the need for increased collection from two specific geographical areas: the northern Andes (especially Ecuador and Colombia) and the Yungas (eastern slopes of the Bolivian and Peruvian Andes).
Acknowledgements
This research was supported by grants from the McKnight Foundation, Holmes Family Foundation, and the Erza Taft Benson Agriculture and Food Institute. We gratefully acknowledge D. Brenner at USDA-NPGS, Iowa State University, for taxonomic suggestions and seed contribution. We thank R. Holmes and M. Dilg for technical assistance with the microsatellite assays.