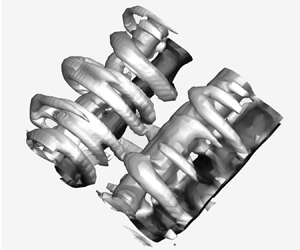



1. Introduction
Hydrodynamics of oscillating foils is an area of research that has contributed greatly to our understanding of swimming mechanisms in fish and marine mammals in recent years (Smits Reference Smits2019). In particular, a combination of numerical and experimental studies of flow past oscillating foils has provided a deeper insight into the characteristics of coherent structures in unsteady wakes and their subsequent effects on flow turbulence, e.g. Koochesfahani (Reference Koochesfahani1989), Triantafyllou, Techet & Hover (Reference Triantafyllou, Techet and Hover2004) and Deng & Caulfield (Reference Deng and Caulfield2015). Fazle Hussain (Reference Fazle Hussain1986) described coherent structures as any connected turbulent fluid mass over which a certain component of the three-dimensional vorticity is instantaneously coherent over the spatial extent of the fluid mass. The term vortex has been since used extensively for flow structures that carry essential aspects of the coherent vorticity (Fazle Hussain Reference Fazle Hussain1986). The formation, interaction and merging of vortices is also crucial in studying turbulent wakes. These dynamic behaviours directly influence the flow properties, such as entrainment, heat transfer, hydrodynamic forces (i.e. lift and drag) and fundamental aspects of turbulence modelling. In recent years, the study of bio-inspired propulsors (Gemmell et al. Reference Gemmell, Colin, Costello and Dabiri2015; King, Kumar & Green Reference King, Kumar and Green2018; Hemmati, Van Buren & Smits Reference Hemmati, Van Buren and Smits2019), including wake dynamics analysis, have allowed exploration of the mechanisms that govern underwater swimming characteristics in biological species and man-made systems. Here, we focus on the fundamentals of wake dynamics and secondary vortex structures in underwater swimming that combine heaving and pitching oscillations.
Dickinson et al. (Reference Dickinson, Farley, Full, Koehl, Kram and Lehman2000) described that vorticity, in the form of discrete or linked vortex rings, influences the spatial and temporal force generation in different species of fish. Lentink et al. (Reference Lentink, Muijres, Donker-Duyvis and Van Leeuwen2008) further assessed the influence of motion kinematics on the vortical structures forming in the near wake of the body, which may affect the propulsive performance. This analysis was based on the variation of dimensionless wavelength parameter defined as  $\lambda ^* = U_{\infty }/fl$, where
 $U_{\infty }$ is the free-stream velocity,
 $f$ is the flapping frequency and
 $l$ is the foil characteristic length. This study depicted how vortex merging and tearing mechanisms were stronger at low
 $\lambda ^*$, which led to abrupt changes in the wake topology. Different spatial configurations and interaction of vortices also play a dominant role in influencing specific performance regimes in underwater swimming. For instance, the experiments of Anderson et al. (Reference Anderson, Streitlien, Barrett and Triantafyllou1998) showed that a highly efficient thrust generation by an oscillating foil was associated with a strong leading-edge vortex that positively interacts with a trailing-edge vortex within half of the oscillation cycle. Later on, Birch & Dickinson (Reference Birch and Dickinson2003) studied the force variation and wake dynamics in flapping flight. They described the influence of shed vortices from previous flapping strokes on the dynamic behaviour of forces that are generated by the robotic wing. The inherent complexity and unsteadiness of the vortex formation process had provided a greater motivation for fluid dynamicists to formulate three-dimensional wake models relevant to biological flows. These models not only characterized the vortex structures, but they also discussed the trigger mechanisms, or instabilities, that may be responsible for their individual characteristic features. For instance, investigation of the wake characteristics behind bluff bodies indicated specific instabilities that lead to the generation of streamwise vortex structures. Williamson (Reference Williamson1996) identified two instability mechanisms that derive the formation of secondary vortex structures in the wake of a circular cylinder. The two mechanisms were dominant at different ranges of Reynolds number (
 $Re$), and they also possessed different spatio-temporal characteristics. This was later extended to different geometries, such as square cylinders (Robichaux, Balachandar & Vanka Reference Robichaux, Balachandar and Vanka1999), blunt trailing-edge cylinders (Ryan, Thompson & Hourigan Reference Ryan, Thompson and Hourigan2005; Gibeau, Koch & Ghaemi Reference Gibeau, Koch and Ghaemi2018) and symmetric hydrofoils (Deng & Caulfield Reference Deng and Caulfield2015). These studies provided a deeper insight into the structural arrangement of vortices. However, the vortex dynamics and secondary vortex features imposed by the combined oscillatory motion of hydrofoils is not yet fully characterized. This knowledge facilitates the development of single- and multi-body swimming control systems.
The differences observed in vortex arrangements has motivated further assessment of the importance of kinematics in underwater swimming. A combination of numerical (Guglielmini & Blondeaux Reference Guglielmini and Blondeaux2004; Senturk & Smits Reference Senturk and Smits2018; Hemmati & Smits Reference Hemmati and Smits2019) and experimental (Triantafyllou, Triantafyllou & Grosenbaugh Reference Triantafyllou, Triantafyllou and Grosenbaugh1993; Anderson et al. Reference Anderson, Streitlien, Barrett and Triantafyllou1998; Godoy-Diana, Aider & Wesfreid Reference Godoy-Diana, Aider and Wesfreid2008; Floryan et al. Reference Floryan, Van Buren, Rowley and Smits2017) studies highlighted the importance of characteristic parameters associated with periodic or non-periodic motion in analysed the wake topology and propulsive performance. Parker, von Ellenrieder & Soria (Reference Parker, von Ellenrieder and Soria2003) and von Ellenrieder, Parker & Soria (Reference von Ellenrieder, Parker and Soria2003) discussed the effects on the wake structures behind a flapping three-dimensional wing due to variations in superimposed motion parameters, such as pitch amplitude, Strouhal number and phase difference. These studies provided a detailed model for the vortex formation and interactions in the wake of finite span wings. The rapid shedding of trailing- and leading-edge vortices at high Strouhal numbers led to a spatially compact chain of mushroom-shaped structures. This was in contrast to the elongated chains observed at low Strouhal numbers and high pitching amplitudes (Parker et al. Reference Parker, von Ellenrieder and Soria2003). Later, Guglielmini & Blondeaux (Reference Guglielmini and Blondeaux2004) evaluated the propulsive performance of hydrofoils with combined pitching and heaving motion. Specifically, the variation in phase difference ( $\psi ^{\circ }$) and trailing-edge amplitude (
 $A$) enabled the identification of a maximum propulsive efficiency (
 $\eta$) at
 $\psi =80^{\circ }$, similar to the results obtained by Anderson et al. (Reference Anderson, Streitlien, Barrett and Triantafyllou1998). Guglielmini & Blondeaux (Reference Guglielmini and Blondeaux2004) attributed such performance characteristics to the formation and shedding process of leading-edge vortex structures. The experiments of Srigrarom & Vincent (Reference Srigrarom and Vincent2008) further deepened our understanding of the effect of free-stream velocity, angular velocity of the foil, peak-to-peak amplitudes and Strouhal number on propulsive performance and the wake of flapping foils. A decrease in peak efficiency was observed with increasing amplitude and angular velocity of the foil (Srigrarom & Vincent Reference Srigrarom and Vincent2008). Moreover, wake analysis indicated the existence of different modes at various reduced frequencies, Reynolds numbers and amplitudes. In another experimental study, Godoy-Diana et al. (Reference Godoy-Diana, Marais, Aider and Wesfreid2009) investigated the transition of Benard von Kàrmàn (BvK) wake to a reverse BvK wake for pitching foils at different peak-to-peak amplitudes (
 $A_D$) and diameter-based Strouhal numbers (
 $St_D$), at a Reynolds number of 1173. At higher
 $A_D$ and
 $St_D$ values, the symmetric reverse BvK wake subsequently transitioned to an asymmetric wake. Their analysis also revealed lines of constant
 $St(=St_{D}A_{D})$ on the phase space diagrams, which suggested that the drag to thrust transition actually occurs after the wake transforms into a reverse BvK type (Godoy-Diana et al. Reference Godoy-Diana, Marais, Aider and Wesfreid2009). These observations provide motivation for further comparative evaluation of vortex dynamics and propulsive performance in underwater swimming.
Wake analysis using particle image velocimetry (Hultmark, Leftwich & Smits Reference Hultmark, Leftwich and Smits2007; Quinn, Lauder & Smits Reference Quinn, Lauder and Smits2015), soap film and dye flow visualization (Parker et al. Reference Parker, von Ellenrieder and Soria2003; Schnipper, Andersen & Bohr Reference Schnipper, Andersen and Bohr2009) and low speed water channel experiments (Koochesfahani Reference Koochesfahani1989) have indicated that there exist specific wake ‘modes’ that remain persistent for a given combination of motion and flow parameters, i.e. Strouhal number, reduced frequency and Reynolds number. Koochesfahani (Reference Koochesfahani1989) used laser Doppler velocimetry in a water channel to study the effect of reduced frequency on vortex structures in the wake, and the performance of pitching foils. The results indicated that the wake was only composed of an ‘undulating’ vortex sheet, instead of a periodic Kàrmàn-type vortex shedding, when the reduced frequency is below a given threshold. However, two distinct wake configurations were observed with increasing reduced frequency, while the pitching amplitude remained unchanged. The first configuration involved a double wake pattern with opposite vorticity signs that were shed within each half-cycle. Williamson & Roshko (Reference Williamson and Roshko1988) had observed such a configuration for the wake of an oscillating cylinder in the past, which they referred to as a 2P wake. The second configuration comprised a reverse Kàrmàn vortex street that subsequently generated thrust in the wake (Koochesfahani Reference Koochesfahani1989). Wakes observed by Schnipper et al. (Reference Schnipper, Andersen and Bohr2009) had different configurations at a range of Strouhal numbers and amplitudes, mainly 2P, 2S, 2P–2S, 4P and 8P. However, the wake mechanism incorporating evolution and advection of vortices was only studied for a drag producing configuration of the 2P mode. A phase space diagram was further developed to identify the parameter space within which those wakes were observed. Specific regions corresponding to the 2P wake were observed in Strouhal range of 0.15–0.20, which also corresponded to thrust generation in swimming (Müller, Van Den Boogaart & Van Leeuwen Reference Müller, Van Den Boogaart and Van Leeuwen2008; Schnipper et al. Reference Schnipper, Andersen and Bohr2009). The observations of Hultmark et al. (Reference Hultmark, Leftwich and Smits2007) also revealed 2P vortex modes for a robotic lamprey model under steady swimming conditions, wherein two vortices were shed per half-cycle. Phase-averaged vorticity fields showed that vortex pairs of 2P mode had a major mutual advection velocity pointing away from the wake centreline, although a minor component of velocity existed along the streamwise direction. This generated a net positive thrust close to the tail (Hultmark et al. Reference Hultmark, Leftwich and Smits2007). Cleaver et al. (Reference Cleaver, Wang, Gursul and Visbal2011) discussed the existence of three distinct wake modes due to the shed vortices behind a plunging airfoil. Mode 1 field was observed at  $f^* = 2$, which depicted a vortex formation mechanism similar to that observed for typical 2P wakes. However, vortical interactions and merger that occurred very near the trailing edge led to the formation of a dipole within one half-oscillation cycle, which further advected above the wake centreline. The mean velocity field also depicted a region of very low velocity excess behind the foil. Dewey, Carriou & Smits (Reference Dewey, Carriou and Smits2012) later explored the efficient propulsive nature of 2P wakes, which were found to occur for three-dimensional flexible fins within certain wavelengths of spanwise curvature, mimicking bio-locomotion of a batoid. Interestingly, the increase in trailing-edge phase delay at lower wavelengths of actuation caused the 2P mode to switch to the 2S mode (Dewey et al. Reference Dewey, Carriou and Smits2012; Smits Reference Smits2019). The wake configuration was also found to be sensitive to the Strouhal number of the oscillations. For example, increasing the Strouhal number beyond 0.2 led to the dominance of the 2S mode in the wake instead of the 2P wake observed at
 $St=0.15$ (Dewey et al. Reference Dewey, Carriou and Smits2012).
Asymmetric wake modes were identified in the studies of Jones, Dohring & Platzer (Reference Jones, Dohring and Platzer1996, Reference Jones, Dohring and Platzer1998); Lai & Platzer (Reference Lai and Platzer1999), Cleaver, Wang & Gursul (Reference Cleaver, Wang and Gursul2012) and Calderon et al. (Reference Calderon, Cleaver, Gursul and Wang2014). Jones et al. (Reference Jones, Dohring and Platzer1998) confirmed via experiments and numerical simulations that non-symmetric wakes primarily existed for high amplitude and high frequency ( $St>1$) plunging motion. Lai & Platzer (Reference Lai and Platzer1999) also predicted that, as the non-dimensional plunge velocity (
 $U_{pl}$) exceeded 1, the dual mode wake appeared, wherein the vortex couples followed either an upward or downward deflected vortex path. Cleaver et al. (Reference Cleaver, Wang and Gursul2012) and Calderon et al. (Reference Calderon, Cleaver, Gursul and Wang2014) confirmed that there exists a correspondence between asymmetric wakes formed by a heaving foil and its initial oscillatory direction at the very first cycle, the transverse amplitude and reduced frequency. The findings of Godoy-Diana et al. (Reference Godoy-Diana, Marais, Aider and Wesfreid2009) further identified a definite transition from a reverse von Kàrmàn wake to an asymmetric wake with positive thrust generation. Wang (Reference Wang2000) and later Godoy-Diana et al. (Reference Godoy-Diana, Aider and Wesfreid2008) had previously indicated that aquatic animals utilize such asymmetric wakes for propulsive manoeuvring purposes during swimming or flying. Despite these studies, there still exists a need to further characterize transitional features in the mid-wake region (Schnipper et al. Reference Schnipper, Andersen and Bohr2009) of thrust generating 2P wake modes, which are relevant to foils undergoing combined pitching and heaving oscillations. Recently, Van Buren, Floryan & Smits (Reference Van Buren, Floryan and Smits2019) observed peak efficiency along with low thrust generation at low reduced frequencies in an experimental scaling analysis for foils oscillating with combined heaving and pitching motions. In contrast at higher frequencies, larger thrust values were obtained with a trade off in terms of larger power requirements that lowered efficiency. We hypothesize that their peak efficiency characteristics are due to the propulsive 2P wake modes that have been observed in previous studies by Müller et al. (Reference Müller, Van Den Boogaart and Van Leeuwen2008), Hultmark et al. (Reference Hultmark, Leftwich and Smits2007) and Dewey et al. (Reference Dewey, Carriou and Smits2012). The asymmetric wakes found to be prominent for the latter (larger thrust and lower efficiency) regime by Van Buren et al. (Reference Van Buren, Floryan and Smits2019) may also represent new characteristics with respect to vorticity production in the near wake region.
The studies discussed thus far focused mostly on characterizing the vortex modes on the basis of spatial distribution and the location of primary structures that represent the surfaces of constant spanwise vorticity, or what is referred to as ‘rollers’ (Najjar & Balachandar Reference Najjar and Balachandar1998; Hemmati, Wood & Martinuzzi Reference Hemmati, Wood and Martinuzzi2016). However, a qualitative assessment of the three-dimensional wake of cylinders (Robichaux et al. Reference Robichaux, Balachandar and Vanka1999; Williamson Reference Williamson1996; Ryan et al. Reference Ryan, Thompson and Hourigan2005; Gibeau et al. Reference Gibeau, Koch and Ghaemi2018) identified the presence of secondary structures, which are characterized by a constant streamwise vorticity. The ‘rib’-like structures were induced by flow instabilities that influence the spatio-temporal arrangements of streamwise vortices formed in the wake (Williamson Reference Williamson1996). For the wakes of circular cylinders, the mode A instability was characterized as an instability of rollers, promoting a spanwise wavelength ( $\lambda _z$) of around four cylinder diameters between each streamwise vortex pair (Zhang et al. Reference Zhang, Fey, Noack, König and Eckelmann1995; Williamson Reference Williamson1996). However, mode B characteristics were attributed to a shear layer instability, which promoted a spanwise wavelength of one cylinder diameter between each streamwise vortex pair formed in the near wake (Williamson Reference Williamson1996). In terms of periodicity, mode A was characterized with an out-of-phase arrangement, for example the secondary vortices switched signs after every shedding cycle. However, mode B instability retained the streamwise vorticity sign in each subsequent shedding cycle (Williamson Reference Williamson1996). Previously, Zhang et al. (Reference Zhang, Fey, Noack, König and Eckelmann1995) had observed an instability (later named mode C) that dominated the wake at Reynolds numbers of 170 to 270 using an in-house finite difference numerical solver. The characteristic spanwise wavelength of mode C was approximately two cylinder diameters (Zhang et al. Reference Zhang, Fey, Noack, König and Eckelmann1995). Further assessment of the spatial distribution of mode C showed that the secondary vortices aligned in parallel pairing in the near and far wake, which is similar to mode A, but in contrast to mode B. The latter mostly concentrated in the near wake region (Zhang et al. Reference Zhang, Fey, Noack, König and Eckelmann1995).
The rib structure was also observed in the wake of square cylinders (Robichaux et al. Reference Robichaux, Balachandar and Vanka1999), blunt trailing-edge cylinders (Ryan et al. Reference Ryan, Thompson and Hourigan2005; Gibeau et al. Reference Gibeau, Koch and Ghaemi2018), symmetric pitching (Deng & Caulfield Reference Deng and Caulfield2015) and heaving foils (Sun, Deng & Shao Reference Sun, Deng and Shao2018). Robichaux et al. (Reference Robichaux, Balachandar and Vanka1999) conducted Floquet stability analysis for flow over a square cylinder, which determined that there exist novel instability features in the wake that supplement those found previously for circular cylinders (Zhang et al. Reference Zhang, Fey, Noack, König and Eckelmann1995; Williamson Reference Williamson1996). Amongst these was the mode S instability, which featured a spanwise wavelength of approximately 2.8 cylinder diameters and a periodicity twice that of the primary shedding period for Kàrmàn rollers (Robichaux et al. Reference Robichaux, Balachandar and Vanka1999). A detailed description of the spatio-temporal rib configuration was provided by space–time reconstructed models for all the dominant modes identified in the study (Robichaux et al. Reference Robichaux, Balachandar and Vanka1999). A similar Floquet study was also performed by Ryan et al. (Reference Ryan, Thompson and Hourigan2005) on a blunt trailing-edge cylinder. The configuration of ribs observed in this study was referred to as mode B $^\prime$ with characteristics that partly differed from the mode B previously identified for circular cylinders (Zhang et al. Reference Zhang, Fey, Noack, König and Eckelmann1995; Williamson Reference Williamson1996). Specifically, the spanwise wavelength of the ribs was similar to that identified in the wake of circular cylinder, but a sign swap in streamwise vorticity occurred every half-shedding cycle, which was not observed for circular cylinders (Ryan et al. Reference Ryan, Thompson and Hourigan2005). Investigation of the wake for a pitching foil by Deng & Caulfield (Reference Deng and Caulfield2015) also confirmed deflected rib configurations. They determined that wake deflection was necessary in order to have inherent three-dimensionality, and subsequent formation of secondary vortex pairs. Their observations also indicated that there exist short and long spanwise wavelength modes in the wake. The shorter mode possesses characteristics similar to that of mode A for circular cylinders (Deng & Caulfield Reference Deng and Caulfield2015), while their long mode had a spanwise wavelength for rib alignment equal to that of mode B for cylinders (Williamson & Roshko Reference Williamson and Roshko1988; Brede, Eckelmann & Rockwell Reference Brede, Eckelmann and Rockwell1996). Sun et al. (Reference Sun, Deng and Shao2018) recently predicted sequential emergence of ‘mode A’, ‘mode QP’ and ‘mode B’ in the wake of a perfectly heaving foil, which depicted apparent similarities to the long and short wavelength modes for a pitching foil (Deng & Caulfield Reference Deng and Caulfield2015; Deng, Sun & Shao Reference Deng, Sun and Shao2015). Even for high aspect ratio wings in heaving motion, Chiereghin et al. (Reference Chiereghin, Bull, Cleaver and Gursul2020) observed presence of a dominant spanwise instability on leading-edge vortex structures that depicted a wavelength close to 1. The origin of the instability was speculated to be either oscillatory wake flow, of oscillatory origin or an instability of the vortex filament itself. A similar comprehensive analysis of the wake secondary vortex characteristics for oscillating foils undergoing combined heaving and pitching motion is lacking in the literature, to the best knowledge of the authors. Such an analysis for specific regimes showing extreme and distinct propulsive performances identified by Van Buren et al. (Reference Van Buren, Floryan and Smits2019) may reveal new physics on wake three-dimensionality.
In this study, we use numerical simulations to model the characteristics of vortex structures in the wake of a flapping foil with combined pitching and heaving motion. The propulsive performance results of Van Buren et al. (Reference Van Buren, Floryan and Smits2019) are used to identify the oscillatory and fluid motion that constitute extreme performance characteristics. The simultaneous plausibility of either high efficiency or large thrust generation in a combined heaving and pitching motion may hint to fundamental differences in the wake. We further hypothesize that different characteristics of secondary structures and their interactions with the rollers may be responsible for such variations in performance. Thus, we evaluate the wake three-dimensionality and characterize the secondary structures at two very different and extreme oscillatory conditions. The paper structure is such that the methodology is detailed in § 2, which provides a description of governing equations, motion and flow parameters for the simulations. The validation study of the numerical solver is also included in § 2. This is followed by discussion of the results and characterization of the wake in § 3. Main conclusions are summarized in § 4.
2. Methodology
The three-dimensional wake characteristics behind an oscillating symmetric teardrop hydrofoil is studied numerically at  $Re=8000$. At this Reynolds number, the effects of transitional instability mechanisms are negligible, which provides stable and consistent wake characteristics for analysing secondary vortices (Gibeau et al. Reference Gibeau, Koch and Ghaemi2018). The hydrofoil has infinite span across the domain following the experiments of Van Buren et al. (Reference Van Buren, Floryan and Smits2019), which constitutes an aspect ratio (
 $AR$) of infinity. The infinitely span hydrofoil allows us to preserve the characteristics of secondary vortex structures (ribs) formed in the wake. The hydrofoil considered here has a chord length of
 $c$ and a maximum thickness of
 $D$, such that the thickness to chord ratio (
 $D/c$) is 0.1. The schematic of the foil geometry is shown in figure 1. The foil undergoes a combined sinusoidal pitching and heaving motion defined by
 \begin{gather} h(t)=h_{o} \sin 2 {\rm \pi}f t, \end{gather}
 \begin{gather} \theta(t)=\theta_{o} \sin (2 {\rm \pi}f t+\phi), \end{gather}
where  $h_{o}$ is the heaving amplitude,
 $\theta _{o}$ is the pitching amplitude,
 $f$ is the oscillation frequency and
 $\phi$ is the phase difference between the two motions. The oscillation frequency (
 $\,f$) was expressed in terms of the reduced frequency (
 $\,f^*=fc/U_{\infty }$) and Strouhal number (
 $St=2fA/U_{\infty }$, where
 $A$ is the maximum trailing-edge amplitude for half-oscillation cycle). The parameter space (table 1) used in this study closely follows the experiments of Van Buren et al. (Reference Van Buren, Floryan and Smits2019) to validate the numerical results, provide insight into the wake dynamics associated with the performance observations and enable practical interpretation of the results in terms of underwater swimming characteristics of fish tail fins. The ranges of Strouhal number and reduced frequency considered for evaluating the propulsive performance of the foils were
 $0.21{-}0.97$ and
 $0.6{-}1.87$, respectively. The wake analysis, however, focused only on the extreme performance conditions. According to Van Buren et al. (Reference Van Buren, Floryan and Smits2019), which is consistent with our results, the high efficiency locomotion occurs at
 $St=0.21$,
 $f^*=0.6$ and
 $\phi =270^\circ$, while the largest thrust is generated at
 $St=0.94$,
 $f^*=0.8$ and
 $\phi =330^\circ$. These are very different swimming conditions, which hint that there may be a fundamentally different wake dynamics coinciding with these conditions that deserves closer attention.
Description of teardrop foil geometry and motion employed in the current study.

Parameter space for the current studies and the companion experiments.

2.1. Numerical method
The three-dimensional incompressible continuity (2.4) and Navier–Stokes (2.3) equations were solved directly using OpenFOAM,
 \begin{gather} \frac{\partial u_{i}}{\partial x_{i}}=0, \end{gather}
 \begin{gather} \frac{\partial u_{i}}{\partial t}+\frac{\partial\left(u_{i} u_{j}\right)}{\partial x_{j}}={-}\frac{1}{\rho}\left(\frac{\partial p}{\partial x_{i}}\right)+v \frac{\partial}{\partial x_{j}}\left(\frac{\partial u_{i}}{\partial x_{j}}\right), \end{gather}
while incorporating the overset grid assembly method. Here,  $u_i$ is the velocity component,
 $p$ is pressure,
 $\rho$ is density and
 $\upsilon$ is the kinematic viscosity. All flow parameters are normalized using the free-stream velocity (
 $U_{\infty }$) and chord length of the foil (
 $c$). OpenFOAM is an open-source finite volume solver that is widely used in the literature for numerical simulation of wakes in underwater swimming (Senturk & Smits Reference Senturk and Smits2018; Hemmati & Smits Reference Hemmati and Smits2019; Hemmati et al. Reference Hemmati, Van Buren and Smits2019; Verma & Hemmati Reference Verma and Hemmati2020; Bose, Gupta & Sarkar Reference Bose, Gupta and Sarkar2021). The implicit backward Euler and central differences methods were used for temporal and spatial discretization of the governing equations. These methods are second-order accurate (Senturk & Smits Reference Senturk and Smits2018). The pressure and velocity fields were coupled using the PIMPLE algorithm, which is a hybrid of PISO (pressure-implicit with splitting of operators) and SIMPLE (semi-implicit method for pressure linked equations).
The computational domain is shown in figure 2, where the centre of the coordinate system is at the leading edge of the foil. The  $x$-direction was aligned with the streamwise direction,
 $y$-direction with the cross-flow and
 $z$-direction with the spanwise direction of the flow. The domain extended by
 $20c$ in the streamwise direction with the inlet placed
 $5c$ from the foil leading edge. The cross-flow width of the domain is
 $16c$ with the foil located in the middle. The domain design was consistent with previous studies on wake characterization of a flapping foil, mainly Dong, Mittal & Najjar (Reference Dong, Mittal and Najjar2006), Deng & Caulfield (Reference Deng and Caulfield2015) and Zheng & Wei (Reference Zheng and Wei2012). The domain width in the spanwise direction was
 $2{\rm \pi} c$, which is sufficient to accurately capture at least four pairs of streamwise vortex ribs formed along the span of the foil (Barkley & Henderson Reference Barkley and Henderson1996; Robichaux et al. Reference Robichaux, Balachandar and Vanka1999; Hemmati et al. Reference Hemmati, Wood and Martinuzzi2016).
Schematics of the computational domain (not to scale).

The inlet boundary was assigned the uniform streamwise velocity condition:  $u=U_{\infty }$ and
 $v=w=p=0$. The Neumann outflow boundary condition was imposed on the outlet, which is proven reliable for wake simulations to prevent backward flow or reflection into the domain (Dong et al. Reference Dong, Mittal and Najjar2006). A slip wall condition was imposed on the top and bottom boundaries, which closely resembles experimental conditions (Hemmati et al. Reference Hemmati, Van Buren and Smits2019; Van Buren et al. Reference Van Buren, Floryan and Smits2019). For the side boundaries, a periodic condition was applied, similar to the study of Deng & Caulfield (Reference Deng and Caulfield2015). The no-slip wall condition for the velocity and a Neumann condition for pressure were imposed on the foil boundary. Flow was initialized with a uniform streamwise velocity equal to that at the inlet.
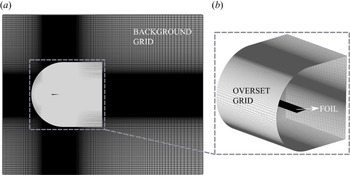
A non-homogeneous structured grid (figure 3) was constructed with a total of  $2.2\times 10^7$ hexahedral elements. Refined grid was used close to the foil, and it extended
 $5c$ downstream of the trailing edge. This ensured that numerical diffusion effects were minimum and the wake three-dimensionality was accurately captured. The grid transitioned to a coarser mesh at the boundaries, while the maximum expansion ratio remained below 1.01. The overset grid representing the foil was in the form of C-type grid, which is shown in figure 3. The aspect ratio for the hexahedral elements on the overset grid was kept relatively the same as that of the underlying elements on the background grid. This minimizes the interpolation errors and detection of orphan cells (Roget & Sitaraman Reference Roget and Sitaraman2014). The timestep was selected such that the maximum Courant number was maintained below 0.8. The convergence criterion was set as
 $10^{-6}$ for the residual of the velocity and pressure components of the momentum equation. The simulations were run on the Cedar cluster operated by Compute Canada. The configuration for each node composed of 48 CPUs and a total of 190 GB of memory for a total of 2880 simulations hours per case.
Depiction of three-dimensional background and overset grid.

2.2. Overset grid assembly
Overset grid assembly (OGA) was used in OpenFOAM to directly solve the unsteady motion of the foil. This approach involves merging two spatial grids, which are referred to as the background grid and overset grid. The latter contains the teardrop foil, whereas the former grid represents a homogeneous fluid domain. The oscillatory motion dynamics of the foil is modelled by moving the overset grid using prescribed oscillation formulations outlined before. The background grid remains stationary throughout the simulation. This eliminates the need for regular deformation of the spatial grid per timestep. The velocity and pressure fields are calculated by solving the governing equations based on the interpolation of the solution transferred between the background and overset cells, which are located at the overlapping regions of the merged grid. The resulting flow fields on the background grid are then utilized for simulation analysis.
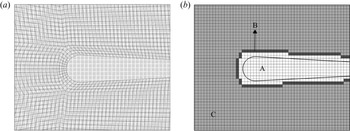
The OGA incorporates three major categories of grid cells: holes, interpolated and calculated. These are updated for every timestep in an unsteady simulation. The foil geometrical profile is represented by the hole cells, where no field quantities are solved or interpolated. The interpolated cell pairs, also known as donor-acceptor cells according to Petra (Reference Petra2019), are then utilized for interpolation and transfer of the solution between the two grids. Figure 4(a) depicts a coarse representation of the merged background and overset grids, coloured in white and black respectively. Figure 4(b) shows the hole and calculated cells on the background grid, along with the interpolated cell fringe located on and around the foil. The ‘inverse distance’ technique was implemented for the interpolation of velocity and pressure data, which had previously been validated for highly refined grids (Chandar Reference Chandar2019; Verma & Hemmati Reference Verma and Hemmati2020). The interpolation function for the inverse distance scheme is
 \begin{equation} \varsigma_{D}=\sum_{i}^{n} w_{i} \varsigma_{i}, \end{equation}
where  $\varsigma _{D}$ is the interpolated value obtained from
 $n$ neighbouring donor cells with value of
 $\varsigma _{i}$, and
 $w_{i}$ is the weighting function (Chandar Reference Chandar2019);
 $w_{i}$ is obtained by using the distance between a given cell, for which interpolation is performed (acceptor), and its neighbouring donor cells (
 $d_i$). The formulation is given by
 \begin{equation} w_{i}=\frac{\dfrac{1}{\left|d_{i}\right|}}{\displaystyle\sum_{i}^{n} \frac{1}{\left|d_{i}\right|}}. \end{equation}
In OpenFOAM, the OGA method is integrated to the PIMPLE solver, which has been used in various numerical studies concerning high Reynolds number unsteady turbulent flows (Kim & Xie Reference Kim and Xie2016; Hemmati et al. Reference Hemmati, Van Buren and Smits2019). In particular, Kim & Xie (Reference Kim and Xie2016) has shown that implementing the PIMPLE formulation accurately solves the turbulent features of the flow using coarser timesteps in unsteady simulations. The multiple corrector loop is executed using the PISO method per outer iteration, while the momentum equations are solved repeatedly with outer iterations using the SIMPLE algorithm. Three corrector loops were applied for the current simulations, which were determined to be the optimum number within the solver tolerance of  $10^{-8}$ for both velocity and pressure. The pressure Poisson formulation is further written for OGA method as
 \begin{equation} \nabla^2 p=\nabla \cdot \varPhi + \varphi, \end{equation}
where  $\varphi$ denotes the source term accounting for the field information of cells present on overlapping regions of the grid. Further details regarding this formulation can be found in Chandar (Reference Chandar2019) and Petra (Reference Petra2019). A detailed validation study of the solver was also recently completed in Verma & Hemmati (Reference Verma and Hemmati2020).
OGA meshing and cell identification for an oscillating foil. (a) Typical overlap of an structured overset grid (black lines), and background grid (white lines) for the current computational study. (b) Representation of hole cells in white (A), interpolation cell fringe in black (B) and calculated cells in dark grey (C), identified on the background grid.

2.3. Verification and validation studies
The computational set-up, including domain size, grid quality and boundary conditions can impact the accuracy of numerical results. We have completed a thorough investigation of all relevant parameters that affect numerical solutions, and we have established that the final set-up minimizes all adverse effects. The boundary conditions were set following various previous studies, including Hemmati, Wood & Martinuzzi (Reference Hemmati, Wood and Martinuzzi2018), Senturk & Smits (Reference Senturk and Smits2018) and Hemmati et al. (Reference Hemmati, Van Buren and Smits2019), who have carried out extensive studies on the effect of boundary conditions. Mainly, the outlet boundary is located sufficiently far ( $15c$) from the foil, so that there are no adverse effects on the flow in the critical region behind the foil. The sensitivity analysis with respect to the domain size was carried out following previous work of Hemmati et al. (Reference Hemmati, Wood and Martinuzzi2018), Gungor & Hemmati (Reference Gungor and Hemmati2020) and Verma & Hemmati (Reference Verma and Hemmati2020), which determined that the domain used in SIM0, SIM1 and SIM2 are sufficiently large.
The propulsive performance of the foils was used as the parameter for determining the adverse effects of the computational set-up on numerical solutions. Mainly, the variations in time-averaged coefficients of thrust ( $C_T$), power (
 $C_P$) and lift (
 $C_L$) were considered, which are defined as
 \begin{equation}
C_{L}=\frac{F_{y}}{\tfrac{1}{2} \rho U_{\infty}^{2} A_{r e
f}}, \quad C_{T}=\frac{F_{x}}{\tfrac{1}{2} \rho
U_{\infty}^{2} A_{r e f}}, \quad C_{P}=\frac{F_{y}
\dot{h}+M \dot{\theta}}{\tfrac{1}{2} \rho U_{\infty}^{3}
A_{r e f}}
\end{equation}
Here,  $F_x$ is the thrust force,
 $F_y$ is the lift force and
 $M$ is the pitch moment. Moreover,
 $A_{ref}$ denotes the reference area calculated as the product of the span (
 $S$) and chord lengths (
 $c$) of the foil. The mean performance and wake results are time averaged over 10 cycles following the statistical convergence of the simulations with over 2500 timesteps per cycle. The timestep (
 $\delta t$) was set such that its ratio to the Kolmogorov time scale (
 $\delta t / \tau _{\eta }$) was 0.015, which is sufficiently small to accurately solve unsteady wake features. This is consistent with common practice in numerical studies of oscillating cylinders and airfoils (Nazarinia et al. Reference Nazarinia, Lo Jacono, Thompson and Sheridan2009; Merrill & Peet Reference Merrill and Peet2017).
The effect of grid quality on numerical solutions was examined using the traditional grid sensitivity study and grid-size comparison with Kolmogorov length scales. We begin our analysis by assessing the time histories of thrust ( $C_T$) and moment (
 $C_m$), and comparing the time-averaged thrust coefficient (
 $\overline {C_T}$) and the root-mean-square (r.m.s.) of lift (
 $C_{L}^{rms}$) for the foil using three grids, details of which are outlined in table 2. The flow and motion parameters for all grids correspond to those defined for SIM2 in table 1. For each grid, the ratio of the smallest grid element size (
 $\delta x$) to the Kolmogorov length scale (
 $\eta _s$) is presented as
 $\delta ^*=\delta x / \eta _s$ at three streamwise locations in the wake. The length scale ratios are below 10 in the critical flow region for Grid2 and Grid3, which, based on the recommendations of Moin & Mahesh (Reference Moin and Mahesh1998), is sufficiently small for the simulations to capture the main turbulent flow features. In table 2, the relative error in thrust (
 $\epsilon _T$) and lift coefficients (
 $\epsilon _L$) are calculated with respect to the results obtained from the finest grid (Grid3). In particular, they are calculated as
 \begin{gather} \varepsilon_{T}=|\overline{C_{T}}-\overline{C_{T}}_{,fine}| / \overline{C_{T}}_{,fine}, \end{gather}
 \begin{gather} \varepsilon_{L}=\left|C_{L}^{r m s}-C_{L, fine}^{r m s}\right| /C_{L,fine}^{rms}. \end{gather}
Evidently, the time histories of  $C_T$ and
 $C_m$ for Grid2 and Grid3 depict a relatively consistent variation in figure 5. Even the relative errors are less than
 $5\,\%$ between Grid2 and Grid3 for both
 $\epsilon _T$ and
 $\epsilon _{L}$. This small relative error showed that the grid quality is sufficient for capturing the main features of both mean and fluctuating flow fields. We also assessed the effect of grid resolution on the wake developments in figure 6, where the profiles of time-averaged streamwise velocities are shown at
 $x=2c$ and
 $4c$. From these results, and others not shown for brevity, it is evident that the difference between the wake profiles is negligible (
 $<5\,\%$), especially between Grid2 and Grid3. This further provides confidence in the accuracy of our numerical set-up.
Comparison of time histories for thrust and moment coefficients for all grids employed in our study.

Grid sensitivity study using mean streamwise velocity variations along the  $y$-direction at (a)
 $x=2c$ and (b)
 $x=4c$.

Grid refinement details for SIM2 in table 1. Here,  $N_{total}$ represents the sum of hexahedral elements in the background grid and overset grid.

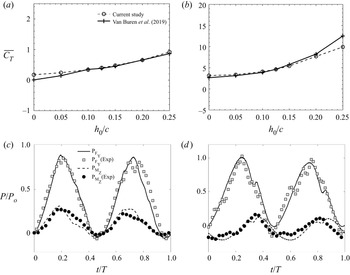
Based on the verification studies outlined above, we utilized Grid3 for all the simulations. The quality of Grid3 is verified to be sufficient for accurately capturing the main features of the mean and turbulent flow. We validate the numerical solutions by comparing our predicted time-averaged coefficients of thrust ( $\overline {C_T}$) from simulations with the experiments of Van Buren et al. (Reference Van Buren, Floryan and Smits2019) in figure 7(a,b). For brevity, we show the cases of reduced frequencies of 0.67 and 1.87 with the maximum pitch angle (
 $\theta _{0}$) and phase differences (
 $\phi$) of
 $15^\circ$ and
 $270^\circ$, respectively. The heaving amplitude (
 $h_{o}/c$) varied from 0 to 0.25 (see table 1). The flow conditions and the parameter space were similar between SIM0 and the experiments of Van Buren et al. (Reference Van Buren, Floryan and Smits2019), which enabled a close comparison of the results. The numerically and experimentally obtained thrust coefficients agreed well in figure 7(a,b). In an attempt to validate the unsteady force variations, we further compared the instantaneous lift and moment components of the total power in an oscillation cycle corresponding to
 $\phi = 0^\circ$ and
 $270^\circ$, respectively. These results are shown in figure 7(c, d). Other parameters such as
 $f^*$,
 $h_o /c$ and
 $\theta _o$ were kept constant at 0.64, 0.375 and 15
 $^\circ$, respectively, for this validation study following the parameter space used by Van Buren et al. (Reference Van Buren, Floryan and Smits2019). It is apparent from the results in figure 7(c, d) that the unsteady variations agreed well with the experimental results. Apart from these, we have performed a thorough evaluation of the solver on predicting the wake of a stationary inclined square panel (at several angles of attack) and a pitching square panel, which all agreed well with the results in literature. Details on this validation effort can be found in Verma & Hemmati (Reference Verma and Hemmati2020). Furthermore, we replicated the wake of a pitching NACA0012 airfoil that was reported by Koochesfahani (Reference Koochesfahani1989), which is not shown here for brevity. The close agreement between numerical and experimental results indicates that the simulation results are sufficient for capturing the main flow features.
Comparison of current numerical results with experiments of Van Buren et al. (Reference Van Buren, Floryan and Smits2019). Variations of mean thrust are compared at (a)  $f^* = 0.67$, and (b)
 $f^* = 1.87$, while unsteady variations of lift and moment contribution to the total power are compared at (c)
 $\phi =0^\circ$ and (d)
 $\phi =270^\circ$. Details of the parameter space are provided in the text.

3. Results and discussion
We start by examining the propulsive performance of two particular oscillatory motions of an infinite span hydrofoil, in which either pitching or heaving motion dominates (SIM1 and SIM2 in table 1). Considering the work of Van Buren et al. (Reference Van Buren, Floryan and Smits2019), these cases constitute two extreme ends of the performance spectrum when combining pitching and heaving motions. Following the evaluation of the propulsive performance in terms of thrust, power and efficiency, we proceed with examining various primary and secondary wake features.
3.1. Propulsive performance
The coefficients of thrust, lift and power are provided in table 3 for SIM1 and SIM2. The propulsive efficiency ( $\eta$) was also calculated based on
 $\overline {C_T}$ and
 $\overline {C_P}$ as follows:
 \begin{equation} \eta=\frac{\overline{C_T}}{\overline{C_P}}=\frac{\overline{F_{x}} U_{\infty}}{\overline{F_{y} \dot{h}}+\overline{M \dot{\theta}}}. \end{equation}
The time-averaged  $C_T$,
 $C_L$ and
 $C_P$ were calculated over ten oscillation cycles following statistical convergence of the simulations. The higher
 $\overline {C_T}$ observed for SIM2 compared with SIM1 agreed well with observations of Van Buren et al. (Reference Van Buren, Floryan and Smits2019), in which the propulsive performance was compared at a range of
 $f^*$,
 $St$ and
 $\phi$. A crucial dependence on
 $\phi$ was identified by Van Buren et al. (Reference Van Buren, Floryan and Smits2019), which also correlated with observations of Anderson et al. (Reference Anderson, Streitlien, Barrett and Triantafyllou1998) and Wu (Reference Wu2011). Van Buren et al. (Reference Van Buren, Floryan and Smits2019) described that, at
 $\phi =330^{\circ }$, the combined heaving and pitching motions produced an optimum peak angle of attack, which led to a large thrust generation within their parameter setting. However, the power requirement also went up significantly, thereby lowering the propulsive efficiency of the system. Here, we also observed a similar rise in the power coefficient (
 $\overline {C_P}$) in SIM2, which tends to lower the predicted efficiency indicated in table 3. The performance estimations for SIM1, however, depicted a corresponding rise in efficiency at the expense of a lowered thrust generation. This was also in agreement with experimental findings of Van Buren et al. (Reference Van Buren, Floryan and Smits2019) at
 $\phi = 270^{\circ }$. This was attributed to the relative decrease in power requirement (that subsequently increased
 $\eta$) to the production of a supplemental force that is required for pitching. This lowers the external moment applied to the foil. Therefore, the phase difference between the two oscillatory motions plays a dominant role in the performance of oscillating foils.
Quantitative evaluation of performance, showing time-averaged coefficient of thrust ( $\overline {C_{T}}$), r.m.s. value of lift (
 $C_{L}^{rms}$), coefficient of power (
 $\overline {C_{P}}$) and propulsive efficiency (
 $\eta$) for SIM1 and SIM2.

Now that we have established there are two very different performances observed by the particular motions imposed on the foil in SIM1 and SIM2, we examine the wake dynamics associated with each of these performance categories: high efficiency and large thrust generation. To this end, we discuss the prominent characteristics of vortex structures observed for SIM1 and SIM2, which highlights the differences and similarities of wake features for high performance regimes identified by Van Buren et al. (Reference Van Buren, Floryan and Smits2019). Some connections between these and the three-dimensional instability features are also discussed with a comprehensive evaluation presented in subsequent sections.
3.2. Primary vortex characteristics
Investigation into primary vortex characteristics for SIM1 and SIM2 was carried out in order to understand the dominant wake mechanisms associated with a high efficiency and large thrust producing wakes, respectively. As mentioned previously, experimental studies conducted by Godoy-Diana et al. (Reference Godoy-Diana, Marais, Aider and Wesfreid2009), Schnipper et al. (Reference Schnipper, Andersen and Bohr2009) and Calderon et al. (Reference Calderon, Cleaver, Gursul and Wang2014) described several wake modes for a pitching or heaving foil by analysing the spanwise vorticity ( $\omega _z$) distribution, which further reflected the two-dimensional nature of primary vortex structures. A vivid dependence on the motion parameters including
 $St$,
 $A_D$ and
 $f^*$ was also observed (Godoy-Diana et al. Reference Godoy-Diana, Aider and Wesfreid2008, Reference Godoy-Diana, Marais, Aider and Wesfreid2009; Cleaver et al. Reference Cleaver, Wang and Gursul2012; Calderon et al. Reference Calderon, Cleaver, Gursul and Wang2014). Therefore, we first highlight the vorticity distributions for SIM1 and SIM2 along with a description of respective wake characteristics, based on previously identified modes for pitching (Schnipper et al. Reference Schnipper, Andersen and Bohr2009) or heaving foils (Cleaver et al. Reference Cleaver, Wang and Gursul2012; Calderon et al. Reference Calderon, Cleaver, Gursul and Wang2014). The temporal variation of performance and spanwise pressure variations within one oscillation cycle were also evaluated. Significant differences that exist for SIM1 compared with SIM2 are described qualitatively, which highlights the dominant physical mechanisms for wake formation, vortex interactions and temporal variations occurring in the high propulsive performance regimes. We also discuss the quantitative evaluation of specific vortex characteristics as the foil completes an oscillation cycle, e.g. vortex size, separation distance and rate of cross-stream advection in the wake. The apparent association of vortex evolution and spanwise instability characteristics was further assessed in this analysis.
3.2.1. Formation of 2P $^T$ wake in SIM1 and performance evaluation

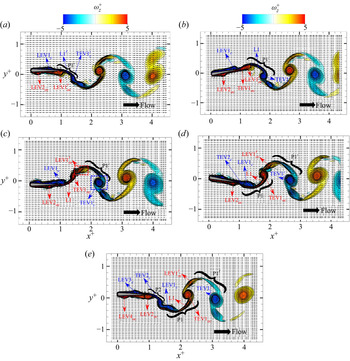
The planar representation of primary vortices was depicted in terms of a non-dimensional spanwise vorticity,  $\omega _z^+=\omega _z c/U_{\infty }$. Figure 8 shows the distribution of
 $\omega _z^+$ at each quarter phase of the oscillation cycle (i.e.
 $\psi = 0^\circ$, 90
 $^\circ$, 180
 $^\circ$, 270
 $^\circ$ and 360
 $^\circ$) for SIM1. A symmetric wake was observed for SIM1, which will be referred to as ‘2P
 $^T$’ formation. This resembled a ‘2P’ vortex-street mode in the near wake region (
 $x^+\leq 4$), whereas a ‘2S’ mode was apparent at
 $x^+>5$. The mechanism for formation of thrust generating ‘2P
 $^T$’ wake configuration (Schnipper et al. Reference Schnipper, Andersen and Bohr2009) is discussed via these spanwise vorticity contours. The instances depict the vortex structures forming at the leading and trailing edges of the foil, which will be referred to as leading edge vortex (LEV) and trailing edge vortex (TEV), respectively. These provide the necessary tools to discuss the formation, interaction and merging of LEVs and TEVs in the wake, and identify the particular wake features associated with each case. These are also limited to the initial ‘2P’ wake that extended to
 $4c$ downstream the trailing edge of the foil. Plots that depict the transition from a nearly ‘2P’ wake to a reverse von Kàrmàn (or ‘2S’) wake are not shown here for brevity, since the vortex coalescence began at
 $x^+\geq 4$.
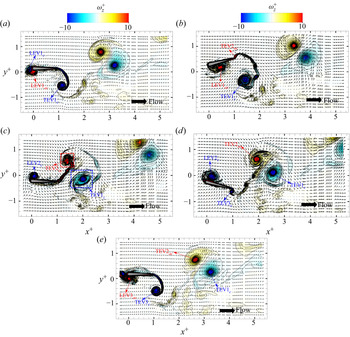
Contours of  $\omega _z^+$ superimposed by velocity vectors for SIM1. Phases (
 $\psi$) of the shedding cycle are (a)
 $\psi =0^{\circ }$ at
 $t = 0$, (b)
 $\psi = 90^{\circ }$ at
 $t = T/4$, (c)
 $\psi = 180^{\circ }$ at
 $t = T/2$, (d)
 $\psi = 270^{\circ }$ at
 $t = 3T/4$ and (e)
 $\psi = 360^{\circ }$ at
 $t = T$.

In figure 8(a), the foil starts at its peak heaving amplitude when  $\psi =0^{\circ }$, during which two LEVs are advected downstream along the foil surfaces. The clockwise vortex named LEV1
 $_c$ was formed above the centreline of the foil during the previous shedding cycle, which had already advected
 $\approx 60\,\%$ of the chord from the leading edge. There is also a counter-clockwise vortex (LEV2
 $_{ac}$ in figure 8a) that is below the foil neutral axis (centreline) and closer to the leading edge. At
 $\psi =90^{\circ }$ in figure 8(b), the foil leading edge moves down due to the imposed heaving motion, while the trailing edge moves upward due to the imposed pitching motion, reaching its maximum angle of attack. At this stage of the oscillations, TEV1
 $_{ac}$ was large enough to form a distinct structure near the foil trailing edge. As the foil completed the half-point in its shedding cycle (
 $\psi = 180^{\circ }$ in figure 8c) and reached its maximum heaving amplitude below the wake centreline, TEV1
 $_{ac}$ appeared to pair with LEV1
 $_c$ that was nearly on the verge of separation from the trailing edge. During the remaining half of the shedding cycle in figure 8(d,e), we observed that LEV1
 $_c$ and TEV1
 $_{ac}$ advected downstream as the first pair (P1) of the ‘2P’ wake. Subsequently, at
 $\psi = 270^{\circ }$ in figure 8(d), a clockwise TEV2
 $_c$ is formed near the trailing edge, owing to the foil downward tip movement. At the final stage of the shedding cycle, TEV2
 $_c$ and LEV2
 $_{ac}$ separated from the foil and advected downstream as vortex pair P2. This coincided with the formation and advection of LEV3
 $_c$ and LEV4
 $_{ac}$ along the foil, respectively. These proceed to become the consecutive counter-part of LEV1
 $_c$ and LEV2
 $_{ac}$, which were already discussed for
 $\psi =0^{\circ }$ in figure 8(a).
The performance characteristics, in terms of thrust and lift, for SIM1 are depicted in figure 9. These characteristics were further evaluated with respect to the surface pressure distribution ( $C_{pr}=(p-p_{ref})/0.5\rho U_{\infty }^2$), vortex structures and their dynamics. As the oscillation cycle started (
 $t=0$ in figure 9a), lift increased uniformly up to a local maximum at
 $t=T/4$ (instant 1), which coincided with a local maximum for thrust as well. This corresponded to the same time that TEVs were formed as well as the time that an LEV advected along the foil bottom face. The increase in lift was hence attributed to the gain in the circulation strength of the LEV, which was observed to pair with the TEV and detach just prior to instant 1 (figure 8b). This separation further imparted a forward momentum to the foil. The instantaneous pressure distribution on the suction side of the foil depicts LEV1
 $_c$ near the trailing edge (figure 10a, d), while LEV2
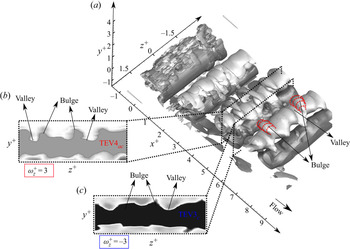
 $_{ac}$ is observed approximately at mid-chord on the pressure side of the foil (figure 10a, d). A distinct low pressure region was also observed near the leading edge depicting the formation of a new LEV structure on account of foil downward motion. In addition to identifying vortex structures, an instability feature was also identified to be prominent on individual LEV
 ${\rm s}$, where structures on the suction side exhibited a normalized spanwise wavelength of
 $\lambda _z/c=0.98$. Those on the pressure side exhibited a spanwise wavelength of
 $\lambda _z/c=0.6$. In terms of normalization with respect to the vortex core radii (
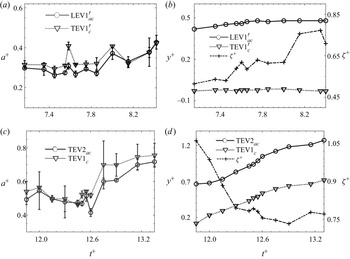
 $a$) for LEV1
 $_c$ and LEV2
 $_{ac}$, where the core radii of these structures were evaluated later in the wake, the normalized wavelength was
 $\lambda _z/a=3.16$ and 1.93 for structures on the suction and pressure sides, respectively. This estimate of
 $\lambda _z/a$ seems close to the numerical estimates of elliptic instability wavelength (
 $\lambda _z/a= 3.35$ and 1.42) depicted in a study by Le Dizès & Laporte (Reference Le Dizès and Laporte2002), where the vortices of unequal circulation strength were considered. Here, for the case of SIM1, we would like to note that the paired vortex structures also possessed unequal strengths, where the ratio of circulation magnitude represented as
 $\varLambda$, for a weak LEV structure (for e.g. LEV1
 $_c$) and its paired TEV structure (for e.g. TEV1
 $_{ac}$), was found to be close to 0.478. It is therefore apparent that an interaction between LEV1
 $_c$ and the developing TEV1
 $_{ac}$, shown in the figure 8(c), would promote a dominant elliptic instability mechanism for a vortex pair (Le Dizès & Laporte Reference Le Dizès and Laporte2002). Further, in order to compare our results with another study on unequal strength counter-rotating vortex pairs, conducted by Ortega, Bristol & Savas (Reference Ortega, Bristol and Savas2003), we evaluated the normalized wavelength with respect to the separation distance between the paired vortex structures (
 $\zeta$). The estimated value of the ratio
 $\lambda _z/\zeta$ was found to be close to 1.88 and 1.15, for LEV1
 $_c$ and LEV2
 $_{ac}$, respectively, which lies in range of elliptic instability wavelengths observed for various experimental runs conducted by Ortega et al. (Reference Ortega, Bristol and Savas2003). This quantitative evidence therefore suggests that an elliptic instability results in such spanwise undulations on the leading-edge vortex filament. For LEV2
 $_{ac}$, the interaction with the foil boundary could also result in its small amplitude waviness, although a thorough investigation of the exact physical origins is still needed. The characteristic contributions of the associated instability mechanism in the wake will be further discussed in upcoming sections related to the three-dimensionality of spanwise rollers. Ahead of instant 1, a new anti-clockwise TEV structure started to develop, which subsequently lowered the momentum transfer. This coincided with a decreased difference in integrated
 $C_{pr}$ over the suction and pressure sides of the foil (figure 10b,e). Thus, the thrust coefficient decreased until
 $t=T/2$ (instant 2). Also, the coefficient of lift approached its local minimum until the LEV detached from the foil trailing edge at
 $t=3T/4$ (instant 3) because of the advection of an anti-clockwise LEV along the bottom boundary of the foil (see figure 8c). Moreover, the vortex pair formed by the new LEV and TEV (P1) detached and moved into the wake at instant 2. Hence, thrust increased until
 $t=3T/4$ (instant 3). This was again well evident from the increased difference in the integrated
 $C_{pr}$ over the suction and pressure side (figure 10c, f). Ahead of instant 3, the clockwise TEV strengthened (see figure 8d), similar to the previous half-cycle, which decreased the thrust until the end of the oscillation cycle (
 $t=T$). The periodicity (period per cycle) for
 $C_T$ was double that of the oscillations due to shedding of two vortex pairs per oscillation cycle. Lift increased ahead of instant 3 as a new clockwise LEV advected along the upper face of the foil (also evident in
 $C_{pr}$ distribution). The variations of the moment coefficient (
 $C_m$) in figure 9(b) were similar to those of
 $C_L$.
Variation of force (a,b) and moment (c) in one cycle for SIM1.

Instantaneous pressure ( $C_{pr}$) distribution on suction side (a–c) and pressure side (d–f) of the foil at instants (a, d) 1, (b,e) 2 and (c, f) 3 of figure 9.

There exist vivid similarities and differences between the characteristic features of ‘2P $^T$’ formation identified for SIM1, which resembles the ‘
 $2P$’ wake observed by Schnipper et al. (Reference Schnipper, Andersen and Bohr2009) for a pitching teardrop hydrofoil. The formation of LEV1
 $_c$, LEV2
 $_{ac}$, TEV1
 $_c$ and TEV1
 $_{ac}$ had similar origins to those identified by Schnipper et al. (Reference Schnipper, Andersen and Bohr2009). The emergence of vortices LEV1
 $_c$ and LEV2
 $_{ac}$ in the boundary layer was also observed by Schnipper et al. (Reference Schnipper, Andersen and Bohr2009), who referred to them as ‘boundary layer’ vortices. However, TEV1
 $_{ac}$ and TEV2
 $_c$ were formed solely due to the large tip speed of the foil trailing edge. The separation distance between LEV1
 $_c$ and LEV2
 $_{ac}$ was half of the chord length, similar to experiments (Schnipper et al. Reference Schnipper, Andersen and Bohr2009). These experimental findings also stated that the time it takes for a leading-edge structure that contributes to the formation of a ‘2P’ wake to travel 1
 $c$ in the streamwise direction is an integral multiple of the oscillation period (
 $T$). Thus, the total time (
 $T_c$) required for a vortical structure to travel one chord length distance is
 $2c/U_{\infty }$ following the assumption of Schnipper et al. (Reference Schnipper, Andersen and Bohr2009) that the travel speed of an advected structure is 0.5
 $U_{\infty }$. In terms of
 $St$, this advection time (
 $T_c$) translates to
 $c\,St/f A$ for SIM1, based on which
 $St$ is approximately 0.174 if we assume
 $T_c$ equal to one oscillation period. This falls within the range of
 $0.17 < St < 0.31$ for vortex synchronization on the phase diagram of Schnipper et al. (Reference Schnipper, Andersen and Bohr2009), in which ‘2P’ mode was prominent. Despite such similarities, the initial wake region of 2P
 $^T$ identified for SIM1 had a different propulsive performance characteristic compared with the wake features identified by Schnipper et al. (Reference Schnipper, Andersen and Bohr2009). According to Schnipper et al. (Reference Schnipper, Andersen and Bohr2009), the vortex pair observed for their ‘2P’ wake mode pointed upstream in the streamwise direction, which leads to a drag producing system. The vortex pair for SIM1 observed in figure 8(e), however, pointed downstream in the streamwise direction, which leads to a thrust generating wake configuration. Even the 2P–2S mode discussed by Schnipper et al. (Reference Schnipper, Andersen and Bohr2009) involved shedding of upstream pointed vortex pairs and one single vortex within each half-shedding cycle.
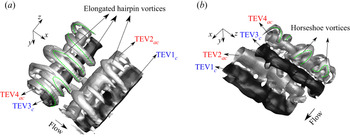
The physics of the near wake vorticity distribution is further investigated to understand the possible mechanism for the formation of such downstream pointing vortex pairs. The LEV1 $_c$ at the start of the oscillation cycle (figure 8a) appears to be connected to TEV1
 $_c^\prime$, which was attached to the foil via its vortex leg L1
 $^\prime$. This continuous attachment of L1
 $^\prime$ with the trailing edge of the foil was possible through the downward heaving motion that increases the vorticity fed to LEV1
 $_c$ through the attached shear layer on the foil surface. This process remains until LEV1
 $_{ac}^\prime$ gains sufficient strength (in terms of vorticity) and motivates vortex leg L1
 $^\prime$ to separate from the body in figure 8(c). Then, TEV1
 $_c^\prime$ and LEV1
 $_{ac}^\prime$ are advected downstream as a pair (P1
 $^\prime$ in figure 8c). A similar mechanism was also observed for the latter half of the shedding cycle with respect to LEV2
 $_{ac}$, L1 and a subsequent vortex pair P1 formed by LEV1
 $_c$ and TEV1
 $_{ac}$. It is important to note that the counter-rotating leading-edge vortices, LEV1
 $_{ac}^\prime$ and LEV1
 $_c$, cause bending of elongated vortex legs L1
 $^\prime$ and L1. This bending results in the vortex pairs P1
 $^\prime$ and P1 pointing downstream and generating thrust. The description provided by Van Buren et al. (Reference Van Buren, Floryan and Smits2019) for the foil motion at
 $\phi =$270
 $^\circ$ also supports our proposed mechanism, wherein the fluid itself strengthens the vorticity generation near the foil which reduces the power requirement, and hence increases the efficiency. Thus, the phase difference (
 $\phi$) between the pitching and heaving oscillations, along with higher
 $A_D$ for SIM1, are potential contributors to attaining a thrust generating configuration for vortex pairs P1 and P2 observed in the near ‘2P
 $^T$’ wake mode of figure 8(e).
The vortex pairs observed in Schnipper et al. (Reference Schnipper, Andersen and Bohr2009) also advected away from the wake centreline, which was further noticed by Hultmark et al. (Reference Hultmark, Leftwich and Smits2007). The observations made by Hultmark et al. (Reference Hultmark, Leftwich and Smits2007) indicated that the lateral component of mutual advection velocity for each vortex pair resulted in them moving away from the wake centreline, thereby preventing any coalescence. Due to the downstream pointed pairs (P $_1$, P
 $_2$ and P
 $_3$) observed in SIM1, there exists a streamwise component for the mutual advection velocity of pairs that promote coalescence of structures with similar vorticity sign. At higher
 $St$, ‘2P’ vortex pairs did appear to merge and form a von Kàrmàn wake (Schnipper et al. Reference Schnipper, Andersen and Bohr2009). It was further observed that the wake transitioned from a ‘2P’ wake mode to a ‘2S’ thrust generating wake at
 $x^+\approx 5$, which further enhanced the thrust generation mechanism by the oscillating foil while keeping the power requirements low. Thus, a higher overall propulsive efficiency was achieved for the ‘2P
 $^T$’ wake of SIM1. This is the first observation of this kind in the literature, to our best knowledge, in which the mutual existence of thrust generating ‘2P’ wake and ‘2S’ wake is observed at low
 $St$. Experiments by Dewey et al. (Reference Dewey, Carriou and Smits2012) suggested that, with increasing
 $St$, the wake only exhibited characteristics of the 2S mode in heaving foils. Quinn et al. (Reference Quinn, Lauder and Smits2015) also reported a 2P wake formation at
 $St= 0.39$ for a flexible streamlined propulsor, which they attributed to their lower flow speeds in order to keep
 $St$ within an optimum range. However, there was no indication of a 2P
 $^T$ mode, and any possible influence it may have on propulsive efficiency of the foils. The loss in efficiency was reported only on account of breakdown of the vortex structure very close to the panel (Quinn et al. Reference Quinn, Lauder and Smits2015). This is in contrast to the 2P
 $^T$ mode observed here with vortices coalescing, instead of breaking down, to form an inverse von Kàrmàn wake with a higher efficiency for SIM1.
3.2.2. Formation of asymmetric wake in SIM2 and performance evaluation
The wake of the pitching-dominated oscillating foil in SIM2 resembles an asymmetric wake. Calderon et al. (Reference Calderon, Cleaver, Gursul and Wang2014) described the dependence of such a stable deflected wake based on the formation and evolution behaviour of trailing-edge structures, similar to the vortex system observed in SIM2. The spanwise vorticity contours overlaid with velocity vectors are shown in figure 11, which depicts the near wake formation, evolution or suppression of structures that form the asymmetric wake.
Contours of  $\omega _z^+$ superimposed by velocity vectors for SIM2. Phases (
 $\psi$) of the shedding cycle are (a)
 $\psi =0^{\circ }$ at
 $t = 0$, (b)
 $\psi = 90^{\circ }$ at
 $t = T/4$, (c)
 $\psi = 180^{\circ }$ at
 $t = T/2$, (d)
 $\psi = 270^{\circ }$ at
 $t = 3T/4$ and (e)
 $\psi = 360^{\circ }$ at
 $t = T$.

As shown in figure 11(a), the foil begins its shedding cycle with a simultaneous upward heaving and pitching motion away from the wake centreline, that is  $y^+ = 0$. The foil initially had a zero pitch angle while the leading edge coincided with a cross-flow location at half of the maximum heaving amplitude. At
 $\psi =0^{\circ }$ (figure 11a), three structures are clearly apparent attached to the foil: LEV1
 $_{ac}$, TEV1
 $_c$ and LEV1
 $_{c}^\prime$. The former two are formed on the lower side of the wake, while LEV1
 $_{c}^\prime$ was initially formed on the upper side in the previous shedding cycle; LEV1
 $_{c}^\prime$ appears to pair with LEV1
 $_{ac}$ and subsequently moves to the wake lower side. The foil trailing edge reached its maximum pitching amplitude at
 $\psi =90^{\circ }$ in figure 11(b), during which LEV1
 $_{c}^\prime$ appeared diffused or largely distorted due to interactions with the foil boundary layer and LEV1
 $_{ac}$. Moreover, TEV1
 $_c$ grew substantially in apparent size to almost
 $2/3c$, while feeding from the large tip movement of the foil trailing edge at high
 $f^*$. As the foil started its downward motion prior to
 $\psi =90^{\circ }$ (figure 11b), a new structure was formed on the upper surface of the foil trailing edge, TEV2
 $_{ac}$. At
 $\psi =180^{\circ }$ in figure 11(c), a new leading-edge structure (LEV2
 $_c$) was formed along the upper side of the foil. This coincided with a total disappearance of LEV1
 $_{ac}$ near the lower side of the trailing edge. The vorticity and momentum associated with LEV1
 $_{ac}$ merged into TEV2
 $_{ac}$. Ultimately, TEV2
 $_{ac}$ joined with TEV1
 $_c$ at
 $\psi =270^{\circ }$ to form a vortex couple (figure 11d), which travelled downstream at an angle similar to the upward deflected jet. Meanwhile, LEV2
 $_c$ grew in its apparent size and strengthened with larger vorticity as the foil started a simultaneous upward heaving and pitching motion. The leading-edge structure on the upper surface (LEV2
 $_c$ in figure 11d) also appeared to undergo a similar pairing and interaction with newly formed LEV3
 $_c$ in figure 11(e) at
 $\psi = 360^{\circ }$. It ultimately disintegrated prior to detachment. This coincided with the growth and strengthening of TEV3
 $_{c}$ at
 $\psi = 360^{\circ }$ in figure 11(e).
Similar to unsteady  $C_T$ and
 $C_L$ variations, and
 $C_{pr}$ distributions for SIM1, we examined the unsteady variations of these parameters for SIM2 (figures 12a,b and figure 13) in conjunction with the evolution of vortex structures in figure 11. The start of the oscillation cycle (
 $t=0$) coincided with the formation of a TEV, the legs of which remained attached to the trailing edge (figure 11a). We noticed that the thrust decreased as the foil began to heave and pitch upwards. At the same time, a clockwise LEV moved along the foil leading edge and subsequently interacted with the anti-clockwise LEV that formed below the foil. This coincided with
 $C_L$ ascending towards its local maximum value. At
 $t=T/4$ (instant 1) in figure 12(a), the clockwise LEV was well diffused, while the anti-clockwise LEV gained significant strength, in terms of circulation (see figure 11b). This coincided with thrust approaching a local positive maximum. At instants described above, unsteady lift variations depicted an interesting feature. The rate at which
 $C_L$ increased dropped just before reaching instant 1 (approximately
 $t/T\approx 0.1$). This coincided with the presence of paired LEV structures near the leading edge of the foil (see figure 11a), and just prior to the disintegration of the clockwise LEV structure (see figure 11b). Their presence, therefore, enhanced lift generation at a higher rate compared with a single LEV. This physical process made no meaningful contribution to thrust production or its rate of change. The pressure distributions on the foil pressure side also depicted the localized low pressure region due to the developed anti-clockwise LEV structure (figure 13a, d). We also observed that the upstream end of this LEV depicted a spanwise instability feature whose value of
 $\lambda _z/c$ was equal to 0.8. In terms of normalization with respect to the diameter of invariant streamtube (
 $d_{inv}$), whose calculations follow a similar procedure as depicted in Leweke & Williamson (Reference Leweke and Williamson1998); Meunier & Leweke (Reference Meunier and Leweke2005), the ratio
 $\lambda _z/d_{inv}$ correspond to 2. We would further like to note here that the dipole configuration in SIM2 composed of counter-rotating vortex structures of equal circulation strength, similar to the study conducted by Leweke & Williamson (Reference Leweke and Williamson1998). Hence, the normalization of spanwise instability wavelength with respect to
 $d_{inv}$ was reasonable and justified here. An interaction with the clockwise LEV1
 $_c^\prime$ (see figure 11a) before its disintegration would hence promote an elliptic instability mechanism (Leweke & Williamson Reference Leweke and Williamson1998) for counter-rotating leading-edge structures which will result in the spanwise undulations observed on upstream end of LEV1
 $_{ac}$. The mechanism also seemed evident near the trailing edge for leading-edge structure in the SIM1 wake. The downstream end, however, did not depict prominent spanwise undulations on account of absence of any neighbouring counter-rotating vortex. Following instant 1, we observed that the local maximum of
 $C_L$ coincided with the local maximum of
 $C_T$. This was further attributed to the clockwise TEV that detached from the trailing edge, while a new anti-clockwise TEV was formed. The integrated
 $C_{pr}$ difference between the suction and pressure side also coincided with the peak in thrust variation (figure 13b,e). Then, thrust reached its local minimum just after instant 2, while the lift coefficient continued to approach its local minimum slowly (smaller slope). This observation was in contrast to the first half-shedding cycle, which is attributed to the transfer of vorticity from the anti-clockwise LEV, moving below the foil, to the developing TEV with a similar rotational direction (figure 11c). This vorticity transfer reduced the rate of lift production on account of the diffused LEV below the foil. Thrust again started to increase ahead of instant 2, while the anti-clockwise TEV had almost attained its maximum circulation.
Variation of force (a,b) and moment (c) in one cycle for SIM2.

Instantaneous pressure ( $C_{pr}$) distribution on suction side (a–c) and pressure side (d–f) of the foil at instants (a, d) 1, (b,e) 2 and (c, f) 3 of figure 12.

We also observed a distinct spanwise instability characteristic for the LEV2 $_c$ developed on the suction side of the foil (figure 13b,e). In contrast to the instability identified on leading-edge structures in SIM2 and SIM1 wakes, which was characterized by a shorter wavelength, the undulations observed on LEV2
 $_c$ appeared to possess a long wavelength with the ratio
 $\lambda _z/d_{inv}\approx 3.5$. In terms of normalization with respect to the chord length,
 $\lambda _z/c \approx 1.4$, we hypothesize that there is a potential interaction with the foil boundary that has led to the development of this instability feature due to the lack of any identifiable interactions with other vortices in close proximity to this LEV. The observations discussed by Chiereghin et al. (Reference Chiereghin, Bull, Cleaver and Gursul2020), for the spanwise undulation observed on the isolated leading-edge vortex for their purely plunging foil, also depicted a ratio of
 $\lambda _z/c= 1$. However, the exact source or origin of instability remained unclear. Ahead of instant 3, the anti-clockwise structure was completely detached from the trailing edge and formed a dipole with clockwise TEV from the first half of the oscillation cycle (see figure 11d). The thrust also approached its maximum value, although with a smaller magnitude compared with its value during the first half of the oscillation cycle. This was also evident in terms of the
 $C_{pr}$ variation, where we observed that the suction side still had a dominant presence of the low pressure region on account of the strengthened LEV2
 $_c$ structure (figure 13c, f). Thus, the difference in the integrated
 $C_{pr}$ on suction and pressure sides would be quite low. For the latter half of the oscillation cycle, the vortex couple formed ahead of instant 3 also provided an induced entrainment effect, which reduced the momentum transfer to the foil. A significant part of the resultant force yielded a substantial lift production on account of asymmetry in the wake. This entrainment effect was not as strong in the first half-cycle due to the formation of a single vortex. The moment characteristics resembled the variation of
 $C_L$ (figure 12), as was evident in the case of SIM1.
Looking at the formation mechanism of the asymmetric wake in SIM2, it is apparent that the trailing-edge structures are solely contributing to the wake deflection, as was suggested earlier by Calderon et al. (Reference Calderon, Cleaver, Gursul and Wang2014) for a similar wake. As trailing-edge structures entrain the fluid behind them, newly forming vortex couples are subsequently deflected. The large magnitude of lift generation (or side force depending on the foil orientation) is also a consequence of the deflected vortex couples. A similar process was observed in the experiments of Calderon et al. (Reference Calderon, Cleaver, Gursul and Wang2014) and Cleaver et al. (Reference Cleaver, Wang and Gursul2012). On the dynamics of leading-edge vortex structures, there have been several studies on their transition, disintegration and loss of coherence near the leading edge of a plunging foil (Visbal Reference Visbal2009; Cleaver et al. Reference Cleaver, Wang, Gursul and Visbal2011). Visbal (Reference Visbal2009) indicated that plunging oscillations at high  $f^*$ and
 $h_o$ led to the formation of a system of dynamic stall vortices that moved around the leading edge and experienced an abrupt breakdown at
 $Re=10\,000$. A similar breakdown was also observed for SIM2, in which the clockwise leading-edge structures experience movement and breakdown near the leading edge, while the anti-clockwise structure merged with a developing trailing-edge vortex. Cleaver et al. (Reference Cleaver, Wang, Gursul and Visbal2011) also described their mode 2 as a deflected wake with high
 $f^*$. The leading-edge vortex formed in mode 2 was also found to lose its coherence due to its interaction with the foil boundary (Cleaver et al. Reference Cleaver, Wang, Gursul and Visbal2011).
There have been many identifiable features of the wake that we have thus far related to the wake three-dimensionality and spanwise instabilities. This hints at the need to provide a thorough investigation of the wake three-dimensional features, their dynamics and interactions. These details are provided in the next section for each wake.
3.2.3. Vorticity and evolutionary features of the wake
In order to better characterize the evolutionary features of vortices observed for SIM1 and SIM2, the variation in size (radii), separation distance and cross-stream coordinate for the centre of counter-rotating structures are examined as they move downstream the wake. A rectangular integration window is constructed over the contour plot, surrounding the clockwise (TEV1 $_{c}^\prime$ and TEV1
 $_{c}$) and counter-clockwise (LEV1
 $_{ac}^\prime$ and TEV2
 $_{ac}$) vortices (see figures 8c and 11c). According to Godoy-Diana et al. (Reference Godoy-Diana, Marais, Aider and Wesfreid2009), using rectangular contour windows reduces the interpolation errors compared with elliptical windows. The centre of these rectangles denotes the location of a maximum or minimum
 $\omega _z^+$ for the counter-clockwise or clockwise structures, respectively. These correspond to vortex pairs in SIM1 (figure 8c) and to vortex couples in SIM2 (figure 11c). The maximum and minimum locations of
 $\omega _z^+$ were easily available via access to three-dimensional velocity fields in the wake. This was followed by a Gaussian fit of the
 $\omega _z^+$ field along horizontal and vertical axes centred on the maximum and minimum locations, respectively. Gaussian fits correspond to the form
 $e^{(-x_i / a_i)^2}$, where
 $a_i$ denotes the standard deviation for streamwise and cross-flow data of
 $\omega _z^+$. The radius of the vortex was then quantified as ‘
 $a_i$’, while ‘2
 $a_i$’ represent the length and width of rectangles surrounding the vortices. Here,
 $t^+$ was defined as
 $t^+=t/ \tau _0$ using the advective time scale,
 $\tau _0=c/U_\infty$.
The variation in the vortex apparent size, that is the normalized radius of counter-rotating vortices ( $a^+= a/c$), is tracked in the wake (figures 14a and 14c) to provide additional quantified details on the wake dynamics. In particular, the trends are indicators of the vortex merger or interactions from previous or subsequent cycles. They also provide evidence regarding the potential association between characteristic three-dimensional spanwise instabilities and primary vortex structures. The differences of actual values from the mean, i.e. the radius calculated via the length and width of the rectangular window, are represented as error bars in figures 14(a) and 14(c). For SIM1, TEV1
 $_c^\prime$ in figure 8(c) possessed a higher radius compared with LEV1
 $_{ac}^\prime$ at
 $t^{+}=7.2$, which is apparent in figure 14(a). This was attributed to early merging of neighbouring clockwise vortices formed in the previous oscillation cycle. The rate of increase in
 $a^+$ was more prominent ahead of
 $t^{+}=8.2$, as the foil approached
 $\psi = 270^{\circ }$, at which point the merging process appeared accelerated. Circulation (
 $\varGamma ^+$) estimations (not shown here for brevity) revealed that TEV1
 $_c^\prime$ from the vortex pair had a higher magnitude of
 $\varGamma ^+$ compared with LEV1
 $_{ac}^\prime$. This led to merging of the neighbouring clockwise vortex LEV1
 $_{c}^\prime$ with TEV1
 $_c^\prime$, while LEV1
 $_{ac}^\prime$ would subsequently merge with its neighbouring counter-clockwise TEV1
 $_{ac}$. It is important to evaluate if the interaction and merging between neighbouring vortices could reveal apparent contribution towards spanwise instability effects on the vortex pair. However, as mentioned by Leweke, Le Dizès & Williamson (Reference Leweke, Le Dizès and Williamson2016), understanding the phenomenon of merging as a consequence of any instability could be debatable since instabilities were even developed when the gap between two co-rotating vortices decreased below
 $6\,\%$ of the two vortex lengths (Cerretelli & Williamson Reference Cerretelli and Williamson2003). This will be made further evident in a later section here, which is dedicated to investigating the wakes’ three-dimensionality. For SIM2, the radii for both counter-rotating coupled structures decreased from
 $t^{+}=11.9$ to 12.5, followed by an increase until
 $t^{+}=13.2$ (figure 14c). Since the magnitude of
 $\varGamma ^+$ for individual structures forming a vortex couple in SIM2 were found to be similar, the decrease in radii of both counter-rotating vortex structures is possibly due to the increased negative straining on each individual structure, which occurs on account of their close proximity. The presence and dependence of growth rates for elliptic instability in primary vortices, with respect to the proximity of the counter-rotating vortices, was discussed by Leweke & Williamson (Reference Leweke and Williamson1998) and Boustead, Ryan & Sheard (Reference Boustead, Ryan and Sheard2010). While Leweke & Williamson (Reference Leweke and Williamson1998) indicated that the growth rate of the
 $[-1,1]$ Kelvin mode increased as the vortices approached each other, Boustead et al. (Reference Boustead, Ryan and Sheard2010) discussed a coupling mechanism for the outer perturbation field of a pair of vortices which intensified as the vortices approached each other. We therefore believe that an increased negative strain field intensity, which coincides with a decreased separation distance, reduced the radii of vortical structures. Investigation into the change in separation distance (
 $\zeta ^+$) between the centre of counter-rotating structures during a similar time provides more insightful observations that are discussed later. This indicates that vortices approaching each other in the near wake experience an increased negative straining. Since a merging process was not noticed for SIM2 (in figure 11c), the increase in radii of vortices during
 $t^{+}=12.5 - 13.3$ can be attributed to the loss in angular momentum of structures advecting downstream.
Variation of (a,c) vortex radii,  $a^+$, (b, d) cross-stream coordinate of vortex centre,
 $y^+$ and (b, d) separation distance between the paired and coupled vortices,
 $\zeta ^+$, with normalized time scale
 $t^+$, for (a,b) SIM1 and (c, d) SIM2, respectively.

The tracking of the cross-stream coordinate ( $y^+$) and separation distance between the centres of counter-rotating vortex structures (
 $\zeta ^+=\zeta /c$) in figures 14(b) and 14(d), enabled the quantitative evaluation of the advection path of vortex structures (LEV1
 $_{ac}^\prime$,TEV1
 $_c^\prime$, TEV2
 $_{ac}$ and TEV1
 $_c$) and differences in the dynamics of vortex pairs and dipoles. The vortices that formed a pair in SIM1 followed a symmetric path whereas the vortex dipoles clearly followed an asymmetric path. Inviscid models were previously suggested (He & Gursul Reference He and Gursul2016), which predict the dipole advection and wake deflection within reasonable agreement with experiments. However, the instability features on individual vortex structures (such as LEVs or TEVs), and their association with the temporal evolution of the deflected and symmetric wake configuration might not be discussed using those inviscid models. Here, the discussion further provides insights into the association of temporal evolution of individual vortex structures with some prominent instability characteristics and viscous effects, while quantitatively evaluating the advection of pairs and dipoles. The cross-flow advection speed of the structures in SIM2 was calculated using the slope of the cross-flow coordinate of the vortex centres, that is
 ${\textrm {d}y}/\textrm {d}t$ in figure 14(d). The slope indicated that the average cross-flow velocity of TEV2
 $_{ac}$ and TEV1
 $_c$ is approximately
 $0.56U_{\infty }$. This provides a substantial lateral momentum, which leads to the asymmetric wake. The separation distance (
 $\zeta =\sqrt {(x_{ac}-x_{c})^2+(y_{ac}-y_{c})^2}$) between the vortex centres, that is
 $(x_{ac},y_{ac})$ and
 $(x_{c},y_{c})$, for pairs and dipoles also depicts vivid differences in figure 14(b, d). For SIM1, an increase in
 $\zeta ^+$ for the paired vortices is observed on account of the merger of weaker LEVs with the neighbouring TEVs. Hence, the amplitude of instability growth would be more sensitive between the co-rotating vortex structure than the counter-rotating vortices of each individual pair. This was briefly discussed in the previous paragraph as well that described the vortex merger and its association with spanwise instability. For SIM2, however,
 $\zeta ^+$ decreased until approximately
 $t^{+}=12.9$ and then stayed approximately steady. We suspect that, for the initial part, the induced velocity of each vortex, which forms a part of a dipole, was high enough to counteract the viscous diffusion effects, and therefore brought the vortices closer to each other. This could intensify the strain field between the vortices and could thereby lead to a growth of instability that has higher amplitudes compared with regions where the dipole vortices are not in such close proximity. Similar assessment was made by Leweke & Williamson (Reference Leweke and Williamson1998) where the amplitude of the short wavelength, or the elliptic instability of the vortex pair, was larger in regions where the paired vortices were closest. More investigation into how this contributes towards dislocations on vortex core and the formation of secondary vortex structures will be evaluated in the next section of this paper. Further, as the contributions of opposing centrifugal forces and viscous diffusion became prominent downstream, the induced velocity was not sufficient to further reduce
 $\zeta ^+$, which hence remained approximately steady thereafter. The shorter
 $\zeta ^+$ for dipoles in SIM2 as compared with the pairs in SIM1 had been previously observed by Godoy-Diana et al. (Reference Godoy-Diana, Marais, Aider and Wesfreid2009), wherein the low frequency oscillatory pitching yielded a higher
 $\zeta ^+$ for counter-rotating vortex structures in comparison with the high frequency pitching. However, the measurement of distance was only made for a single instant when the positive vortex crossed a reference location in the wake. Here, we assessed the changes in
 $\zeta ^+$ with respect to the temporal evolution of the wake and thereby evaluated differences in the dynamics of vortex pairs and dipoles. To further connect the advection characteristics with some prominent aspects of propulsive performance, the advection speed of the structures was further calculated using the variation of the streamwise coordinate of the vortex centre (
 $x^+$) over time (not shown here for brevity). The slope of the data corresponding to the pair of counter-rotating vortices in SIM1 indicated that the wake phase velocity is 7 % smaller for LEV1
 $_{ac}^\prime$ and 9 % larger for TEV1
 $_c^\prime$ relative to the free-stream flow. However, the phase velocity of coupled vortices observed for the wake in SIM2 was approximately twice that of SIM1. This should intuitively promote a higher thrust generation in SIM2, which agrees with earlier observations.
3.3. The wake three-dimensionality
The three-dimensional wake topology for both cases was examined in terms of spatial dislocations or corrugations observed on the primary spanwise rollers. It was then followed by evaluation of the secondary vortices, or ribs, in the wake. This study expands on the previous work of Deng & Caulfield (Reference Deng and Caulfield2015), Deng et al. (Reference Deng, Sun and Shao2015), Moriche, Flores & García-Villalba (Reference Moriche, Flores and García-Villalba2016) and Sun et al. (Reference Sun, Deng and Shao2018), who studied the wake of an infinite and finite span oscillating foil. The Floquet stability analysis of Deng & Caulfield (Reference Deng and Caulfield2015) and Deng et al. (Reference Deng, Sun and Shao2015) on a pitching foil revealed spatio-temporal characteristics for dominant modes of streamwise vortices that formed in the wake at  $Re=1500$. In another study, Moriche et al. (Reference Moriche, Flores and García-Villalba2016) revealed that the net effect of bending and roll-up of a TEV around an LEV is minimal with respect to the aerodynamic performance of the oscillating foil. Even for the case of a high aspect ratio plunging foil, Sun et al. (Reference Sun, Deng and Shao2018) theoretically determined the existence of major instability modes, which were differentiated based on the spanwise wavelength of secondary structures in the wake. Chiereghin et al. (Reference Chiereghin, Bull, Cleaver and Gursul2020) recently observed spanwise deformation and instability on an isolated leading-edge vortex, shed from a high aspect ratio plunging wing. The wavelength of their observed spanwise undulations showed resemblance to similar instability modes that were previously identified by Sun et al. (Reference Sun, Deng and Shao2018). Such undulations were also evident from our pressure (
 $C_{pr}$) distributions for both wakes, discussed in the previous section. Here, we expand on these findings by detailed examination of the dynamics associated with primary and secondary structures in the wake of oscillating foils with combined heaving and pitching motions.
3.3.1. Primary vortices in high efficiency wake (SIM1)
Figure 8 depicts the mechanism for 2P $^T$ wake formation. The pairs of counter-rotating vortices formed appear to move up to approximately
 $4c$ downstream of the foil trailing edge while maintaining their 2P formation (Schnipper et al. Reference Schnipper, Andersen and Bohr2009). As they moved farther downstream, however, structures with similar sign vorticity merged to form an inverse von Kàrmàn street, or a 2S wake (Schnipper et al. Reference Schnipper, Andersen and Bohr2009). Here, we focus on the three-dimensional analysis of the wake depicting primary vortices (rollers) using the iso-surface of vorticity components in figure 15. The initial 2P wake depicts the stretched vortex legs of stronger TEVs that connect the counter-rotating LEVs to form a pair. The legs remain in conjunction with the TEV up to
 $x^+\approx 4.2$, after which they start to diffuse by viscous effects. The vortex structures appear to merge with TEVs that have a similar sign vorticity to their neighbouring vortex pair. This merger, along with continued interaction of paired TEV legs, coincided with the corrugations and deformations of weaker LEVs. These so called ‘dislocations’ possessed different spatio-temporal characteristics that are discussed in this section. Three vortex pairs, namely P
 $_1$, P
 $_2$ and P
 $_3$, are identified in the wake in figure 15(a). Each pair is composed of a vortex formed at the leading edge, which later advects in association with the leg of the TEV formed in the subsequent half-shedding cycle. The corresponding vortex legs in each pair were also identified in figure 15(a) as L
 $_1$, L
 $_2$ and L
 $_3$. Here, L
 $_1$ does not appear as prominent in the wake as L
 $_2$ and L
 $_3$, partly due to the diffusion caused by viscous effects. Furthermore, L
 $_2$ resulted in the stretching of LEV2
 $_{ac}$, which begins merging with TEV3
 $_{ac}$ that was shed in the successive shedding cycle. A similar process was also observed for LEV1
 $_c$ of pair P
 $_1$, although the sign of circulation was different. There appears to be a unique mechanism at play here, in which TEVs that possess larger circulation compared with LEVs impose different spanwise dislocation characteristics on the rollers. As observed in figure 15, the corrugations associated with LEV1
 $_c$ and LEV2
 $_{ac}$ exhibit noticeable differences in spanwise direction. The quantitative estimate of the circulation for TEV1
 $_{ac}$ is
 $\varGamma ^+ = 0.81$, which is
 $11\,\%$ larger than the estimated value of
 $\varGamma ^+=0.732$ for TEV2
 $_c$, and is likely caused by merging with LEV1
 $_c'$. The different circulation estimates for TEV1
 $_{ac}$ and TEV2
 $_c$ further provide a strong evidence for the mechanism hinted at above.
Dislocations of primary structures in the wake for SIM1 using (a) iso-surface of spanwise vorticity,  $|\omega _z^+|=0.5$. The iso-contours of
 $|\omega _z^+|$ on the
 $yz$-plane are shown at (b)
 $x^+ =4$, and (c)
 $x^+ = 5$. Here,
 $\omega _z^+ = +0.5$ is coloured in grey and
 $\omega _z^+ =-0.5$ in black.

We further describe the evidence to support our proposed mechanism for dislocations, and their associated characteristic differences for subsequent LEVs shed in the wake. The increased axial straining on the legs of TEVs, due to the increasing circulation, formed regions identified as a valley and bulge on the rollers (LEVs) in figures 15(b), 15(c) and 16. In particular, the valleys and bulges were formed for LEV1 $_c$ in pair P
 $_1$ and LEV2
 $_{ac}$ in pair P
 $_2$. However, the depth-to-spanwise-width ratios were different for the identified dislocations. For LEV2
 $_{ac}$, the associated valleys and bulges had much smaller depth-to-spanwise-width ratios, resulting in finer corrugations compared with those observed on LEV1
 $_c$. The iso-contours of normalized spanwise vorticity shown on the
 $yz$-planes of figures 15(b) and 15(c) (passing through the cores of LEV1
 $_c$ and LEV2
 $_{ac}$) depict larger and deeper valleys for LEV1
 $_c$ compared with LEV2
 $_{ac}$. This effect was again attributed to the higher straining on LEV1
 $_c$ caused by TEV1
 $_{ac}$. We calculated the ratio of spanwise wavelength for the vortex dislocations and the core radii (
 $a$), which depicted a value close to 2.68, and appeared to be relatively smaller compared with the ratio
 $\lambda _{z}/a$ that was observed for the leading vortex filament in the previous section. However, in terms of normalization with respect to the chord, we observed a value of
 $\lambda _{z}/c\approx$ 0.8, that was quite close to value of
 $\lambda _{z}/c\approx$ 0.98, estimated for the leading-edge vortex (LEV1
 $_c$). Experimental findings of Zhang et al. (Reference Zhang, Fey, Noack, König and Eckelmann1995) and Brede et al. (Reference Brede, Eckelmann and Rockwell1996) also indicated that there exists an instability of primary vortex rollers that result in ‘tongue-like’ formations, which elongate to form secondary vortex structures. These depicted topological similarities with valley and bulges identified on LEV2
 $_{ac}$ and LEV1
 $_c$ for SIM1. Boustead et al. (Reference Boustead, Ryan and Sheard2010) further discussed ‘crescent’-shaped features observed on primary vortices, which were attributed to the short wavelength elliptic instability growth. Such descriptions, therefore, warrant a need for a thorough Floquet analysis to further confirm, theoretically, if the three-dimensionality is indeed attributed to a dominant instability of the primary vortices. We further observe in figure 15(b) that spanwise instability was developed even as LEV2
 $_{ac}$ and TEV3
 $_{ac}$ were in close proximity of one another, prior to their merger. This also supports our previous discussion with regards to the consequences of vortex merger on the origin of instability. We did not observe any conclusive evidence that would suggest vortex merger between co-rotating vortex structures promotes the instability growth. Similar observations were apparent for instability growth in a co-rotating pair which comprised equal strength vortex structures, in an earlier experimental study by Meunier & Leweke (Reference Meunier and Leweke2005). Moreover, Leweke et al. (Reference Leweke, Le Dizès and Williamson2016) described that, for high
 $Re$ flows (
 $\approx$4000), the diffusive stage in merging of vortices (McWilliams & Zabusky Reference McWilliams and Zabusky1988) often lasted longer, thereby providing sufficient time for the instability to develop and grow. This was ultimately followed by the convective stage of the merger, where the vortices approach each other rapidly, and then merge (McWilliams & Zabusky Reference McWilliams and Zabusky1988). We believe that this nonlinear instability growth could indicate the unstable premature merging that was discussed by Leweke et al. (Reference Leweke, Le Dizès and Williamson2016). This process will further result in the ejection of vorticity from the outer vortex layer of the weaker co-rotating LEV roller (for instance, LEV2
 $_{ac}$ in figure 15b).
Dislocations are highlighted on the iso-surface plots of normalized  $Q$-criterion (
 $Q^{+} = Qc^{2}/U_{\infty }^{2}\approx 0.01$), overlaid with iso-surface of
 $\omega _z^+$ = 0.5 in grey and
 $\omega _z^+ = -0.5$ in black shown from spanwise (a) top view and (b) bottom view.

The accelerated increase in radii observed in figure 14(a) also coincides with the advective time, which might further be an indication of the convective merging process. However, its consequence for the instability is still debatable. Figure 15(c) depicts a similar asymmetric perturbation growth on LEV1 $_c$ and TEV2
 $_c$, although their merger is almost complete. As shown above, an apparent similarity was observed in terms of
 $\lambda _z/c$ when comparing the spanwise instability characteristics and plausible mechanisms observed on LEV
 ${\rm s}$ that advected over the foil boundary (figure 10) and the paired vortex structures in the wake; LEV1
 $_c$ in figure 10(a, d) depicted a ratio
 $\lambda _z/c$ approximately equal to 0.98, which was close to the value estimated for LEV1
 $_c$ in the wake (
 $\lambda _z/c \approx$ 0.8). However, for the LEV structure located around the mid-chord region (LEV2
 $_{ac}$ in figure 10b,e), we observed a 30 % difference in its estimated
 $\lambda _z/c$ compared with the value observed here in the wake. Thus, quantitative predictions showed that an elliptic instability mechanism of counter-rotating vortex pairs would lead to development of an instability feature for vortex structures located over the foil and also those identified in the wake of SIM1. However, the difference in the wavelength predicted for LEV
 ${\rm s}$ that were still around the mid-chord length could be on account of the initiation of the elliptic instability that would be in its nascent stages of development. Until the LEV
 ${\rm s}$ reach sufficiently close to the developing TEV legs (see figure 8d), the dominant effects of elliptic instability mechanism does not seemed prominent, as those observed in the wake. For the wake structures presented ahead of
 $x^+=7$, the dislocations were not as pronounced as those observed in the near wake. No significant valley or bulge formation was noticed on the primary vortex rollers.
Some of the above highlighted spatial dislocations were also discussed previously by Mittal & Balachandar (Reference Mittal and Balachandar1995). For example, similar observations were reported in the wake of stationary cylinders on account of a core instability mechanism where the dislocations were related to the formation of horseshoe structures along the spanwise rollers (Mittal & Balachandar Reference Mittal and Balachandar1995). As these rollers advected downstream, the incremental principal strains on braid shear layer between the consecutive rollers elongated the legs of the horseshoe vortex, forming a so called hairpin structure. Further elongation caused streamwise vortex pairs or ribs to form in the wake. Here, to further investigate whether there were any horseshoe or hairpin vortices in the wake of SIM1, we visualized the spanwise vortex cores in terms of isosurface of  $Q$-criterion overlaid with contours of spanwise vorticity (see figure 16). The spanwise view of the rollers in figure 16(a) (top view) and figure 16(b) (bottom view) provides a vivid visualization of the aforementioned dislocations for LEV1
 $_c$ and LEV2
 $_{ac}$. The green dotted lines on LEV1
 $_c$ and LEV2
 $_{ac}$ in figure 16 represent the differential spatial topology of valleys and bulges. No imminent formation of horseshoe or hairpin vortices was noted in the wake. This is an important observation since the intermediate vortex structures formed on account of core instabilities of rollers will not contribute towards the formation of secondary vortices as was observed by Mittal & Balachandar (Reference Mittal and Balachandar1995). The details on qualitative and quantitative characteristics of secondary structures for SIM1 will be further discussed later in this section.
3.3.2. Primary vortices in large thrust wake (SIM2)
The asymmetric wake of SIM2 had a dominant presence of strong counter-rotating TEVs that advected downstream as vortex couples, at an angle from the free-stream flow. Near wake formation mechanisms and interaction of primary vortices that form the couples had been previously investigated in some experimental studies (Calderon et al. Reference Calderon, Cleaver, Gursul and Wang2014). However, three-dimensional spatial characteristics for coupled rollers in the spanwise direction still need further assessment. Similar to depiction of rollers for SIM1, we present the iso-surfaces of spanwise vorticity ( $|\omega _z^+|$) for SIM2 in figure 17. Spatial characteristics of dislocations and their differences along the wake are very apparent for the coupled rollers. These characteristics also appear to be different from those observed in the wake of SIM1. The valleys and bulges identified here have a much larger depth to width ratio compared with those observed in the wake of SIM1. This is apparent when comparing the deeper dislocations on coupled rollers in figure 17 to their counterparts in SIM1 (figure 16). This observation also coincides with a decreased separation distance (
 $\zeta ^+$) for SIM2, compared with SIM1, as depicted earlier in figures 14(b) and 14(c). Focusing further on SIM2, the valleys and bulges for the vortex couple at
 $x^+=8$ are more flattened in comparison with the upstream couple. This can be explained by the elongation of the prominent dislocations, in the form of horseshoe or hairpin vortex structures, under the increased axial straining between the coupled rollers. In order to investigate the presence of these horseshoe and hairpin structures, we look at the iso-surfaces of
 $Q$-criterion overlaid with contours of
 $\omega _z^+$ in figure 18. These plots represent spanwise view of vortex couples at
 $x^+=6$ and 8 respectively, depicting the emergence and development of streamwise dislocations of the rollers.
Dislocations observed for the primary structures in the wake for SIM2 using (a) iso-surface of  $|\omega _z^+| =3$ with valleys and bulges depicted on the
 $yz$-plane at (b)
 $x^+ = 5.4$, and (c)
 $x^+ = 6$. Legends are the same as previous figures.

Dislocations observed for the primary structures in the wake for SIM2 are highlighted in iso-surface plots of normalized  $Q$-criterion (
 $Q^{+} = Qc^{2}/U_{\infty }^{2}\approx 0.09$) overlaid with coloured contours corresponding to
 $\omega _z^+ = 3$ (grey) and
 $\omega _z^+ = -3$ (black): (a) top and (b) bottom view of the wake.

Three elongated hairpin vortices are identified in figure 18(a). The emergence of these hairpin vortices appears to be following the mechanism proposed by Mittal & Balachandar (Reference Mittal and Balachandar1995), although the spatial development and elongation for legs of hairpin vortices showed differences compared with the wake of stationary cylinders. The legs of each hairpin structure appear to wrap around the counter-rotating vortex TEV3 $_c$, which itself is coupled with TEV4
 $_{ac}$. An additional insight was on the growth of hairpin vortices, which form a conjoint horseshoe vortex on the head of the hairpin vortices. These conjoint structures, identified in figure 18(b), wrap around their counterpart couple, similar to the hairpin structures in figure 18(a). However, the legs of the horseshoe vortex structures do not elongate to lengths comparable to those of the hairpin structure. Similar hairpin vortex structures also appear on couple located downstream.
Although the dislocations in the form of hairpin and horseshoe structures appeared to be in stark contrast with those observed in SIM1, these structures still seem to emerge out of the primary vortex cores thereby hinting at a core instability discussed by Mittal & Balachandar (Reference Mittal and Balachandar1995). A similar instability mechanism seemed prominent for SIM1, which led to the formation of valleys and bulges (figure 15). Specifically, the ratio of the spanwise wavelength for the observed dislocations and  $d_{inv}$ depicts a value of 1.813 that appears relatively close to SIM1. In terms of normalization with respect to chord length, the ratio
 $\lambda _z/c$ corresponds to 0.73. We also observed some similarities in the spanwise instability characteristics observed previously on the leading-edge primary rollers discussed in the previous section. As noted for LEV1
 $_{ac}$ on the pressure side in figure 13(a, d),
 $\lambda _z/c$ depicted a value close to 0.8. It was also evident that since LEV1
 $_c^\prime$ advected along the leading edge and interacted with the developing LEV1
 $_{ac}$ for a short duration, the elliptic instability mechanism for a counter-rotating vortex pair (Leweke & Williamson Reference Leweke and Williamson1998) would be responsible for the observed spanwise undulation in figure 13(a, d). However, figure 13(b,e) provided evidence that the isolated leading-edge vortex (LEV2
 $_c$) also depicted a spanwise instability whose value of
 $\lambda _z/c$ was close to 1.4, in contrast to that observed for LEV1
 $_{ac}$. Thus, it was speculated that the mechanism for the spanwise instability that occurred for LEV2
 $_c$ would be different from the elliptic instability mechanism for vortex pairs, and could involve an interaction with the foil boundary. These similarities and differences in mechanisms for spanwise instability were therefore evident for LEV
 ${\rm s}$ and TEV
 ${\rm s}$ in SIM2.
Despite the observations hinting at core instability being imminent on the coupled rollers in the wake of SIM2, the interaction of well-developed and mature legs of hairpin structures, with the small scale vorticity existing within the braid regions between the coupled rollers is possible. This could also contribute towards the formation of streamwise vortex structures or secondary vortices. Such three-dimensional interaction was discussed as a centrifugal instability by Brede et al. (Reference Brede, Eckelmann and Rockwell1996) for a stationary cylinder wake, and more recently hinted by Deng & Caulfield (Reference Deng and Caulfield2015) for oscillatory wake flows behind pitching foils. The ratio of the estimated wavelength associated with spanwise dislocations on SIM2 rollers and the chord length indicated a value approximately equal to 1. A recent experimental study on high aspect ratio wings in plunge oscillations by Chiereghin et al. (Reference Chiereghin, Bull, Cleaver and Gursul2020) predicted a similar ratio for the spanwise instabilities observed on isolated leading-edge vortex structures. However, the physical origin of these instabilities was speculated to be due to either an oscillating mixing layer, oscillating wake or an individual vortex filament (Chiereghin et al. Reference Chiereghin, Bull, Cleaver and Gursul2020). Therefore, a stability analysis to identify prominent Floquet modes still seems necessary in order to determine a plausible origin of the three-dimensionality and deformation of primary rollers observed for SIM2.
3.4. Secondary vortex structures
The identification of instability mechanisms and characteristics of secondary vortices, or ‘ribs’, has been well investigated for wakes of cylinders at low  $Re$. Moreover, they have been found to have dominant presence behind normal flat plates (Hemmati et al. Reference Hemmati, Wood and Martinuzzi2016), bluff elongated trailing edge (BTE) cylinders (Ryan et al. Reference Ryan, Thompson and Hourigan2005; Gibeau et al. Reference Gibeau, Koch and Ghaemi2018) and pitching or heaving foils (Deng & Caulfield Reference Deng and Caulfield2015; Sun et al. Reference Sun, Deng and Shao2018) in low to high
 $Re$ regimes. Contrary to the definition of rollers as having constant spanwise vorticity, ribs are identified with a dominant, and in cases constant, streamwise vorticity that occurs in pairs. Their orientation typically aligns with the spanwise direction. Periodic spatial and temporal behaviour of ribs were observed to vary with ranges of
 $Re$ and shape of the bluff body, although the prominent modes of formation were still explained via characteristic instabilities of vortex rollers (mode A) and separated shear layers (mode B) (Williamson Reference Williamson1996). The occurrence and growth of instabilities is often investigated at low
 $Re$. However, we could relate the dominant features of streamwise vortex shedding to previously identified modes, as described in a recent study by Gibeau et al. (Reference Gibeau, Koch and Ghaemi2018). This section therefore focuses on identifying the spatial and temporal evolution of secondary structures in the wake of oscillating foils with unique propulsive performance characteristics (SIM1 and SIM2). The spanwise wavelength (
 $\lambda$) for secondary vortex pairs was calculated using auto-correlation while their periodicity was examined using cross-correlation of
 $|\omega _x^+|$ across the
 $yz$-plane. We compared these estimates and features with previously identified rib characteristics for fixed or oscillating cylinders and foils in order to characterize the three-dimensional wake. Table 4 lists the modes and their corresponding
 $\lambda$ identified for different geometries and
 $Re$. We further propose a vortex skeleton model for SIM1 and SIM2 that highlights the dominant wake evolution associated with high propulsive performance of oscillating foils.
Quantitative comparison of spanwise wavelength for secondary vortices in wake of different geometries, motion and  $Re$. Diameter (
 $D$), height (
 $h$) and chord length (
 $c$) for respective geometries were used for normalizing
 $\lambda _{z}$.

The wavelength of the ribs, defined as  $\lambda _z = \lambda / c$, denotes the spacing between two consecutive streamwise vortex pairs aligning along the spanwise direction. In order to calculate
 $\lambda _z$, the coefficient of spatial auto-correlation was determined
 \begin{equation} C(\Delta z)=\frac{\left\langle\omega_{x}^{+}\left(y_{0}, z_{0}, t_{i}\right) \cdot \omega_{x}^{+}\left(y_{0}, z_{0}+\Delta z, t_{i}\right)\right\rangle}{\omega_{x, r m s}^{+}\left(y_{0}, z_{0}, t_{i}\right) \omega_{x, r m s}^{+}\left(y_{0}, z_{0}+\Delta z, t_{i}\right)}, \end{equation}
where  $t_i$ is the snapshot of the
 $\omega _x^+$ distribution collected from the
 $i$th shedding cycle. For each planar
 $\omega _x^+$ representation, the value of
 $C(z)$ is calculated with respect to spanwise lag or shift,
 $\Delta z$. The results of
 $C(z)$ are then averaged by data obtained from 5 shedding cycles. As the value of
 $C(z)$ is plotted with respect to
 $\Delta z^+(=\Delta z / c)$ along the spanwise direction, an extremum for
 $C(z)$ occurred on account of the rib periodicity. The distance between the maximum of
 $C(z)$ and the first minimum provides an estimated value of half of
 $\lambda _z$ for ribs in the wake. The periodicity in temporal evolution of ribs in the streamwise direction is further determined using spatial cross-correlation applied between two subsequent streamwise locations, corresponding to centres of primary vortex rollers. These vortices are shed at fixed time intervals with respect to shedding period (
 $T_{shed}$) in different locations in the wake. This presents ideal temporal data for analysing the evolution of ribs. The formulation for the cross-correlation coefficient is given as
 \begin{equation} \rho(\Delta z)=\frac{\left\langle\omega_{x}^{+}\left(y_{o}, z_{0}, t_{i}\right) \cdot \omega_{x}^{+}\left(y_{o}, z_{0}+\Delta z, t_{i}+T_{s h e d}\right)\right\rangle}{\omega_{x, r m s}^{+}\left(y_{o}, z_{0}, t_{i}\right) \omega_{x, r m s}^{+}\left(y_{o}, z_{0}+\Delta z, t_{i}+T_{s h e d}\right)}. \end{equation}
Similar to the analysis of auto-correlation data discussed earlier, we examine the variation of  $\rho (z)$ with respect to the spanwise shift (
 $\Delta z$) to gain a quantitative understanding of the ribs characteristics. The sign switch for ribs between consecutive full or half-shedding cycles is determined based on whether
 $\rho (z)$ began with a positive value and subsequently dropped towards a local minimum, or vice versa. If the former condition holds, then it implies that ribs maintain their direction of rotation as the shedding cycles progress. However, if there is any change or reversal in the streamwise vortex sign, this implies that the curve for
 $\rho (z)$ tends towards a local maximum value from an initial starting value. The results for the cross-correlation are then averaged for five shedding cycles.
3.4.1. Secondary vortex structures in SIM1
We first assess the spatial location for alignment of secondary vortices with respect to turbulent streamwise velocity fluctuations ( $u^\prime$) on
 $yz$-planes. The streamwise location of each plane was governed by the position of counter-rotating primary vortex rollers. A similar analysis was also carried out by Gibeau et al. (Reference Gibeau, Koch and Ghaemi2018), who reported that a dominant alignment of secondary vortices was observed in the region where
 $u^\prime$ distribution was negative. They further linked this characteristic to the model for mode B instability proposed earlier by Brede et al. (Reference Brede, Eckelmann and Rockwell1996), wherein the streamwise vortices always passed on the side of rollers with negative
 $u^\prime$ distribution with respect to the advecting frame of reference.
Figure 19(a) depicts the  $yz$-plane corresponding to location of the centre of the primary vortex rollers TEV3
 $_{ac}$ and LEV2
 $_{ac}$. Since TEV3
 $_{ac}$ had a counter-clockwise circulation, the value of
 $u^\prime$ was negative with respect to the advecting frame of reference in the region above TEV3
 $_{ac}$. The black dotted lines depicted on the
 $u^\prime$ spatial distribution represent the region where values of
 $u^\prime$ were close to zero. Please note that the
 $yz$-plane passes through both TEV3
 $_{ac}$ and LEV2
 $_{ac}$, hinting at the existence of two lines of
 $u^\prime \approx 0$. Figure 19(b) depicts the iso-surfaces of
 $|\omega _x^+| =0.055$ that provide a vivid three-dimensional representation of continuous rib pairs as they pass over each roller. In order to determine the precise spanwise location of the ribs with respect to the rollers, we look at the planar iso-contours of
 $\omega _x^+$ at the same location as in figure 19(a). The contours clearly show an alignment of streamwise vortex pairs specifically in regions where
 $u^\prime <0$, with respect to the free-stream flow. In addition to the alignment of rib pairs in regions of
 $u^\prime \lessapprox 0$, we also observed the streamwise vorticity distribution along spanwise locations where
 $u^\prime >0$. However, it is important to note that the distribution in these locations is within the core regions of rollers. Thus, they should not be interpreted in terms of dominant streamwise vortices that align and extend through the braid regions between consecutive vortex couples. Deng & Caulfield (Reference Deng and Caulfield2015) reported a similar observation on the existence of opposite signed streamwise vortex structures within coupled rollers.
(a) Iso-surface of  $\omega _z^+ = +0.5$ (grey) and
 $\omega _z^+=-0.5$ (black) along with
 $yz$-plane contour of
 $u^\prime$ at
 $x^+ = 4$. (b) The depiction of ribs using iso-surface of
 $\omega _x^+ = +0.055$ (grey) and
 $\omega _x^+ =-0.055$ (black) along with the
 $yz$-plane contour of streamwise vorticity at
 $x^+ = 4$.

Figure 20(a) shows the contour of  $u^\prime$ on a plane passing through rollers TEV2
 $_c$ and LEV1
 $_c$, although the region of negative
 $u^\prime$ now falls below the rollers. The alignment of the dominant streamwise vortex pairs appear below LEV1
 $_c$ in figure 20(b). The combination of these observations indicates that the ribs in SIM1 closely follow the model proposed by Brede et al. (Reference Brede, Eckelmann and Rockwell1996) for the streamwise vortex arrangement of mode B. However, further analysis is needed to validate the dominant mode characteristics for the secondary structures with respect to
 $\lambda _z$ and streamwise periodicity.
(a) Iso-surface of  $\omega _z^+ = +0.5$ (grey) and
 $\omega _z^+=-0.5$ (black) along with the
 $yz$-plane contour of
 $u^\prime$ at
 $x^+ = 5$. (b) The depiction of ribs using iso-surface of
 $\omega _x^+ = +0.055$ (grey) and
 $\omega _x^+ =-0.055$ (black) along with the
 $yz$-plane contour of streamwise vorticity at
 $x^+ = 5$.

In order to further characterize the rib pairs in terms of their spanwise spacing ( $\lambda _z$), the auto-correlation coefficient (
 $C(z)$) was calculated for
 $\omega _x^+$ along the span. Figure 21 shows
 $C(z)$ plotted against the spanwise shift (
 $\Delta z$). In particular, the variation of
 $C(z)$ for the rib pairs identified on different
 $yz$-planes (previously shown in figures 19 and 20) is presented in figure 21(a). The distance between the initial maximum value and the first minimum of
 $C(z)$ hints at
 $\lambda _z\approx 0.7$. Farther downstream the wake at
 $x^+=6.65$ and
 $7.65$, which is after the wake transition from 2P to 2S, the variation of
 $C(z)$ in figure 21(b) hints at a similar
 $\lambda _z$. Extending our study of the rib arrangement into the mid-wake allows investigating of the spatio-temporal changes that could have occurred due to the wake transitioning from the 2P to 2S arrangement. Figures 22(a) and 22(b) show the iso-contour plots of
 $\omega _x^+$ at the mid-wake locations, where the dominant alignment of rib pairs was still evident. This suggested that as the primary vortex rollers undergo a mode transition from 2P to 2S, the streamwise vortices maintain their spatial distribution and periodicity along the spanwise direction. The spanwise wavelength of ribs is in close agreement with the prediction of Williamson (Reference Williamson1996), Zhang et al. (Reference Zhang, Fey, Noack, König and Eckelmann1995), Brede et al. (Reference Brede, Eckelmann and Rockwell1996) and Gibeau et al. (Reference Gibeau, Koch and Ghaemi2018) for the streamwise vortex arrangement in mode B. The study of Ortega et al. (Reference Ortega, Bristol and Savas2003) further highlighted that the ratio of spanwise wavelength of the streamwise undulations, and separation distance
 $\zeta$ between the unequal strength counter-rotating vortex pair, was approximately in the range of 1–1.2 for several experimental runs. For the secondary structures identified for SIM1, this ratio (
 $\lambda _z/\zeta$) was estimated to be approximately 1.22, which hints that the instability of the unequal strength primary vortex pairs is associated with the development and interaction of the secondary vortex pairs.
Variation of  $C (\Delta z)$ with respect to spanwise shift (
 $\Delta z^+$) during (a) 2P wake at
 $x^+=4$ and 5, and (b) 2S wake at
 $x^+=6.65$ and 7.65 for SIM1.

Alignment of streamwise vortex pairs on the  $yz$-plane at (a)
 $x^+ = 6.65$ and (b)
 $x^+ = 7.65$ for SIM1.

Temporal evolution of ribs and their streamwise periodicity with respect to shedding period was investigated using cross-correlations of  $\omega _x^+$ on the
 $yz$-plane for two consecutive full (figure 23a) and half (figure 23b) shedding cycles. It was evident that the ribs maintain their direction of rotation, i.e. temporal periodicity, in each full and half-shedding cycle. Based on the observations made above, the ribs follow the mode B arrangement and its corresponding characteristics.
Variation of  $\rho (\Delta z)$ obtained from cross-correlations of
 $\omega _x^+$ between (a) full and (b) half-shedding cycles for SIM1.

3.4.2. Secondary vortex structures in SIM2
We now assess the asymmetric wake of SIM2 to determine the characteristics of its dominant secondary structures. The procedure follows that described for SIM1. We first evaluated the location of the secondary vortex alignment with respect to the  $u^\prime$ distribution on the
 $yz$-planes passing through the cores of spanwise rollers. This is followed by determining
 $\lambda _z$ and the streamwise periodicity of ribs in the wake.
Figure 24(a) depicts the  $yz$-plane passing through vortex roller TEV4
 $_{ac}$. Since TEV4
 $_{ac}$ has a counter-clockwise circulation,
 $u^\prime$ has a negative value in regions located above the roller. In figure 24(a), the black dotted line represents spanwise locations where
 $u^\prime \approx 0$ with respect to the advecting frame of reference. From the distribution of
 $\omega _x^+$ in figure 24(c), it is apparent that the dominant rib pairs align in regions where
 $u^\prime$ is both negative and positive. Thus, there is a significant difference observed on the spatial topology of ribs in SIM2 compared with SIM1. The three-dimensional structure of the ribs was qualitatively evaluated using iso-surfaces of
 $\omega _x^+(=0.5)$ in figure 24(d). The ribs clearly appear to wrap around the counter-rotating vortices that advect as a couple. The observations of Deng & Caulfield (Reference Deng and Caulfield2015), Deng et al. (Reference Deng, Sun and Shao2015) and Sun et al. (Reference Sun, Deng and Shao2018) revealed a similar distribution for streamwise vortex pairs in the wake of pitching and heaving foils, although some differences exist that are mainly due to their lower
 $Re$ range of 1500–1700. The long wavelength mode for a pitching foil and mode A for a heaving foil did not reveal a continuous rib structure (Deng & Caulfield Reference Deng and Caulfield2015; Sun et al. Reference Sun, Deng and Shao2018). However, the short wavelength mode for a pitching foil depicted continuity only for two successive shedding cycles after which the structures decayed on account of viscous dissipation (Deng & Caulfield Reference Deng and Caulfield2015). Comparing the current wake with the observations of Deng & Caulfield (Reference Deng and Caulfield2015), Deng et al. (Reference Deng, Sun and Shao2015) and Sun et al. (Reference Sun, Deng and Shao2018), the ribs maintained a continuous profile for three subsequent shedding cycles (i.e. approximately
 $9c$ downstream of the foil trailing edge). The orientation and appearance of coherent structures in mid-wake hint at increased axial straining within braid vorticity regions due to newly forming vortex couples in the near wake. Statistical characteristics of secondary structures, such as
 $\lambda _{z}$ and periodicity, can provide more clues on whether structures retain their coherence in the wake. The non-uniform distribution of
 $u^\prime$ was attributed to the effects of dislocation on primary vortices previously discussed as part of figure 18. However, this does not appear to have made a major impact on the arrangement of secondary structures or ribs. Furthermore, the distributions of
 $u^\prime$ in figure 25(a) and
 $\omega _x^+$ in figure 25(c) indicated that the alignment of secondary vortices follow a similar trend to that described for figure 24(a) and
 $\omega _x^+$ in figure 24(c). This provides qualitative evidence that counter-rotating rib pairs, along the spanwise direction, enclose and wrap each vortex couple. This topology will be further described using a skeleton model in § 3.5.
(a,b) Iso-surface of  $\omega _z^+ = +3$ (grey) and
 $\omega _z^+=-3$ (black) along with the
 $yz$-plane contour of
 $u^\prime$ at
 $x^+ = 5.4$. (c, d) The depiction of ribs using iso-surface of
 $\omega _x^+ = +0.5$ (grey) and
 $\omega _x^+ =-0.5$ (black) along with the
 $yz$-plane contour of streamwise vorticity at
 $x^+ = 5.4$.

(a,b) Iso-surface of  $\omega _z^+ = +3$ (grey) and
 $\omega _z^+=-3$ (black) along with the
 $yz$-plane contour of
 $u^\prime$ at
 $x^+ = 6$. (c, d) The depiction of ribs using iso-surface of
 $\omega _x^+ = +0.5$ (grey) and
 $\omega _x^+ =-0.5$ (black) along with the
 $yz$-plane contour of streamwise vorticity at
 $x^+ = 6$.

Deng & Caulfield (Reference Deng and Caulfield2015) and Deng et al. (Reference Deng, Sun and Shao2015) found two different estimates for  $\lambda _z$ that correspond to the short and long wavelength modes described earlier in this section. The long wavelength mode was characterized by
 $\lambda _z =1$, whereas the short mode was characterized by
 $\lambda _z =0.21$ (Deng & Caulfield Reference Deng and Caulfield2015). The mode A and mode B predicted by Sun et al. (Reference Sun, Deng and Shao2018) for a heaving foil also had
 $\lambda _z =1.05$ and 0.196, respectively. The spatial auto-correlation of
 $\omega _x^+$ is presented in figure 26(a), which corresponds to
 $\lambda _z=0.72$, similar to the value estimated for SIM1. Moreover,
 $\lambda _z$ falls within the range of
 $\lambda _{z} = 0.7h{-}0.8h$ for mode B that was estimated for a BTE cylinder by Gibeau et al. (Reference Gibeau, Koch and Ghaemi2018). It also resembles the predicted long wavelength mode and mode A (
 $\lambda _{z} = 1c$) for pitching and heaving foils, respectively, that were characterized by Deng & Caulfield (Reference Deng and Caulfield2015) and Sun et al. (Reference Sun, Deng and Shao2018). Investigation into the ratio of spanwise wavelength of counter-rotating rib pairs to the
 $d_{inv}$ revealed a value close to 1.813. This suggests a core instability mechanism, which was also discussed earlier for SIM1. However, the discussion presented for the identified horseshoe and hairpin structures in the previous section linked their interaction with the pre-existing vorticity in the braid region. This interaction is now evident in the form of matured secondary vortices observed between two vortex couples, which therefore indicates an instability feature of the braid region. The asymmetric streamwise spatial development of ribs in figures 24(c, d) and 25(c, d) further hints at the need for a vortex skeleton model that provides a complete topological structure for the wake.
Variation of  $C (\Delta z)$ with respect to normalized spanwise shift (
 $\Delta z^+$) in the (a) near wake and (b) mid-wake of SIM2.

We further investigated  $\lambda _z$ at different locations in mid-wake (e.g.
 $x^+=7.4$ and 8.4). This enables analysing of the consistency in characteristics of coherent streamwise structures. As apparent from figure 27(b), the wavelength in the wake changes from
 $\lambda _z=0.7$ to 0.75 on moving closer to
 $x^+=8$. The corresponding iso-contour of
 $\omega _x^+$ in figure 27 also identifies that the alignment of rib pairs does not change significantly in mid-wake. The temporal periodicity for the ribs was further assessed using cross-correlation of
 $\omega _x^+$ between two consecutive full and half-shedding cycles. The variation of
 $\rho (z)$ in figures 28(a) and 28(b) shows that the ribs maintain their spanwise periodicity with respect to shedding cycles, and their periodic characteristics remain similar to those observed for SIM1.
Iso-surface of  $\omega _z^+$ with the alignment of streamwise vortex pairs shown on
 $yz$-planes at (a)
 $x^+ = 7.4$ and (b)
 $x^+ = 8.4$.

Variation of  $\rho (\Delta z)$ with respect to normalized spanwise shift (
 $\Delta z^+$) based on cross-correlations of
 $\omega _x^+$ between (a) full and (b) half-shedding cycles for SIM2.

3.5. Vortex skeleton models for high propulsive performance regimes
The simplified vortex skeleton model representing all observations outlined thus far is presented in figure 29(a) for SIM1, which coincides with highly efficient propulsive performance of an oscillating foil. Similarly, the simplified model of the wake for SIM2 is presented in figure 29(b), which coincides with large thrust generation for an oscillating foil with combined heaving and pitching motion. These schematics depict the overall spatio-temporal arrangements for primary (rollers) and secondary (ribs) vortex structures based on the quantitative and qualitative analyses presented in previous sections. Each model represents the wake region from 2 $c$ downstream of the trailing edge of the foil to
 $\approx 7c$, where the dominant three-dimensional characteristics were observed in the flow. For SIM1, the initial 2P
 $^T$ wake mode composed of rollers in the form of pairs. The weaker vortices of a pair interacts with the stronger structure with similar vorticity sign as the neighbouring pair, and they eventually merge to form an inverse von Kàrmàn, or 2S, wake configuration. The counter-rotating streamwise vortices or ribs are observed to pass over the rollers while maintaining their direction of rotation with successive shedding cycles. The model also shows the pairing of counter-rotating ribs in the spanwise direction. Despite the transition of the wake from 2P to 2S mode for rollers, the paired ribs are not affected in terms of their spatio-temporal characteristics.
Vortex skeleton models for (a) SIM1 and (b) SIM2. Here,  $+\varGamma$ and
 $-\varGamma$ denote the circulation for counter-clockwise and clockwise rollers, respectively, and
 $+\varGamma _{RI}$ and
 $-\varGamma _{RI}$ denote the circulation for counter-clockwise and clockwise ribs, respectively.

For the asymmetric wake of SIM2, the rollers advect downstream in the form of vortex couples and they do not show dominant interaction or merger between them. The rib configuration depicts a different topology compared with SIM1, wherein the secondary vortex pairs wrap around the couple to form a vortex loop. The conjoint horseshoe vortex dislocations (in figures 17 and 18) and their subsequent elongations lead to the formation of these vortex loops, which enclose the roller couples. This mechanism, in combination with the large axial straining within the braid region of consecutive vortex couples, could explain the peculiar rib topology observed in the wake. The rib pairs align along the spanwise direction and maintain their circulation as they move downstream.
4. Conclusions
The evolution of coherent structures and vortex arrangements were examined numerically in the wake of oscillating foils with a combined heaving and pitching motion at  $Re=8000$ and
 $St=0.21-0.94$. Using the OGA method in OpenFOAM, two extreme performance settings were observed at low and high
 $St$. The foil exhibited high efficiency and small thrust generation at low
 $St$, or SIM1. In contrast, larger thrust generation was observed at high
 $St$ (SIM2), which coincided with a lower propulsive efficiency. These performance characteristics agreed well with experimental findings of Van Buren et al. (Reference Van Buren, Floryan and Smits2019), which motivated a detailed study of the wake to identify any major alterations that coincide with such performance variations.
The higher efficiency wake (2P $^T$) in SIM1 coincided with coalescence and interaction of vortex structures in neighbouring pairs. Vortices that formed a pair (2P mode) possessed different magnitudes of circulation. This supported our hypothesis that weaker LEVs merge with stronger TEVs of the neighbouring pair, thereby promoting transition of the wake to 2S or inverse von Kàrmàn mode. However, the phenomenon of merger of co-rotating vortices did not show any major consequence for the characteristics of instability where the spanwise corrugations developed on account of a strengthening strain field, as the co-rotating vortices approached one another. The increase in the separation distance of counter-rotating vortices of a pair was further prominent due to vortex coalescence (or merger) observed for 2P pairs. Near the foil, the apparent straining exerted by counter-rotating LEVs, which formed on the opposite side, eventually bent the elongated legs of TEVs. This resulted in downstream pointed pairs, which themselves formed a thrust producing momentum jet near the foil trailing edge. Pressure distribution along the suction and pressure surface of the foil further showed imminent spanwise instability features on leading-edge rollers, whose ratio of spanwise wavelength (
 $\lambda _z$) and chord length (
 $c$) depicted a value close to 0.98, as they approached the developing trailing-edge structures. This further showed resemblance to elliptic instability of the counter-rotating vortex pair whose mechanism and description were discussed previously by Le Dizès & Laporte (Reference Le Dizès and Laporte2002) and Ortega et al. (Reference Ortega, Bristol and Savas2003).
The high efficiency wake of SIM1 did not incorporate any hairpin vortex formation, contrary to the wake of stationary cylinders. Moreover, the wake exhibited spanwise dislocations, which possessed different spatial characteristics with respect to temporal evolution of primary vortex rollers. In particular, there existed valleys and bulges in the spanwise direction on the weaker LEV rollers that interact and merge with the stronger TEV rollers. The depth-to-spanwise-width ratio of these corrugation-type dislocations on LEVs was further dependent on the circulation of their neighbouring TEVs, such that TEVs with larger circulation led to a relatively larger ratio. The estimated ratio of spanwise wavelength to chord length revealed a value of 0.8, which again hints at a dominant elliptic instability of primary vortices, similar to that observed for LEV ${\rm s}$. The tongue like formations on shed LEV
 ${\rm s}$ further provide evidence for the instability features, although theoretical analyses in terms of Floquet modes are still needed to confirm these findings. Statistical correlation techniques combined with qualitative examination of the wake revealed that secondary vortex arrangements resemble the long wavelength mode and mode A for pitching and heaving foils, respectively, and mode B for stationary circular and BTE cylinders. The presence of the 2P
 $^T$ mode in the wake did not significantly alter the secondary vortex arrangements, such that they retained their continuity. A new vortex skeleton model is introduced that details salient features of the spatial wake topology for the high efficiency wake of oscillating foils with combined pitching and heaving motion.
The larger thrust generating wake of SIM2 resembled an asymmetric configuration, which was dominated by shedding of vortex couples that possessed a similar magnitude of circulation, and no mutual interactions. The asymmetry mode observed was in line with mode 2 and mode A observed in studies of heaving foils. However, the variation of separation distance between the coupled vortices of a dipole, with the advective time, exhibited a decrease in the first half-oscillation period as the induced velocity overcomes the opposing centrifugal forces and viscous diffusion, while bring the counter-rotating vortices closer. The higher negative straining due to close proximity of coupled vortices coincided with a decrease in their radii. This stronger strain field also coincided with the appearance of large scale dislocations on the coupled vortex structures. The corresponding pressure distribution revealed similar spanwise instability features on leading-edge rollers as those shown for SIM1. However, it is speculated that the stronger vortex–foil interactions near the leading edge led to the early development of long wavelength spanwise undulation with  $\lambda _z/d_{inv}\approx 3.5$ or
 $\lambda _z/c\approx 1.4$.
Investigating the wake three-dimensional features for the large thrust generating wake of SIM2 also revealed similar dislocations and instability features in the spanwise direction compared to SIM1. The ratio of spanwise wavelength to diameter of the invariant streamtube was observed to be approximately 1.813. However, the wake for the former is dominated by hairpin vortex structures, which further contributed to strongly deformed TEV rollers. The legs of conjoint hairpin-horseshoe vortices, which emanate from the primary vortex cores, wrapped around each vortex couple. Hence, they provided a distinct dislocation feature for the asymmetric wake. The interaction of these conjoint hairpin-horseshoe structures with the braid vorticity region further hints at a braid instability mechanism that also contributes to the formation of secondary structures in SIM2. Statistical correlation techniques provided an estimated spanwise wavelength ( $\lambda _{z}$) in range of 0.7
 $c$–0.75
 $c$, similar to SIM1. The temporal periodicity assessment also revealed that ribs maintained their direction of circulation during the shedding cycles. The secondary vortex arrangements resembled those of mode B for cylinders and the long wavelength mode for pitching foils. A novel skeleton model is introduced that incorporates a continuous rib profile, where the ribs wrap around each primary vortex couple up to at least three consecutive oscillation cycles.
The propulsive wake characteristics revealed potential reasoning for high efficiency performance of the foil in SIM1 compared with large thrust generation in SIM2. In case of the former, the apparent downstream pointed vortex pairs provide a sufficient streamwise component of mutual advection velocity, for each pair, such that a momentum excess is developed in the wake. This is further enhanced by the inverse von Kàrmàn wake that existed beyond  $x^+ \approx 5$. The added momentum from the inverse von Kàrmàn wake provided additional thrust, while also keeping the power requirements low. This explains the higher propulsive efficiency in SIM1. However, there were no apparent wake features that facilitated low thrust generation in SIM1, which hints at it being attributable to the low
 $St$ oscillations and the dominance of pitching motion. Contrarily, the large thrust generation in SIM2 was attributed to the high amplitude oscillations combined with larger
 $St$. Furthermore, the wake asymmetry led to the generation of larger lift (or side) forces in SIM2. Although this improves manoeuvrability in underwater locomotion, it requires significantly more power input for maintaining the foil under cruise conditions. Hence, the larger thrust generation coincided with a lower propulsive efficiency.
Funding
This research has received support from the Canada First Research Excellence Grant. The computational analysis was completed using Compute Canada clusters.
Declaration of Interests
The authors report no conflict of interests.