1. INTRODUCTION
The objective of this work is to quantify the territorial impact of the railway service in terms of the distribution of population. The central hypothesis is that, in the long term, access to the railway bestows a comparative advantage on the best-connected areas with respect to the less-connected ones. To achieve this objective, we analysed data on population and railways over a long period. The study provides a general overview from the middle of the 19th century, while the analysis mainly focuses on the 20th century, a period in which the railway network was extensive and stable. We mainly focus our study on the period 1900-1970, when roads started to compete with railway servicesFootnote 1 .
The cornerstone of this work is the previous creation of a geographical database on the railway network and its relationship with another, georeferenced, alphanumeric database relating to total population at the municipal level. These cartographic and census data have been homogenised in series at 10-year intervals in order to facilitate their combined analysis. This previous work provided the base for obtaining the innovative results that this article offers for Spain for the first time. The methodology has been developed so that it could be applied in any other country for which the same information is available. However, so far, few countries have developed this type of data. For this reason, we also hope to encourage others to work in this area of research in line with a recent joint projectFootnote 2 . The results obtained clearly show that it is possible to make substantial progress in spatiotemporal analysis using Geographic Information System (GIS) tools. Studying history based on territory-related data has opened an interesting research field. This approach allows us to contribute new results to the existing knowledge about the impact that the railway has had on population growth. Until now, this subject had been examined at the local and regional levels and carried out through monographic studies. What makes it possible to use this methodology at the national level is the fact that it can be applied to compare all of the local entities. As a complement, in the final section we have included several specific cases in order to improve the interpretation of the previously presented global results. To this end, we studied three lines and some very specific cases offering a good qualitative approach in greater detail. These elements should allow us to appreciate the relevance of the general conclusions.
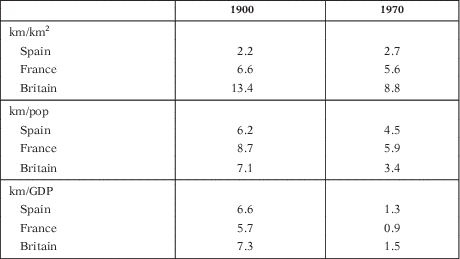
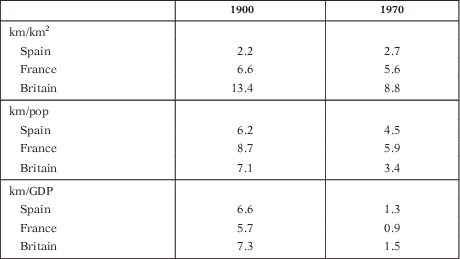
Spain is a very appropriate country for this type of comparison between areas affected, or not affected, by the presence of railways. The reason for this is that even though it has a balanced rail network, it is one of the lowest density networks in Europe. As a result large areas, including important cities, are not connected to the network. Paradoxically, in other countries with much greater railway track densities, almost all populated areas have a nearby rail connection, so this type of comparative analysis is more difficult. In 1900, Spain had 2.2 km of railway track per 100 km2, while France had 6.6 km per 100 km2 and Britain had over 13 km per 100 km2 (Table 1). These differences proved to be really significant during the 20th century, but they gradually reduced from the 1960s onwards when the countries with the highest densities had to reduce their networks. Hence, in 1970, the densities of the rail networks of the three previously cited countries present smaller differences: 2.7, 5.5 and 8.8 km of track per km2, respectively. The point is that Spain maintained a rather stable network, which facilitates long-term analysis of the impact of the railway on its distribution of population.
DENSITY OF THE RAILWAY NETWORK WITH RESPECT TO SURFACE AREA, POPULATION AND GDP: GREAT BRITAIN, FRANCE AND SPAIN, 1900 AND 1970
Sources: calculated from HGISe database.
km/100 km2, km/10,000 pop., km/1 million (1990 Int. GK$).
We argue and conclude that, although neither spectacular nor homogeneous, this impact has been evident across the whole territory and must therefore be appropriately quantified and interpreted to better understand the influence of transportation on population. In this article, we show that this relationship exists in Spain. We can therefore deduce that it should also exist in other countries in which it has not yet been revealed and should be discovered when a similar statistical analysis is applied. This approach aims to explain that the mechanisms responsible for the concentration of population are particularly complex when we consider territorial factors. This is a quantitative approach whose results should be read in light of the population geography and regional economic history of Spain in the 20th century. Although this is not one of the main objectives of this article, it is clear that the interpretation of data is of great relevance and importance to the economic geography of the country. Studies that have interpreted the evolutions of the different regional economies (Nadal and Carreras Reference Nadal and Carreras1990; Vinuesa Reference Vinuesa1996) have shown that, between 1900 and 1970, economic activity clearly grew at above the average rate in the coastal areas, Madrid and the Ebro valley. Works that have related the railway to economic activity in Spain (Gómez Mendoza Reference Gómez Mendoza1982) have shown that in parts of the interior, freight transport was mainly based on sending agricultural products to population nuclei. Meanwhile, in the areas of the industrial north, Madrid and the Mediterranean, the railway has contributed to the development of emerging activities.
The extensive bibliography dedicated to this subject includes analyses undertaken from different perspectives and focuses on the factors that explain population dynamics. These include political, social, historical, geographical and economic considerations. However, to date, relatively little research has been done into the historical factors responsible for population distribution associated with transport systems using GIS. Our hypothesis is that having good access to the railway network tends to foster the concentration of population and a lack of such access tends to exacerbate the loss of population. This impression is particularly evident when we examine those periods, prior to the 1970s, in which the railway network experienced its greatest expansion before the generalised use of road transport.
In next section, we will consider the literature on this subject. In the third section, we will present the data and explain the methodology. We then describe the main characteristics of the evolution of the railway network in Spain, before explaining the evolution of population with respect to rail connectivity. This analysis was conducted for both the whole of Spain and, in greater detail, in section 5, for three particularly significant lines.
2. LITERATURE
To date, few studies have related changes in population density to the historical evolution of the railway network in a quantitative way using GIS. In the literature, it is considered proven that the railway favours social and economic transformation within its area of influence. To measure and compare this phenomenon, we suggest making more systematic analyses based on detailed data. The bibliography that supports this approach is quite recent and refers to different European countries. In this section, we will provide information on the orientation and methodology adopted in these studies. We shall then refer to a more specific bibliography relating to the case of Spain. The common perspective of these studies is a quantitative one, using complete data sets and GIS analysis to reach new conclusions about the territories considered. They follow our approach in the sense that they do not try to prove any causality between the evolution of the railway network and that of population concentration — which would be scientifically impossible — though they do attempt to determine its role as one of a number of influential factors.
Mojica and Martí-Henneberg (Reference Mojica and Martí-Henneberg2011) carried out an analysis that focused on urban areas in which they compared data about urban population and railways in Portugal, Spain and France. This work could be considered a precedent to the current paper, which offers the novelty of including the complete set of municipalities within a specific state. The scope of the study that Mójica and Martí-Henneberg undertook responded to the need to contrast the inequalities that railways brought to territories, which already had marked regional disparities; in it, they compared three states with very different characteristics. They combined and digitalised data about railway lines and their basic attributes: years of opening and closure. Using this information, they then carried out a comparative study, focusing on the number of kilometres of railway track in each country and the location of the urban agglomerations that they connect, showing how the evolution of railway systems has influenced the distribution of population. They concluded that railways, together with the industrialisation process, favoured the concentration of population and that this was particularly evident in the second half of the 19th century. While agglomerations lacking railway connections also experienced population growth during this period, this took place at a slower rate. As a result, railways tended to exacerbate territorial disparities.
The paper by Schwartz et al. (Reference Schwartz, Gregory and Thevenin2011) is also comparative, but focused on rural areas, describing geohistorical differences between France and Great Britain in economic, demographic and cultural terms. In doing this they defined national patterns of local and regional differences and emphasised the experiences of rural communities. In such areas, having a railway connection implied being more competitive when it came to attracting commerce, population and industry. They argued that such communities would have benefited from economic revitalisation thanks to the new opportunities for the commercialisation of rural products that the railways made possible.
A study by Silveira et al. (Reference Silveira, Alves, Lima, Alcântara and Puig2011) placed special emphasis on the way in which railways have left their mark on the urban dynamics of the regions of Portugal. They used population data at the commune level, as in the other countries studied. This information was derived from censuses that were first conducted before the introduction of the railway network. This therefore allowed significant comparisons between the periods prior to and after the introduction of the railway. They concluded that the railway had had a positive impact on population growth and internal migration and reinforced existing regional disparities. They also underlined the fact that this occurred at different intensities according to the area and period under study.
Kotavaara et al. (Reference Kotavaara, Antikainen and Rusanen2011a, Reference Kotavaara, Antikainen and Rusanen2011b) focused their study on Finland during the periods 1880-1970 and 1970-2007, using an original application of GIS, which analysed tendencies for demographic change associated with access via road and rail. The first part studied the period 1880-1970 and aimed to answer questions related to how road and rail access influenced population density. Their approach was based on total population at the municipal level taken at 10-year intervals. In order to avoid the possibility of gaps due to administrative changes, they used interpolated municipal population data to apply the administrative structure of 2007 to the whole period. The objective of this study was to measure accessibility by road and rail in three different ways: population density at the municipal level, as a measure of local accessibility; the distance from the centre of each municipality to the nearest railway station, as a measure of access to the railway network at the municipal level; and an analysis of potential accessibility, which described how the populations of all the different municipalities could access each other. They showed that settlements with railway connections grew at a faster rhythm than those that did not have such facilities. They reported that before industrialisation and railway construction, the country’s population had been quite homogenously distributed and that potential accessibility became a relevant factor influencing the distribution of population when the country’s industrial cities began to grow: towards the end of the 19th century.
In the case of Turkey, a similar methodology was applied for the period 1856-2000 (Akgüngör et al. Reference Akgüngör, Aldemir, Kustepeli, Gülcan and Tecim2011). This paper aimed to explore the effects of the expansion of the railway on population and used a newly elaborated database based on population censuses. Within their theoretical framework, the authors concluded that transport infrastructure did not only have an effect on productivity and employment but also led to changes in living standards, in the distribution of population and in migration: «people might well prefer to live in a well-connected city where they can obtain higher wages and better education for their children» (Akgüngör et al. Reference Akgüngör, Aldemir, Kustepeli, Gülcan and Tecim2011, p. 139). Their results showed that the expansion of the railway led to an increase in population densities in cities that were located along railway routes. This effect was even greater during the period just before 1940: the point in time after which government policies decided to favour road transport.
In other works, Gregory and Martí-Henneberg (Reference Gregory and Martí-Henneberg2010) and Alvarez et al. (Reference Alvarez, Franch and Martí-Henneberg2013) studied the case of England and Wales before the First World War. The railway data analysed included the years of opening and closure of both railway lines and stations (Cobb Reference Cobb2003). Furthermore, for these territories, population data were available at a very detailed scale: the population censuses of English civil parishes Footnote 3 . In order to avoid potential information gaps due to border changes, the population data were interpolated so that they could always be used with reference to the same administrative boundaries. These studies also concluded that railway connections provided a driving force for population growth and that the absence of such connections encouraged depopulation.
More recently, Koopmans et al. (Reference Koopmans, Rietveld and Huijg2012) have studied the impact of accessibility by rail on the growth of population in the Netherlands between 1840 and 1930. In this case, they designed an indicator of accessibility that incorporated a simple gravity model, which took into account accessibility both within municipalities and between them. Among their conclusions, they associated high levels of relative accessibility with population growth, particularly when these were accompanied by high levels of economic growth.
This research field has also been explored outside Europe. In the case of the American Midwest, one research group (Atack et al. Reference Atack, Baterman, Haines and Margo2010) had already entered the debate on the impact of the railway. They did this by focusing on two indicators of economic development: population density and the proportion of the population living in urban areas. They concluded that the arrival of the railway had had a great impact on urbanisation in the Midwest but that its influence on population density had been very small or even non-existent.
The European arena has therefore been the one most studied Felis-rota (Reference Felis-Rota2014). Previous research has shown that railways have had a relevant impact on population distribution in Europe. The country that we will study, Spain, offers one of the cases in which this approach is most feasible thanks to its relatively low rail density. Large areas of the country, including some cities, did not receive the influence of the railway and so their patterns of population growth could be compared with those of others that benefited from its influence over a relevant period: after they became part of a railway network (1900) and before the massive use of road transportation in Spain (1970).
The history of Spain’s railways has been studied in detail and is already well known. The most important contributions are those made by Wais (Reference Wais1974) and Artola (Reference Artola1978) and, more recently, Cuellar Villar (Reference Cuellar Villar2007) and Muñoz Rubio et al. (Reference Muñoz Rubio, Sanz Fernández and Vidal Olivares1999). As a result of these remarkable contributions, we now have a good overview of the history of the railway in Spain. Wais attributed Spain’s lack of industry to the relative lack of success of the country’s railways, whereas Miguel Artola examined the role of the Spanish state in the development of its railway network. According to him, the role played by the central administration was fundamental in the construction and configuration of the national railway network. Developments were initially limited to evaluating and approving the concessions requested by foreign capital — which was mainly French or British — as Spanish capital tended to be lacking or unavailable. He also focused on economic factors and most specifically on the failure to introduce sufficient infrastructure and investment into Spain’s economy, particularly during periods of recession. The sources of both the capital and raw materials used to construct the basic infrastructure were mainly foreign. As a result, the provision of this infrastructure had no significant repercussions for the industrialisation of the country.
Although there is relatively little available literature on the relationship between railways and population based on quantitative analysis, a number of authors have approached this question from the perspective of urbanisation (Barquín et al. Reference Barquín, Pérez and Sanz2012; Morillas-Torné et al. 2012) and economic history. For example, Herranz-Loncán (Reference Herranz-Loncán2006, Reference Herranz-Loncán2008) examined the role of the railway in the industrialisation of Spain and its effects on the national economy in the period prior to the Spanish Civil War. He showed that, among other factors, the population density and level of industrialisation of each region influenced the decision as to where to locate parts of the railway network within the national territory. However, once the main railway lines had been established, the existing regional disparities were exacerbated.
Finally, Santos (Reference Santos2007) carried out exhaustive research into the relationship between urbanism and railways from the perspective of architecture. In his work, Santos lamented the treatment given to the railway, which was largely seen as a barrier that had to be covered over. The author complained about the lack of importance given to the railway despite its role as a major driving force behind urban growth.
3. DATA AND METHODOLOGY
This study focuses on the combined analysis of the evolution of the railway network and of population distribution in Spain. To achieve this, we created a Historical GIS including both a railway database and information on total population at the municipal level for every census year. The information on railways includes the lines that were in service at the end of each decade from 1850 to 2000. For every line, we know the track gauge and whether it carried passenger or freight traffic. However, the current article focuses only on the Iberian gauge (1,668 mm); high speed (1,435 mm) and narrow gauge lines are not included in our analysis. The former is a relatively recent phenomenon that cannot be analysed adopting our historical perspective, while the latter is primarily devoted to local transport. The sources are mainly historical maps and texts from the map rooms of European universities and the archives of railway foundations. Examples of this type of data are the Thomas Cook Rail Map of Europe and Bartholomew’s map series, which were originally designed for tourists, but also offer a significant source of historical railway data (Morillas-Torné Reference Morillas-Torné2012).
On the other hand, the population database is based on the municipal scale. This provides official population data, presented decade by decade, taken from Spanish censuses from 1900 to 2001. The original database was obtained from the publication by Goerlich et al. (Reference Goerlich, Mas, Azagra and Chorén2006), whose work allows access to detailed data obtained from all of the censuses carried out in the 20th century. A useful aspect of these data is that they relate to homogeneous population data. The series takes the structure of the 2001 municipalities — which corresponds to the censuses available — as the main point of reference. This homogenisation allowed us to use directly comparable population data for the period between 1900 and 2001. This exercise is currently unique in the European context and offers a relevant way to obtain new results from spatiotemporal analysis based on GIS.
The first methodological step was to link these railway and population data. This was done based on the municipal reference for both databases and the respective coordinates. The final database contained information about the population of each municipality and its distance from the nearest railway line. We excluded municipalities in the Balearic Islands, Canary Isles and North African territories of Ceuta and Melilla from this final database as they are not part of the Iberian Peninsula and would have distorted the results obtained.
In order to quantify the impact of the railway on the distribution of population during the 20th century, we analysed population and its distance from the nearest railway connection at 10-year intervals. To do this, we compared municipalities that were considered to have connections to the railway network with those considered to lack them. We considered municipalities located at distances of 5 km or less from a railway line to be connected to the network. In earlier works (Mojica and Martí-Henneberg Reference Mojica and Martí-Henneberg2011), we showed that a distance of 2 km provided a good measure of connectivity in the case of urban agglomerations. In this study, however, we included all of the municipalities in Spain. After several trials using greater distances, we decided that, in this case, a distance of 5 km would give the most relevant results.
The main variable in this analysis was the cumulative annual growth rate. It was calculated for each intercensal period and used to measure population growth between two census dates. Working with population data for such a long period makes it very difficult to make a direct comparison of growth rates because of the enormous variations between one decade and the next. In order to carry out a comparative study and to assess the impact of the railway on the evolution of population, we calculated the 10th and 90th percentiles of the growth rate in each decade. We used the 10th and 90th percentiles as values to determine whether the growth rate for a particular decade was sufficiently low or high because they provide an indicator of the extreme intervals of this variable based on the variation of the growth rate in each decade. Based on these percentiles, we created a new variable for each decade, which classified the growth rate of the municipalities according to whether the value of their growth rates were below the 10th percentile, between the 10th and 90th percentiles, or above the 90th percentile. This classification facilitated our comparative study of railway data with those of population and allowed us to observe their interactions.
4. CHARACTERISTICS OF THE EVOLUTION OF THE RAILWAY NETWORK IN SPAIN AND THE CONNECTIVITY OF THE SPANISH MUNICIPALITIES, 1850-2000
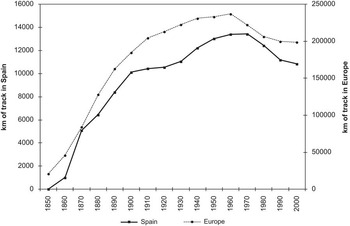
The evolution of Spain’s railway network has already been extensively examined, as we have seen in section 2. Here, it was necessary to add a European and comparative perspective to achieve an appropriate evaluation. Figure 1 offers this information; the parallel evolution between the total length of the Spanish railway network and that of the whole of Europe is strikingFootnote 4 . This similarity was particularly evident during the first period of expansion, up to 1900, when the advantages of rail travel became clearly apparent and were rapidly diffused with the support of a solid capacity for investment. From 1900 onwards, the process followed in Europe was one of slow expansion until 1960 and then one of contraction due to the priority given to road transport. Even so, this general tendency hides sizeable contrasts between countries. While the leaders — which included the United Kingdom, France and Belgium — experienced rapid initial expansion, the Nordic countries and those of Eastern Europe took over from them in the second phase, from 1900 onwards. Spain shares some of the characteristics of both groups. It initially experienced rapid growth during the first period (1860-1900), which was followed by relative stagnation coinciding with the maturity of the system (1900-1930). However, Spain presents its own peculiarity in the form of a second period of expansion (1940-1960) as a result of a policy of the Franco regime, which for the first 20 years (1939-1959) of its dictatorship was obsessed with only using its own resources, which in this case meant coal. Rail transport was nationalised and, from 1941 onwards, remained under the management of the state railway company, RENFE. The final period, from 1970 onwards, was marked by a scaling down of the railway network due to the priority given to road construction.
LENGTH OF RAILWAY TRACK IN KM. SPAIN AND EUROPE, 1850-2000
Source: calculated from HGISe database (www.europa.udl.cat).

This last change in transport policy was associated with the central theme of this section: the connectivity of the municipalities. The railway service connected specific points in the territory (stations) and, as a result, large areas were left outside its radius of influence. In contrast, the increase in automobile travel had the advantage of a capillary network that offered access to all of the inhabited areas and points of production. The car also had the advantage of offering greater flexibility and adjusting more easily to the needs of the user. As a result, the limitations of the connectivity of the municipalities via rail were intrinsic to this transport system as only stations are connected, not the whole territory. However, here we can delimit the period that was determinant for changes in personal mobility and developing strategies for the location of production. In Spain, the density of the rail network with respect to the national territory did not reach the same level as in other countries of a similar size. Even so, Spain is more similar to these other countries when we focus our comparisons on population and GDP (Table 1).
Again considering km/km2, Great Britain and France developed very dense networks that included almost all of their respective national populations. For our purpose — comparing areas with and without railway connections — the Spanish case is of greater interest than the others. Railway construction was more selective than elsewhere, leaving large areas — and even cities — without railway connections. The contrasts found in countries like Spain offer a great opportunity for analysis and, as in this paper, provide an opportunity to quantify the differences between nuclei with and without connections with respect to the evolution of their populations. The Spanish case has been analysed here, but this approach could also be extended to other countries. In classical literature, the impact of the railway on population has been a central question, but has remained largely unresolved as it has only been treated in general and qualitative terms. Here, we propose new ideas and instruments of analysis and present a new, dedicated database; as previously mentioned, we will look at this in more detail in the next section.
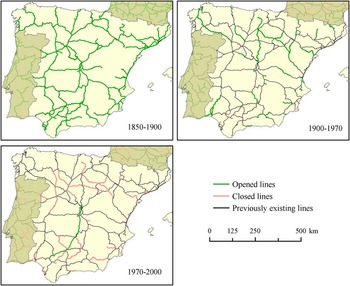
To provide a general context, in Figure 2, we present a series of three maps that reflect the processes of line opening and closure in each period. We can observe that in 1900 the network had practically reached its maturity. Between 1900 and 1970, only a few new lines were opened, with stretches of track that complemented the main ones. Finally, from 1970 onwards, there were some line closures in areas that were subject to increasing depopulation. The only line that opened during this period was the high-speed train connection between Madrid and Seville, in 1992.
EVOLUTION OF THE RAILWAY NETWORK IN SPAIN: 1850-2000
Source: Morillas-Torné et al., Reference Morillas-Torné, Franch, Martí-henneberg and GARCÍA2012. (Available in colour online)

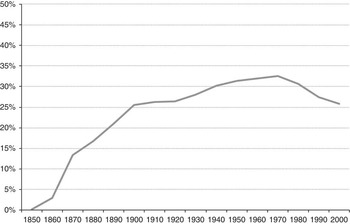
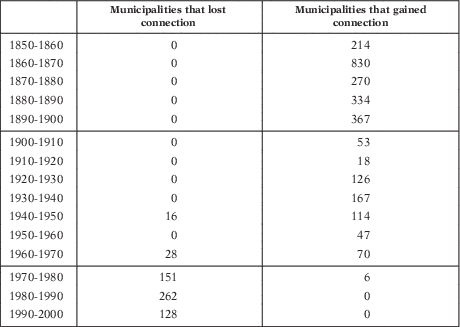
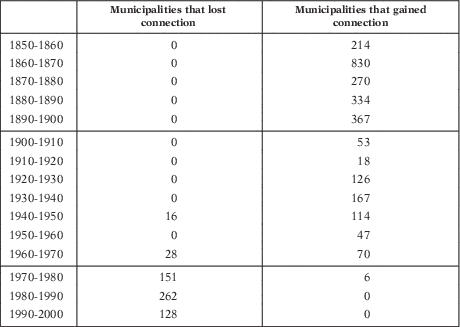
Figure 3 and Table 2 detail the evolution of the percentage of the municipalities connected to the railway network and the changes in their connectivity. It is interesting to stress that 1900-1970 was the most stable period, as it is only possible to detect a few new line openings corresponding to the period 1940-1960, due to the autarkic policy applied during this period. From 1970 onwards, a policy of line closure was carried out, based on economic viability, which logically affected the less-populated rural environment. From this moment onwards, priority was given to the connections between urban nuclei and their areas of influence. This explains why the investment effort subsequently focused on the high-speed train, whose Madrid-Seville section was inaugurated in 1992, and spread from then on.
EVOLUTION OF THE PERCENTAGE OF MUNICIPALITIES CONNECTED TO THE RAILWAY NETWORK. SPAIN, 1850-2000
Source: calculated from HGISe database.

CHANGES IN THE CONNECTIVITY OF MUNICIPALITIES TO THE RAILWAY NETWORK: SPAIN, 1850-2000
Source: calculated from HGISe database (census data).
5. THE EVOLUTION OF POPULATION AND CONNECTIVITY TO THE RAILWAY NETWORK
In this section, we will focus on the period 1900-2001 when our population data are comparable. The objective was to quantify the relationship between population growth by municipality related to whether or not it was well connected to the network.
As explained in the methodology section, this combined study of population growth and access to the railway network has been carried out based on a previous categorisation of the variables. These categories allowed us to identify those municipalities in which a very drastic change in population had taken place in a decade. We therefore created a variable that established whether a cumulative annual growth rate was below the 10th percentile or above the 90th percentile. These percentiles were calculated for each decade and made it possible to determine whether a municipality had experienced a marked change in population during a given decade. Another outstanding aspect was that the analysis for the period 1900-2001 corresponded, as we have already seen in the previous section, to a period in which the network had become consolidated and in which there were relatively few changes. We therefore focused our study on a relatively stable period in which the data analysis was very consistent.
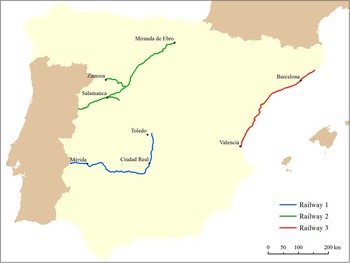
The results presented here appear in the following order. First, we analysed the evolution of population growth from the perspective of connections with the railway network at the overall level and taking all of the municipalities into consideration. We then focused our attention on three geographically differentiated railway lines. This will help to determine whether or not the influence of the railway on population dynamics differed from area to area. This was an analysis of three clearly different railway lines (Figure 4) with respect to both their geographic positions and types of population dynamics.
THE THREE RAILWAY LINES
Source: calculated from HGISe database. (Available in colour online)

Line 1 begins in the province of Toledo, without entering the provincial capital, and crosses Castilla-La Mancha from north to south and from east to west. It then reaches Extremadura, where it passes through its capital, Mérida, and runs on towards Portugal. Line 2 begins in Miranda de Ebro, a municipality in the railway corridor that follows the River Ebro (N-NE). This line crosses Castilla y León before reaching Portugal. As this is a straight line, we have also included two branches connecting to the cities of Zamora and Salamanca. Line 3 runs along the Mediterranean coast, connecting the coastal municipalities of Catalonia and Valencia.
These three railway lines cover a large area of territory. They were chosen because they were stable during the 20th century. This makes it possible to analyse total population dynamics and to observe the influence that the railway had in each decade throughout the study period. As we have already mentioned, the lines are located in very different territories. The type of population found in each of these areas is also different. The first two lines are located on the Meseta Sur and Meseta Norte plateaus, respectively. They are predominantly rural in character but have had different demographic evolutions. Line 2 runs through areas with low-density municipalities, which lost population over time. In contrast, and for historical reasons, the municipalities connected by line 1 tend to be much larger in size. Finally, line 3, which runs parallel to the Mediterranean coast, connects densely populated municipalities, which have also experienced constant population growth.
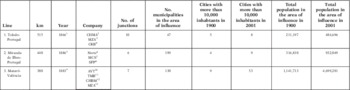
To proceed with the study of these three railway lines, we have adopted two criteria for classifying the municipalities included in the analysis. The first classification is analogous to the previous analyses that grouped together municipalities located <5 km from the railway network. These are municipalities that are well-connected to the railway network. We also selected those located between 5 and 50 km from these lines. In this way, for each line we analysed the evolution of population for connected municipalities and also for those considered not to be connected but which were located relatively close to the railway network. In this way, we sought to observe whether greater proximity to the railway network was associated with different patterns of population evolution. The total number of municipalities studied in this analysis of the three different lines was 2,703, which represented 34 per cent of all the municipalities in Spain (see details in Table 3). For line 1, there were 382 associated municipalities (47 of which were considered connected and 335 which were located between 5 and 50 km from the railway network). The corresponding numbers for line 2 were 1,488 (199 connected and 1,289 not connected) and for line 3 were 833 (130 and 703).
INFORMATION ABOUT THE THREE LINES ANALYSED RELATING TO THE CHARACTERISTICS OF THE INFRASTRUCTURE AND THE MUNICIPALITIES WITHIN THEIR AREAS OF INFLUENCE

1 1851: Toledo-Aranjuez, 1853: Aranjuez-Tembleque, 1854: Toledo-Alcázar, 1860: Alcázar-Ciudad-Real, 1864: Badajoz-Mérida y Ciudad Real-Puertollano, 1865: Mérida-Magacela y Almorchón-Puertollano; 1866: Magacela-Almorchón.
2 Toledo-Alcázar.
3 Alcázar-Ciudad Real.
4 Portugal-Ciudad Real.
5 Valladolid-Burgos: 1860, Burgos-Quintanapalla: 1861, Quintanapalla-Miranda de Ebro: 1862, Medina del Campo-Zamora: 1864, Medina del Campo-Cantalapiedra: 1875, Cantalapiedra-Salamanca: 1877, Salamanca-Portugal: 1886.
6 Medina del Campo-Miranda de Ebro, y Medina del Campo-Zamora.
7 Medina del Campo-Salamanca.
8 Salamanca-Portugal.
9 1848: Barcelona-Mataró, 1862: València-Castellón, 1863: Castellón-Benicàssim, 1865: Benicàssim-Ulldecona y Amposta-Tarragona-Sant Vicenç de Calders, 1867: Ulldecona-Amosta, 1881: Barcelona-Vilanova i la Geltrú, 1882: Vilanova i la Geltrú-Calafell, 1883: Calafell-Sant Vicenç de Calders.
10 Valencia-Tarragona.
11 Tarragona-Martorell.
12 Barcelona Mataró.
13 Barcelona-Sant Vicenç de Calders.
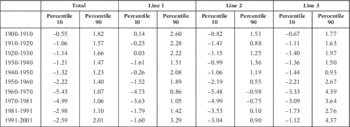
Table 4 shows the values of the 10th and 90th percentiles for the growth rate of all the municipalities and also for those located on the Meseta Sur (line 1), the Meseta Norte (line 2) and the Mediterranean coast (line 3). If we take all of the municipalities into account, we see that the values for the 90th percentile did not vary very much over the whole period. The values for the 10th percentile tended to decline with time, with the lowest values being registered in the decades 1960-1970 and 1970-1981. The values for the 90th percentile also generally declined over time, but in the last decade the value was higher than at the beginning of the study period. The calculation for the 10th and 90th percentiles of the municipalities located on the Meseta Sur, Meseta Norte and Mediterranean coast lines exhibited differences with respect to those for all the municipalities considered together.
Percentiles 10 and 90 of the growth rate

Source: calculated from HGISe database.
The municipalities located on the Meseta Norte (line 2) exhibited the lowest values for the 10th percentile of growth and their 90th percentile values were also lower than those obtained for municipalities located on the other two lines. It is therefore possible to affirm that in this northern area the municipalities that exhibited most growth still grew at a lower rate than those exhibiting the highest rates of growth in the southern (line 1) and coastal (line 3) areas. Furthermore, during the periods 1960-1970 and 1970-1981, the values for the 90th percentile for this area were negative. This was therefore an area which suffered a general loss of population. A study of the impact of the railway should therefore bear in mind that a positive impact in this area could have had a very different effect than in an area in which there were more significant changes in the growth rate. This was perhaps the case in the municipalities located along the Mediterranean coast (line 3), where there was a larger difference between the 10th and 90th percentile values, particularly from the decade 1950 to 1960 onwards. In fact, the municipalities that grew most in this area had growth rates that were greater than the overall general value for Spanish municipalities and also for those located near the other two lines. As we know, the Mediterranean seaboard is a part of Spain that experienced constant population growth from the mid-20th century onwards and where the resulting concentration of population produced the present urban areas. Finally, in the municipalities located in the vicinity of the line that ran across the Meseta Sur, the value of the 10th percentile was clearly the lowest over the study period. In contrast, the highest 90th percentile values corresponded to the first three decades and the final decade. It is therefore clear that the greatest growth of these municipalities took place at the beginning of the century. It should be added that the municipalities distributed around this line were located in an area characterised by marked rural-urban emigration. This mainly took place in Spain from the second half of the 20th century onwards and was a key factor in explaining the loss of population suffered by many of the rural municipalities located on the Meseta Sur. In this case, it would be interesting to see whether the railway was a factor that helped to limit this loss of population.
We shall now examine the results obtained from studying the evolution of the percentage of municipalities that were or were not connected to the railway network and see whether their growth rates were below the 10th percentile or above the 90th percentile. These results can be seen from the figure relating to all of the municipalities considered (Figure 5) and from those showing the municipalities located along line 1 (Figure 6), line 2 (Figure 7) and line 3 (Figure 8).
PERCENTAGE OF MUNICIPALITIES ACCORDING TO THEIR GROWTH RATE AND CONNECTIVITY TO THE RAILWAY NETWORK. SPAIN, 1900-2001
Source: calculated from HGISe database.

PERCENTAGE OF MUNICIPALITIES ACCORDING TO THEIR GROWTH RATE AND CONNECTIVITY TO THE RAILWAY NETWORK. LINE 1. SPAIN, 1900-2001
Source: calculated from HGISe database.

PERCENTAGE OF MUNICIPALITIES ACCORDING TO THEIR GROWTH RATE AND CONNECTIVITY TO THE RAILWAY NETWORK. LINE 2. SPAIN, 1900-2001
Source: calculated from HGISe database.

PERCENTAGE OF MUNICIPALITIES ACCORDING TO THEIR GROWTH RATE AND CONNECTIVITY TO THE RAILWAY NETWORK. LINE 3. SPAIN, 1900-2001
Source: calculated from HGISe database.

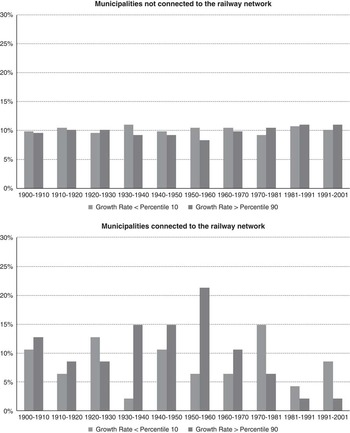
In the case of the total number of municipalities (Figure 5), we observed a constant difference between connected and unconnected municipalities. Throughout the 20th century, it is apparent that the percentage of municipalities connected to the railway network that experienced significantly high population growth was always greater than the percentage of those that lost population. The percentage of municipalities connected to the railway network that grew significantly had a slight tendency to increase. The greatest percentages were reached during the last three decades of the period (1950-1981) with values of around 19 and 20 per cent. In contrast, the percentage of connected municipalities suffering significant population losses fell from 8 to 5 per cent over the study period. In municipalities that were not connected to the railway network, the pattern was different. The difference between the percentage of municipalities with a high growth rate and the percentage with a low one was, however, less evident. In this case, there was temporal stability in the percentage of municipalities that lost population, which always remained at between 11 and 12 per cent. Furthermore, there was a gradual fall in the number of unconnected municipalities that exhibited significantly high growth rates. In other words, at the beginning of the century, the percentage of municipalities with high growth rates was about 9 per cent and this then descended from the decade 1950-1960 onwards until it reached a minimum of 5 per cent in the decades 1960-1970 and 1970-1981. It is worth mentioning at this point that this tendency coincided with a period characterised by a significant increase in the level of internal migration; this was a period that produced great flows of emigrants from the country to the cities. To summarise, the analysis of the population growth of Spain’s municipalities in relation to their connectivity with the railway network shows that proximity to the railway network could be considered a decisive factor for population growth from the beginning of the 20th century onwards. Furthermore, the differences were most significant during the period 1950-1981 because these were the decades in which the connected municipalities tended to grow most and the unconnected ones showed the greatest tendency to lose population.
The following results focus on the cases of the previously mentioned lines located on the Meseta Sur (line 1), on the Meseta Norte (line 2) and along the Mediterranean coast (line 3). We shall now examine whether the general conclusions are equally applicable to more specific and contrasted geographical areas. Figures 6, 7 and 8 summarise the results of our analysis of the growth of municipalities located along the three chosen stretches of track. As in the global analysis of municipalities, the figures show the evolution of the percentage of municipalities with and without connections to the railway network in relation to whether their respective growth rates were below the 10th percentile or above the 90th percentile. One of the first things to note is that clearly different tendencies can be observed in each of the three areas.
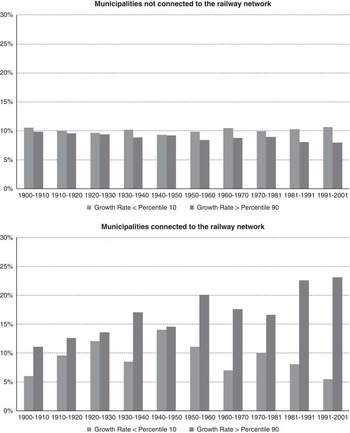
In this case, the municipalities grouped around the lines running across the Meseta Sur (Figure 6) and on the Meseta Norte (Figure 7) reflect a similar pattern to the percentages for the municipalities without connections to the railway network. In these municipalities, it is not possible to observe any noticeable differences between the proportion of municipalities that lost population and those that experienced significant growth. Their values always oscillated between 8 and 11 per cent. Not having access to the railway network did not, therefore, seem to have any important repercussions for population growth. On the other hand, our analysis of the municipalities connected to the railway network showed that, in this case, there was a clear difference between the lines on the Meseta Sur and Meseta Norte. On the former, the railway effect was more evident in the three decades from 1930 to 1960. During this period, it is possible to observe how the municipalities connected to the railway network showed a greater tendency to maintain positive growth rates. Even so, from the decade 1970-1981 onwards, a greater proportion of municipalities exhibited negative growth rates. The behaviour exhibited by the municipalities connected to the railway network on the Meseta Norte was, however, much clearer. This leads us to the conclusion that since the very first decade studied, a larger proportion of the connected municipalities showed significant population growth. This tendency is even more evident from the decade 1950-1960 onwards. Thus, by the end of the 20th century, 23 per cent of the municipalities that were located closest to this line gained population, while only 5 per cent of them suffered significant population losses. It is important to underline that in the north of Spain it can therefore be confirmed that proximity to a railway line was a decisive factor in population growth. This was, in fact, a positive effect that became increasingly more evident from the decade 1950-1960 onwards. In contrast, in the south of Spain, the railway did not have such a constantly positive effect on the growth rates of municipalities because from the 1970s onwards, proximity to the railway network was not positively reflected in terms of population growth.
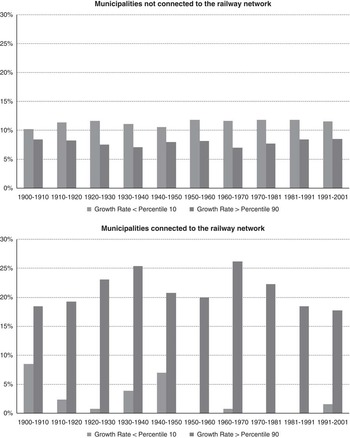
As previously stated, the Mediterranean coast is the area, which produced the greatest growth and concentration of population in Spain. An analysis of the municipalities relating to their proximity to one of the main railway lines that run along the coast would help us to determine contrasts between the municipalities that were connected to the railway network and those that were not (Figure 8). In this area, we observed that the differences between connected and unconnected municipalities were greater than in the other two areas. In fact, in the municipalities that were very close to the railway network, the percentage with significantly high growth rates remained relatively stable, above 18 per cent, throughout the century. Although this tendency oscillated over time and there was a fall in the middle of the century followed by a subsequent recovery, the general propensity for population growth is clearly evident. This is also confirmed by the fact that from the decade 1950-1960 onwards, the percentage of municipalities connected to the railway network that lost population was <2 per cent. In contrast, the municipalities that were far from the railway network exhibited a different behaviour; here, the percentage of municipalities that suffered significant population losses was always greater than that of those with high growth rates. Even so, it should be underlined that this difference did not show any signs of increasing over time. In fact, during the study period, about 12 per cent of the municipalities that lacked a railway connection suffered significant losses of population while fewer than 8.5 per cent clearly grew. In summary, it was clear that along the Mediterranean coast the railway had both positive and negative effects. Unlike the situation in the other two areas, along the Mediterranean coast, municipalities without railway connections showed a greater propensity to lose population. As we have seen, this was not so clearly confirmed on the Meseta Norte and Meseta Sur, where the differences between municipalities that were not connected to the railway network were smaller. Along the Mediterranean coast, having a connection to the railway network was a factor that clearly and positively affected population growth because the percentage of municipalities connected to the railway network, which significantly lost population was very low: generally <5 per cent. In contrast, the percentage of municipalities that grew was very high in comparison with those that lacked a connection to the railway network.
6. CONCLUSIONS
In this work, we have studied the influence of railways on the evolution and distribution of population in Spain during the period 1850 till the present. During this period, it is possible to differentiate three stages of development and growth in the railway network. The majority of the railway network was constructed during the period from 1850 to 1900, with the maximum length of track in service reaching 10,000 km. The period 1900-1970 was a stable phase during which the growth of the network was slow and sustained. While from 1970 to 2001, the less profitable conventional lines began to close and high-speed lines were constructed, with the result of some municipalities losing their connections to the railway network. Another step of this study consisted of determining whether there were any differences in the patterns of growth and population concentration related to access to the railway network. The period of analysis in this case was 1900-2001, due to the availability of population census data. The association of population data and the consideration of the distance of each municipality from the railway network made it possible to differentiate between the population with access to the railway network and that without such access.
Among the most important results obtained, we confirmed that — within a context of generalised growth during the first decades of the study period and its subsequent reduction — the municipalities that were not connected to the railway network exhibited different behaviour from those that were. In the case of the municipalities without railway connections, we always observed a greater proportion of municipalities that lost population than of those with significantly high rates of growth. On the other hand, the majority of the municipalities that were connected to the network gained population. During the decade 1950-1960, it was possible to observe a change with the proportion of municipalities connected to the railway network that significantly increased their population being much greater than that of those that lost population.
Finally, this work proposes a detailed analysis of three specific cases corresponding to railway lines that have exhibited great stability and whose geographic situations were different. In each of these areas, there was also a specific evolution of population with respect to the others. This has allowed us to show that the influence of the railway has differed according to the characteristics of the local geography and population. In the case of one of the lines studied, which runs close to the coast, it was observed that municipalities connected to the railway network throughout the century exhibited a significant population growth.
Moreover, along line number 3, the municipalities that were not connected to the railway network exhibited a greater propensity to lose population than for population growth. In contrast, along the other two lines, not having access to the railway network did not have a clearly negative effect on the growth of municipalities. Furthermore, along these lines, proximity to the railway network did not always constitute an advantage and result in greater growth. In fact, the railway may only have had a positive influence on growth in the case of the line crossing the Meseta Norte, but only from the year 1950 onwards. The differences between lines 1 and 2, on the one hand, and line 3, on the other, are explained by contrasts in economic dynamism: lines 1 and 2 cross areas that have maintained their links with agricultural activity and which have undergone relatively little industrialisation. For this reason, although the Meseta Norte and Meseta Sur suffered losses of population, these were smaller in areas nearer to railway services. In contrast, line 3 runs along a coastal area that benefited from the «litoralisation» of the population, has less industry and developed tertiary sector activities, such as tourism. The dynamising capacity of the railway has therefore been very different in the two cases.
For future work, we will need to look more deeply into this type of research, with the help of data not currently available. For example, the opportunity to integrate into the GIS the railway stations with their geographic locations and their corresponding years of opening and closure. This would help to provide a new and more precise vision of this innovative, new phenomenon that we have started to study and present results on. In this sense, statistical analysis undertaken from a territorial perspective offers a good way of exploiting data created with the help of GIS. This proposal outlines one of the ways in which to proceed. It could be applied to other countries that have homogeneous population series available and be combined with railway data.