Implications
Amino acid (AA) receptors and transporters have an important influence on the absorption and utilization of AA not only for humans but also for animals. Adequate and balanced AA supply is important for the health, growth and production of livestock. Guanine nucleotide-binding protein α-transducing 3 (GNAT3), lysophosphatidic acid receptor 5 (LPAR5) and AA transporters are functioning in the digestive tracts, organs and muscles, and some of them cooperated with each other. The results illustrated that the abomasum, duodenum or jejunum; the pancreas; and the tibialis posterior should be the key positions for future AA nutrition research in ruminants. Furthermore, we could apply rumen-protect AA and rational design of feed formula to get optimum utilization of AA.
Introduction
Absorbed available AA are essential as the structural elements for protein synthesis of tissue and organs in ruminants. Therefore, the efficiency of AA absorption and transport in the gastrointestinal tracts (GIT) and metabolic organs/tissues is very important for maintaining the normal physiological function and for improving the performance of ruminants.
In general, absorption and transport of AA are associated with their sensing receptors and transporters. It is well-known that LPAR5 is one of the G protein-coupled transmembrane lysophosphatidic acid (LPA) receptors mediating intracellular responses to LPA and has diverse biological functions, related to cell proliferation, morphogenesis, differentiation and protection from apoptosis and is involved in protein hydrolysate and mediates the intracellular responses to LPA (Araki et al., Reference Araki, Kitayoshi, Dong, Hirane, Ozaki, Mori, Fukushima, Honoki and Tsujiuchi2014). The LPAR5 can couple with Gα 12/13 and increases intracellular calcium levels by the activation of Gαq. In addition, LPA can increase cyclic adenosine monophosphate levels and inositol phosphate production in LPAR5-expressing cells (Choi et al., Reference Choi, Herr, Noguchi, Yung, Lee, Mutoh, Lin, Teo, Park, Mosley and Chun2010). Reportedly, LPA can induce the expression of connective tissue growth factor (Heusinger-Ribeiro et al., Reference Heusinger-Ribeiro, Eberlein, Wahab and Goppelt-Struebe2001), which is an important factor linked to fibroproliferative disorders, and may play a role in liver fibrosis or the proliferation of stellate cell and hepatocytes (Ikeda et al., Reference Ikeda, Yatomi, Yanase, Satoh, Nishihara, Kawabata and Fujiwara1998), and LPA is associated with the skeletal muscle triglyceride metabolism (Watt, Reference Watt2009). Likewise, according to LPAR1-4 studies, we speculate that LPAR5 may be involved in kidney fibrosis (Pradère et al., Reference Pradère, Klein, Grès, Guigné, Neau, Valet, Calise, Chun, Bascands, Saulnier-Blache and Schanstra2007). Calcium, cyclic adenosine monophosphate and inositol phosphate are involved in intracellular AA sensing. Meanwhile, it has been reported that GNAT3 is one of the G protein α subunits and can encode gustducin, playing pivotal roles in mediating gustatory signal transduction, especially l-AA (umami) taste signal transduction, and acting as an AA downstream signal transduction molecule (Sutherland et al., Reference Sutherland, Young, Cooper, Horowitz and Blackshaw2007).
On the other hand, a multitude of AA transporters in particular are crucial for the transport of AA. Although AA transport systems of mammalian cells have been divided into anionic-, neutral- and cationic-AA transporters (Palacín et al., Reference Palacín, Estévez, Bertran and Zorzano1998), most are associated with solute carrier (SLC) family members. In addition, these AA transporters in the plasma membrane have the ability to sense AA levels, and behave both directly as initiators of AA signalling, a function similar to AA receptors, and indirectly as regulators of external AA access to intracellular receptor or signalling transduction.
Over the past decades, AA sensing and transport in mammals have been widely studied, mostly focusing on monogastric animals and humans (Broer et al., Reference Broer, Klingel, Kowalczuk, Rasko, Cavanaugh and Broer2004; Sutherland et al., Reference Sutherland, Young, Cooper, Horowitz and Blackshaw2007; Nguyen et al., Reference Nguyen, Akiba and Kaunitz2012). However, limited information is available on the tissue distribution and localization, and relevant molecular mechanisms of AA sensing receptors and transporters in ruminants. This study was thereby conducted to investigate the messenger RNA (mRNA) expression patterns of partial AA transporters and sensing receptors in different digestive segments and important metabolic organs/tissues using goats as an experimental animal model. Through this study, we expected to determine the distribution characteristics of vital AA transporters and sensing receptors along the GIT and in different organs/tissues of growing goats, and we aimed to provide valuable information for the improvement of AA nutrition and LPA manipulation in ruminants.
Material and methods
Experimental animals, feeding and management
Five Liuyang black wether goats (a local breed in South China), 3-months-old, with initial BW of 19±3.1 kg, were housed individually, offered the same diet, fed ad libitum. The trial lasted 14 days in total and the diet was formulated according to Zhang (Reference Zhang2010). Ingredients and nutrients composition of the experimental diets are shown in Table 1.
Ingredients and nutrient composition of the experimental diet in goats

ME=metabolic energy; CP=crude protein; ADF=acid detergent fiber; NDF=neutral detergent fiber; Ca=calcium; P=phosphorus.
1 Contained per kilogram: 119 g of MgSO4·H2O, 1.53 g of FeSO4·H2O, 0.8 g of CuSO4·5H2O, 3 g of MnSO4·H2O, 5 g of ZnSO4·H2O, 10 mg of Na2SeO3, 40 mg of KI, 30 mg of CoCl2·6H2O, 95000 IU of vitamin A, 17500 IU of vitamin D and 18000 IU of vitamin E.
Sampling
Five goats were anaesthetized using an intravenous injection of sodium pentobarbital (50 mg/kg BW) and exsanguinated via the severing of the carotid artery. To avoid any contamination, the visceral cavity was open and the GIT and other organs were immediately removed. The standard positions of each segment of GIT were then cleared. The duodenal colonic ligament is connected by a short serosal fold between the duodenum and the descending colon, which is the beginning of the jejunum. The ileocaecal ligament is between the jejunum and the caecum, which is the boundary between the jejunum and the ileum. The ileocaecal ostium is the boundary between the ileum and the caecum, and is also the boundary between the caecum and the colon. Tissue samples of 2×2 cm from the rumen anterior abdominal sac, the bottom of abomasum, the middle parts of the duodenum, the jejunum, the ileum, the caecum and the colon, the kidney, the liver, the pancreas, the longissimus dorsi and the tibialis posterior were collected from corresponding sites. All samples were rinsed with ice-cold saline (0.9% sodium chloride solution), then were wrapped with sterilized tinfoil and frozen in liquid nitrogen and stored at −80°C until RNA extraction.
RNA extraction and complementary DNA preparation
Total RNA was extracted using RNAiso Plus (TaKaRa 9108/9109, Dalian, China) following the manufacturer’s instructions. The RNA quality and quantity were determined using a NanoDrop 2000 (Thermo Scientific, Waltham, MA, USA). In addition, the integrity of extracted RNA was analysed with agarose gel electrophoresis; then, a total of 1 µg of RNA was reverse-transcribed into complementary DNA using the PrimeScriptTM RT Reagent Kit with gDNA Eraser (TaKaRa, RR047A) following the manufacturer’s instructions. The prepared cDNA samples were stored at −20°C until subsequent quantitative real-time PCR analysis.
Quantitative real-time PCR analysis
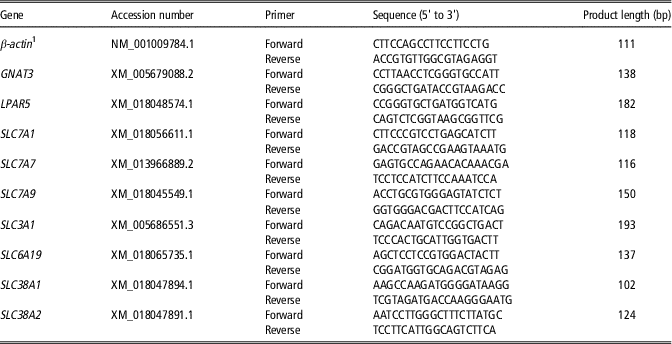
Quantitative real-time PCR was used to evaluate the relative mRNA expression of LPAR5, GNAT3, SLC7A1 (SLC family 7 member 1), SLC7A7 (SLC family 7 member 7), SLC7A9 (SLC family 7 member 9), SLC3A1 (SLC family 3 member 1), SLC6A19 (SLC family 6 member 19), SLC38A1 (SLC family 38 member 1) and SLC38A2 (SLC family 38 member 2). β-actin was selected as a housekeeping gene to normalize target gene transcript levels, which is usually used in GIT, organs and muscles (Borsani et al., Reference Borsani, Bassi, Sperandeo, De, Buoninconti, Riboni, Manzoni, Incerti, Pepe, Andria, Ballabio and Sebastio1999; Ran et al., Reference Ran, Li, Liu, Zhou, Tang, Han, Wang, He, Kang, Yan, Tan and Beauchemin2016; Naicy et al., Reference Naicy, Venkatachalapathy, Siju, Aravindakshan, Kurian, Jose, Bosewell and Silpa2017) and its expression did not differ within GIT, organs and muscles. Primers were designed using Primer Premier 5 and the on line tool Primer 3 (https://www.ncbi.nlm.nih.gov/tools/primer-blast/) based on gene sequences of Capra hircus reported online in GenBank. All primers were synthesized by Sangon Biotech (Shanghai, China), and primer sequences are listed in Table 2. The quantitative real-time PCR was performed on anABI-7900HT qPCR system (Applied Biosystems, Foster City, CA, USA) using SYBR® Premix Ex Taq II (Tli RNaseH Plus) (TaKaRa, RR820A). Quantification of the PCR products of all the genes of interest was evaluated in comparison with the PCR products of β-actin. The relative changes in mRNA expression levels were calculated according to the 2−ΔΔCT method, where ΔΔCT=ΔCTother tissue samples − ΔCTcontrol sample and ΔCT=CTsamples−CT β-actin (Livak and Schmittgen, Reference Livak and Schmittgen2001). Then, data were transformed to be shown as ln(2−ΔΔCT).
Details of primers used for quantitative real-time PCR in goats

GNAT3=guanine nucleotide-binding protein α-transducing 3; LPAR5=lysophosphatidic acid receptor 5; SLC7A1= solute carrier family 7 member 1; SLC7A7=solute carrier family 7 member 7; SLC7A9=solute carrier family 7 member 9; SLC3A1= solute carrier family 3 member 1; SLC6A19=solute carrier family 6 member 19; SLC38A1=solute carrier family 38 member 1; SLC38A2=solute carrier family 38 member 2.
1 The primer sequence of β-actin was come from Ran et al. (Reference Ran, Li, Liu, Zhou, Tang, Han, Wang, He, Kang, Yan, Tan and Beauchemin2016).
Statistical analysis
SPSS (Statistical Product and Service Solutions) 20.0 (SPSS Inc., Chicago, IL, USA) software was used for statistical analysis. Gene mRNA expression data were ln transformed and normalized on median expression levels, and data were analysed by one-way ANOVA followed by the Duncan multiple comparison test. Afterwards, the Pearson correlation coefficients (r) among all determined genes and statistical significance were obtained by regression analysis using SPSS 20.0 software. Samples from all tissues or organs were included for the correlation analysis. Statistical significance was declared as P≤0.05.
Results
Relative messenger RNA expression of guanine nucleotide-binding protein α-transducing 3
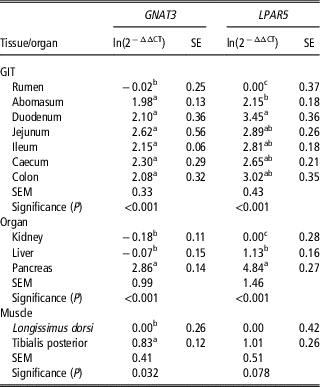
In the GIT section, the highest expression occurred in the jejunum for GNAT3, its lowest expression was observed in the rumen (Table 3). In the organ section, the relative mRNA expression of GNAT3 in the pancreas was higher (P<0.05) than that in the kidney and liver, but there was no difference in the GNAT3 expression between the liver and kidney. In the muscle section, the GNAT3 expression in the tibialis posterior was higher (P<0.05) than that of the longissimus dorsi.
The relative messenger RNA expression of lysophosphatidic acid receptor 5 (LPAR5) and guanine nucleotide-binding protein α-transducing 3 (GNAT3) in various tissues/organs of growing goats

GIT=gastrointestinal tracts; CP=crude protein; ADF=acid detergent fiber; NDF=neutral detergent fiber; Ca=calcium; P=phosphorus.
The control samples are the rumen for the GIT section, the kidney for the organ section and the longissimus dorsi for the muscle section.
SE represents the standard error of ln(2−△△CT).
a,b,cMeans in the same column within the GIT, organ or muscle section with different superscripts differ significantly (P<0.05).
Significance (P) represents the P-value for means within the GIT, organ or muscle section.
Relative messenger RNA expression of lysophosphatidic acid receptor 5
In the GIT section, the expression of LPAR5 in the rumen was lower (P<0.001) than that in other segments, and its expression in the duodenum was higher (P<0.05) than that in the abomasum (Table 3). There were no significant differences in the LPAR5 expression among various intestinal segments (i.e. jejunum, ileum, caecum and colon). In the organ section, significant higher expression of LPAR5 (P<0.05) was detected in pancreas followed by liver and kidney. In the muscle section, the LPAR5 mRNA expression in the tibialis posterior tended to be higher (P=0.078) than that in the longissimus dorsi.
Relative messenger RNA expression of Na+-dependent amino acid transporters
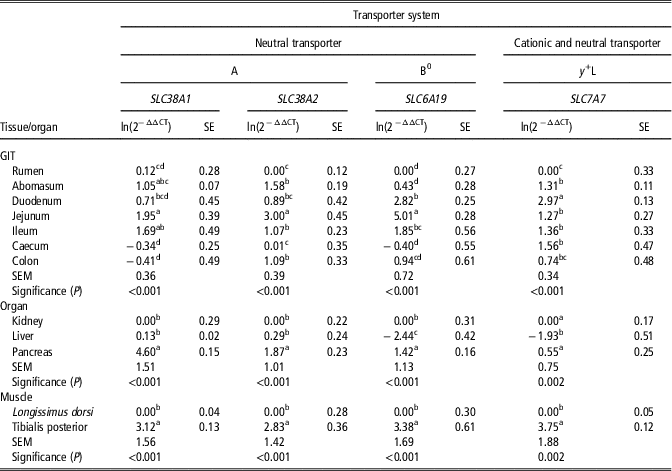
In the GIT section, the neutral AA transporters, including SLC38A1, SLC38A2 and SLC6A19, had the highest mRNA expression observed in the jejunum (Table 4). The mRNA expression levels of SLC38A1 in the jejunum, ileum and abomasum were higher (P<0.05) than that in the rumen, caecum and colon. For SLC38A2, the jejunum had higher expression (P<0.05) than that in other segments. For SLC6A19, its mRNA expression in the jejunum was greater (P<0.05) than that in the other segments. In the organ section, the relative mRNA expression of SLC38A1, SLC38A2 and SLC6A19 in the pancreas were higher (P<0.05) than that in the kidney and liver. No differences in the expression of SLC38A1 and SLC38A2 were found between the kidney and liver. For the muscle section, the relative mRNA expression levels of SLC38A1, SLC38A2 and SLC6A19 in the tibialis posterior were all higher (P<0.001) than that in the longissimus dorsi.
The relative messenger RNA expression of Na+-dependent amino acid transporters in various tissues/organs of growing goats

GIT=gastrointestinal tracts; SLC38A1=solute carrier family 38 member 1; SLC38A2=solute carrier family 38 member 2; SLC6A19=solute carrier family 6 member 19; SLC7A7=solute carrier family 7 member 7.
The control samples are the rumen for the GIT section, the kidney for the organ section and the longissimus dorsi for the muscle section.
SE represents the standard error of ln(2−ΔΔCT).
a,b,c,dMeans in the same column within the GIT, organ or muscle section with different superscripts differ significantly (P<0.05).
Significance (P) represents P-value for means within the GIT, organ or muscle section.
In the GIT section, the cationic and neutral AA transporter SLC7A7 was highly expressed in the duodenum (P<0.05) than that in other segments, but its mRNA expression in the rumen was lower (P<0.05) than that in other segments. In the organ section, there were differences (P=0.002) in the mRNA expression levels of SLC7A7 among the pancreas, kidney and liver, with the lowest expression in the liver. In the muscle section, the SLC7A7 expression in the tibialis posterior was higher (P<0.001) than that in the longissimus dorsi.
Relative messenger RNA expression of Na+-independent amino acid transporters
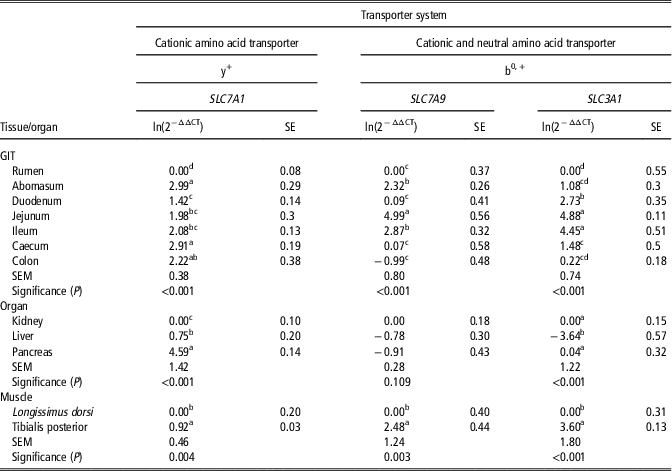
In the GIT section, SLC7A1 had higher (P<0.05) relative mRNA expression in the abomasum and caecum than that in other segments, except the colon, and its expression in the rumen was lower (P<0.05) than that in other segments (Table 5). In the organ section, there were differences (P<0.001) in the SLC7A1 mRNA expression among the pancreas, liver and kidney, with the highest expression in the pancreas. In the muscle section, SLC7A1 expression in the tibialis posterior was higher (P=0.004) than that in the longissimus dorsi.
The relative messenger RNA expression of Na+-independent amino acid transporters in various tissues/organs of growing goats

GIT=gastrointestinal tracts; SLC7A1= solute carrier family 7 member 1; SLC7A9=solute carrier family 7 member 9; SLC3A1= solute carrier family 3 member 1.
a,b,c,dMeans in the same column within the GIT, organ or muscle section with different superscripts differ significantly (P<0.05).
In the GIT section, the highest and lowest expression levels of SLC7A9 were observed in the jejunum and colon, respectively. Simultaneously, the greatest expression of SLC3A1 was noted in the jejunum and ileum, which had higher expression levels (P<0.05) than that in other segments. In the organ section, there were no differences in the mRNA expression of SLC7A9, whilst the expression of SLC3A1 in the liver was lower (P<0.05) than that in the kidney and pancreas. In the muscle section, the expression levels of SLC7A9 (P=0.003) and SLC3A1 (P<0.001) in the tibialis posterior were greater than that in the longissimus dorsi.
Correlation analysis
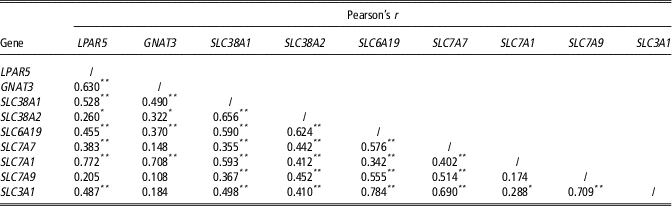
The correlation coefficients between all determined genes are listed in Table 6. GNAT3 showed stronger correlations with SLC7A1 (P<0.01) and LPAR5 (P<0.01) than SLC38A1 (P<0.01), SLC38A2 (P<0.05) and SLC6A19 (P<0.01), while no correlations (P>0.05) between GNAT3 and SLC7A7, SLC7A9 or SLC3A1 were observed. LPAR5 showed stronger correlations with SLC7A1, SLC38A1 and SLC3A1 (P<0.01) than to SLC6A19 (P<0.01), SLC7A7 (P<0.01) and SLC38A2 (P<0.05). LPAR5 showed no correlations with SLC7A9 (P>0.05). Among AA transporters, there were positive correlations among each other except between SLC7A1 and SLC7A9 (P>0.05). SLC38A1 showed the strongest correlation (P<0.01) with SLC38A2 compared with other AA transporters. SLC38A2 showed correlation (P<0.01) with SLC6A19 and similar correlations with SLC7A7, SLC7A1, SLC7A9 and SLC3A1. The correlation between SLC6A19 and SLC7A1 was quite small (r=0.342, P<0.01), but the correlation between SLC6A19 and SLC3A1 was the greatest (r=0.784, P<0.01). SLC7A7 had stronger correlations with SLC3A1, SLC6A19 and SLC7A9 (r>0.5, P<0.01). SLC7A1 had weak correlations with SLC3A1 (r=0.288, P<0.05) and SLC7A9 (r=0.174, P>0.05). We found high association between SLC7A9 and SLC3A1 (r=0.709, P<0.01).
Correlation analysis of LPAR5, GNAT3 and amino acid transporters expression at messenger RNA level in goats (n=60)

GNAT3=guanine nucleotide-binding protein α-transducing 3; LPAR5=lysophosphatidic acid receptor 5; SLC7A1= solute carrier family 7 member 1; SLC7A7=solute carrier family 7 member 7; SLC7A9=solute carrier family 7 member 9; SLC3A1= solute carrier family 3 member 1; SLC6A19=solute carrier family 6 member 19; SLC38A1=solute carrier family 38 member 1; SLC38A2=solute carrier family 38 member 2.
Pearson’s r is the correlation coefficient.
*P-value<0.05; **P-value<0.01.
Discussion
GNAT3 is the gene of α-gustducin (Gα-gust) and a key signal molecule in taste and nutrient detection and present in some ectopic regions, such as human and mouse airways, brain, intestinal mucosa, the retinas of the mouse, rat and rabbit, and in the GIT of sheep and cattle (Sutherland et al., Reference Sutherland, Young, Cooper, Horowitz and Blackshaw2007; Son et al., Reference Son, Hu, Kim, Chun, Kim and Kim2011; Moran et al., Reference Moran, Alrammahi, Zhang, Bravo, Calsamiglia and Shirazibeechey2014). In this study, we found that GNAT3 was highly expressed in the abomasum and small intestine, except the rumen, of ruminants. Relatively low mRNA expression of GNAT3 in the liver and kidney were observed when compared with the pancreas. In contrast, the protein of Gα-gust is detected in the mouse renal corpuscle and renal tubules (Liu et al., Reference Liu, Gu, Jiang, Chen and Li2015); this might be due to the difference between species or samples analysed because we did not collect the same samples of growing goats. We found high mRNA expression of GNAT3 in the pancreas, and there may exist potential and indirect relationships between them. In addition, we first noted the higher mRNA expression of GNAT3 in the tibialis posterior when compared with the longissimus dorsi.
AA transporters are usually classified as the systems A, B0, y+L, y+ and b0,+. Systems A includes SLC38A1 and SLC38A2. SLC6A19 belongs to system B0. SLC7A7 belongs to system y+L. SLC7A1 is a member of system y+. SLC7A9 and SLC3A1 belong to system b0,+. GNAT3 had stronger correlations with SLC7A1 and LPAR5 than with SLC38A1, SLC38A2 and SLC6A19, but did not display any correlations with SLC7A7, SLC7A9 or SLC3A1, which meant that GNAT3 had no effect on the transport of the systems y+L and b0,+. These suggested that GNAT3 might have a part in the pathway of recognition of LPA, AA of the systems A, B0 and y+ and signal transduction.
LPAR5 can activate G protein (Kanehira et al., Reference Kanehira, Kikuchi, Ohkouchi, Shibahara, Tode, Santoso, Daito, Ohta, Tamada and Nukiwa2012) and have many biological functions. LPAR5 is first identified in the enterocytes of rats, and highly expressed in the intestinal mucosal layer, especially in the duodenum (Choi et al., Reference Choi, Lee, Shiu, Yo and Aponte2007). This agreed with the current finding, wherein we observed the highest mRNA expression of LPAR5 in the duodenum, the abomasum and the other intestinal segments as well, which meant that LPAR5 sensing mainly occurred in the abomasum and intestinal tract but not in the rumen in ruminants. Besides GIT tissues, LPAR5 is broadly expressed in other tissues/organs such as the spleen, thymus, lung, heart and liver in murine animals (Choi et al., Reference Choi, Herr, Noguchi, Yung, Lee, Mutoh, Lin, Teo, Park, Mosley and Chun2010). In this study, the mRNA expression of LPAR5 in the liver was higher compared with the kidney, which was consistent with the previous findings in mice and humans at the transcriptional level (Choi et al., Reference Choi, Herr, Noguchi, Yung, Lee, Mutoh, Lin, Teo, Park, Mosley and Chun2010). We noticed the greatest mRNA expression of LPAR5 in the pancreas when compared with the kidney and liver, and although there was no available information about LPAR5 in the pancreas of mice and humans, we speculated that the AA sensing in the pancreas was more sensitive relative to the kidney and liver. In this study, we first observed that the mRNA expression levels of LPAR5 were relatively low in both muscle tissues. The low mRNA expression of LPAR5 in the tibialis posterior and longissimus dorsi probably implied that LPAR5 was not the key factor of AA sensing in skeletal muscles of ruminants. There were various positive correlations between LPAR5 and AA transporters except SLC7A9, which meant that there were close links between LPAR5 and AA transporters.
System A is present in almost all cell types and mediates the symport of neutral AA with small side chains with sodium (Bussolati et al., Reference Bussolati, Dall’Asta, Franchi-Gazzola, Sala, Rotoli, Visigalli, Casado, Lopez-Fontanals, Pastor-Anglada and Gazzola2001). In rats, SLC38A1 is lowly expressed in the colon (Varoqui et al., Reference Varoqui, Zhu, Yao, Ming and Erickson2000). In humans, SLC38A1 was discovered in the placenta, heart, brain, lung, skeletal muscle, spleen, stomach and testis, and the mRNA expression of SLC38A1 is low in the colon, small intestine, kidney and liver (Wang et al., Reference Wang, Huang, Sugawara, Devoe, Leibach, Prasad and Prasada2000). SLC38A2 is ubiquitous in rats and humans (Bussolati et al., Reference Bussolati, Dall’Asta, Franchi-Gazzola, Sala, Rotoli, Visigalli, Casado, Lopez-Fontanals, Pastor-Anglada and Gazzola2001). Obviously, the similar mRNA expression pattern of SLC38A1 and SLC38A2 were noted in the GIT, metabolic organs and muscle tissues of growing goats, and the strongest mRNA expression occurred in the jejunum, pancreas and tibialis posterior when compared with other GIT segments, kidney or liver, and longissimus dorsi. SLC38A1 showed the strongest correlation with SLC38A2 compared with others, which was reasonable because both of them belong to the same transport system – system A. SLC38A1 preferred to have close relationships with transporters of system y+ and B0 to b0,+ and y+L. SLC38A2 showed a stronger correlation with SLC6A19, which was just a reflection of co-transporting neutral AA.
System B0 is responsible for the transport of most neutral AA. SLC6A19 is found in intestine and kidney cells, and skin in mice, and observed in rat renal tissues, where it exerts key functions for AA (re)absorption (Broer et al., Reference Broer, Klingel, Kowalczuk, Rasko, Cavanaugh and Broer2004; Pinho and Soares-da-Silva, Reference Pinho and Soares-da-Silva2006; Vuille-Dit-Bille et al., Reference Vuille-Dit-Bille, Camargo, Emmenegger, Sasse, Kummer, Jando, Hamie, Meier, Hunziker, Forras-Kaufmann, Kuyumcu, Fox, Schwizer, Fried, Lindenmeyer, Gotze and Verrey2015). In humans, the mRNA expression of SLC6A19 in the small intestine is greater than that in the large intestine (Vuille-Dit-Bille et al., Reference Vuille-Dit-Bille, Camargo, Emmenegger, Sasse, Kummer, Jando, Hamie, Meier, Hunziker, Forras-Kaufmann, Kuyumcu, Fox, Schwizer, Fried, Lindenmeyer, Gotze and Verrey2015), which was different from our findings. In this study, similar to SLC38A1 and SLC38A2, the jejunum, pancreas and tibialis posterior also exhibited the highest SLC6A19 mRNA expression levels, which demonstrated the importance of SLC6A19 in transporting corresponding AA in the jejunum, pancreas and tibialis posterior relative to the other tissues and organs. The correlation analysis showed that there was little correlation between SLC6A19 and the cationic AA transporter-SLC7A1 because of different transport substrates, while there was a mutual aid between SLC6A19 and SLC3A1 in transporting the same kind of AA.
System y+L was discovered in human erythrocytes, placentas and fibroblasts (Borsani et al., Reference Borsani, Bassi, Sperandeo, De, Buoninconti, Riboni, Manzoni, Incerti, Pepe, Andria, Ballabio and Sebastio1999). SLC7A7 is one of lysinuric protein intolerance genes responsible for cationic AA absorption in the intestine and kidney (Torrents et al., Reference Torrents, Mykkänen, Pineda, Feliubadaló, Estévez, De, Sanjurjo, Zorzano, Virginia, Huoponen, Reinikainen, Simell, Savontaus, Aula and Palacín1999). In the current study, we found that SLC7A7 was widely distributed among different tissues/organs, and the abomasum, duodenum, jejunum, ileum, caecum, kidney, pancreas and tibialis posterior probably had stronger abilities to transport AA for ruminants because the mRNA expression of SLC7A7was higher in these tissues and organs. Similarly, SLC7A7 had the strongest correlation with SLC3A1, suggesting that there is a mutual aid between SLC7A7 and SLC3A1 in transporting the same kind of AA, such as lysine and arginine.
y+ catalyses high-affinity sodium-independent transport of cationic AA and transport of zwitterionic AA with low affinity only in the presence of sodium (Borsani et al., Reference Borsani, Bassi, Sperandeo, De, Buoninconti, Riboni, Manzoni, Incerti, Pepe, Andria, Ballabio and Sebastio1999); SLC7A1 is expressed in the kidney, small intestine, splenocytes and but not in the liver of murine animals (Palacín et al., Reference Palacín, Estévez, Bertran and Zorzano1998). Here, we stated that it was mainly expressed in the abomasum, small intestine, pancreas and liver and tibialis posterior, and the abomasum, pancreas and tibialis posterior had the greatest mRNA expression. Moreover, we found that SLC7A1 had weak correlations with SLC3A1 and SLC7A9 because all of them belong to different transport systems; we thereby inferred that there was no obvious interaction among of them.
System b0,+ was discovered in mouse blastocysts and distributes in epithelial cells (Palacín et al., Reference Palacín, Estévez, Bertran and Zorzano1998). SLC7A9 is a broad-specificity cationic- and neutral-AA exchanger, and expressed in the kidney and the small intestine (Skopková et al., Reference Skopková, Hrabincová, Stástná, Kozák and Adam2005). SLC3A1 was first cloned from rat and rabbit kidneys and is associated with the reabsorption of cysteine and dibasic AA in the kidney and intestine (Palacín et al. Reference Palacín, Estévez, Bertran and Zorzano1998; Skopková et al., Reference Skopková, Hrabincová, Stástná, Kozák and Adam2005). SLC3A1 is found in the kidney, small intestine, pancreas and liver of human (Bertran et al., Reference Bertran, Werner, Chillaron, Nunes, Biber, Testar, Zorzano, Estivill, Murer and Palacin1993). In our study, SLC7A9 was highly expressed in the abomasum, jejunum and ileum, and tibialis posterior at the level of transcription. SLC3A1 was also highly expressed from the abomasum to caecum, pancreas and kidney, and tibialis posterior relative to other determined tissues/organs. We found a high association between SLC7A9 and SLC3A1. It is known that in tissues, disulfide linkages lead to form non-covalently linked heterootetramers of the protein of SLC7A9 and SLC3A1 (Fotiadis et al., Reference Fotiadis, Kanai and Palacín2013).
Our findings were based on the data of relative mRNA expression without protein expression data. Therefore, we only explained the expression patterns of GNAT3, LPAR5 and seven AA transporters at the transcriptional level. To further elucidate the regulation of GNAT3, LPAR5 and AA transporters, we need more research at the translational level, even using omics technology. Furthermore, understanding the molecular mechanisms linking AA receptors and transporters is another big challenge in this field.
Conclusions
As illustrated, LPAR5, GNAT3 and partial AA transporters were expressed in the GIT, kidney, liver, pancreas and muscle tissues in growing goats. However, their mRNA expression patterns differed with locations. We speculated that the abomasum, the duodenum or the jejunum; the pancreas; and the tibialis posterior might be the major positions for AA sensing and transporting. Besides, there were certain correlations among these genes, which may indicate possible functional relationships. Further research is needed to understand these genes and their interactions through techniques for protein analysis, which will contribute to the comprehension of molecular mechanisms and improve production performance in growing ruminants.
Acknowledgements
This work was jointly supported by the National Natural Science Foundation of China (Grant No. 31320103917, 31372342), the CAS Visiting Professorship for Senior & Young International Scientists (Grant No. 2013Y2GA0010, 2017 VBA0026), and the Hunan Provincial Creation Development Project (Grant No. 2013TF3006).
Declaration of interest
The authors declare that they have no conflicts of interest.
Ethics statement
The experiment was carried out after the approval of the Animal Care and Use Guidelines of the Animal Care Committee, Institute of Subtropical Agriculture, Chinese Academy of Sciences, Changsha, China.
Software and data repository resources
None of the data were deposited in an official repository.