INTRODUCTION
To understand the ongoing drastic changes in the Arctic (e.g., Meeker and Mayewski, Reference Meeker and Mayewski2002; Isaksson et al., Reference Isaksson, Divine, Kohler, Martma, Pohjola, Motoyama and Watanabe2005; Miller et al., Reference Miller, Brigham-Grette, Alley, Anderson, Bauch, Douglas and Edwards2010; Divine et al., Reference Divine, Isakson, Martma, Mejer, Moore, Pohjola, van de Wal and Godtliebsen2011; Spielhagen et al., Reference Spielhagen, Werner, Sørensen, Zamelczyk, Kandiano, Budeus, Husum, Marchitto and Hald2011; Trouet et al., Reference Trouet, Esper, Graham, Baker, Scourse and Frank2009, Reference Trouet, Scourse and Raible2012; Jernas et al., Reference Jernas, Klitgaard-Kristensen, Husum, Wilson and Koç2013; Opel et al., Reference Opel, Fritzsche and Meyer2013; Luoto and Nevalainen, Reference Luoto and Nevalainen2015; Serreze and Stroeve, Reference Serreze and Stroeve2015; Pawłowska et al., Reference Pawłowska, Zajączkowski, Łącka, Lejzerowicz, Esling and Pawlowski2016; Polyakov et al., Reference Polyakov, Pnyushkov, Alkire, Ashik, Baumann, Carmack and Goszczko2017; Linderholm et al., Reference Linderholm, Nicolle, Francus, Gajewski, Helama, Korhola and Solomina2018; Nicolle et al., Reference Nicolle, Debret, Massei, Colin, de Vernal, Divine, Werner, Hormes, Korhola and Linderholm2018; Werner et al., Reference Werner, Divine, Ljungqvist, Nilsen and Francus2018), more accurate and high-resolution data about past environmental changes in the region are required. The data can be provided by sediment records from specific local regions having high sedimentation rates. These regions include the northern fjords of Novaya Zemlya archipelago (hereafter Novaya Zemlya) with internal deepwater basins that, without hiatuses, serve as natural reservoirs for continuous sediment accumulation (Murdmaa et al., Reference Murdmaa, Polyak, Ivanova and Khromova2004; Polyak et al., Reference Polyak, Murdmaa and Ivanova2004).
The main source of glaciomarine sedimentary material in the fjords is suspension-rich glacial meltwater and terrestrial materials of various sizes supplied by icebergs and sea ice (Syvitski, Reference Syvitski1989). In fjords, the changes in lithology and the variations in the mineral and chemical composition of glaciomarine sediments are determined by glacial dynamics. In turn, the glacial dynamics are controlled by internal (such as subglacial drainage systems and internal stresses) and external (such as climate and glacial mass-balance conditions) glaciological factors (e.g., Meier and Post, Reference Meier and Post1969; Clarke, Reference Clarke1987; Eisen et al., Reference Eisen, Harrison and Raymond2001; Copland et al., Reference Copland, Sharp and Dowdeswell2003; Nesje and Dahl, Reference Nesje and Dahl2003; Matthews and Briffa, Reference Matthews and Briffa2005), as well as geomorphological factors (such as length and area; e.g., Evans and Rea, Reference Evans, Rea and Evans2003; Ottesen and Dowdeswell, Reference Ottesen and Dowdeswell2006; Ottesen et al., Reference Ottesen, Dowdeswell, Benn, Kristensen, Kristensen, Kristensen, Hansen, Lebesbye, Forwick and Vorren2008). Meanwhile, the dynamics of the Novaya Zemlya glaciers and the climate variability in the region are quite complex and far from being fully understood (e.g., Shumskii, Reference Shumskii and Saks1949; Сhizhov et al., Reference Chizhov, Koryakin, Davidovich, Kanevskii, Zinger, Bazheva, Bazhev and Khmelevskoi1968; Zeeberg and Forman, Reference Zeeberg and Forman2001; Moore, Reference Moore2013; Carr et al., Reference Carr, Stokes and Vieli2014; Melkonian et al., Reference Melkonian, Willis, Pritchard and Stewart2016).
There are only two publications (Murdmaa et al., Reference Murdmaa, Polyak, Ivanova and Khromova2004; Polyak et al., Reference Polyak, Murdmaa and Ivanova2004) devoted to the recent paleoenvironmental evolution of the northern Novaya Zemlya fjords that present lithologic, microfossil, and isotope records of the 6-m-long core ASV-987 from the Russkaya Gavan’ Fjord located on its west coast. According to accelerator mass spectrometry (AMS) 14C radiocarbon dating of benthic foraminifera found in the core, the core spans approximately 800 yr. The authors conclude that the glaciers on the west coast of Novaya Zemlya are sensitive to regional and global climatic changes. Currently, there are no publications on similar paleoreconstructions with respect to the records from glaciomarine sediment sequences of the eastern Novaya Zemlya fjords.
Our study fills the gap in the existing literature and presents a 1000-yr-long history of environmental changes in the eastern fjord of Novaya Zemlya (the least explored area of the Arctic) reconstructed through a multiproxy-based study, the AMS 14C, and the short-lived radionuclide dating of sediment core AMK-5248. In addition to the lithologic description, grain-size analysis, ice, and iceberg-rafted debris (IRD), we analyze the mineral and chemical composition, including rare earth elements (REE), of the sediments found in the core. The data on grain-size and chemical composition were processed by mathematical statistics methods, which revealed certain small-scale variability of sedimentation environments superimposed on general trends in climate-driven environmental changes.
PHYSIOGRAPHIC AND OCEANOGRAPHIC SETTING
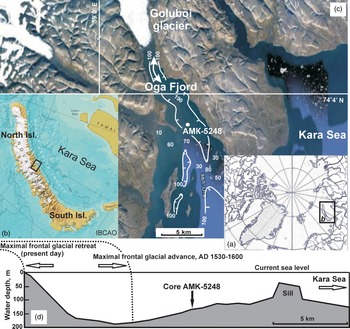
Glaciers of the northern Novaya Zemlya represent remnants of the last late Pleistocene ice sheet that occupied the Barents Sea (e.g., Gataullin et al., Reference Gataullin, Polyak, Epstein and Romanyuk1993, Reference Gataullin, Mangerud and Svendsen2001; Polyak and Solheim, Reference Polyak and Solheim1994; Polyak et al., Reference Polyak, Lehman, Gataullin and Jull1995, Reference Polyak, Forman, Herlihy, Ivanov and Krinitsky1997, Reference Polyak, Gataullin, Okuneva and Stelle2000; Zeeberg et al., Reference Zeeberg, Lubinski and Forman2001; Svendsen et al., Reference Svendsen, Alexanderson, Astakhov, Demidov, Dowdeswell, Funder and Gataullin2004; Hughes et al., Reference Hughes, Gyllenkreutz, Lohne, Mangerud and Svendsen2015; Patton et al., Reference Patton, Andreassen, Bjarnadóttir, Dowdeswell, Winsborrow, Noormets, Polyak, Auriac and Hubbard2015; Batchelor et al., Reference Batchelor, Margold, Krapp, Murton, Dalton, Gibbard, Stokes, Murton and Manica2019). In this region, postglacial warming and sea-level rise that began at ~20 to 19 ka BP (Fairbanks Reference Fairbanks1989; Yokoyama et al., Reference Yokoyama, Lambeck, De Deckker, Johnston and Fifield2000; Mix et al., Reference Mix, Bard and Schneider2001; Clark et al., Reference Clark, Dyke, Shakun, Carlson, Clark, Wohlfarth, Mitrovica, Hostetler and McCabe2009; Carlson and Clark, Reference Carlson and Clark2012; Lambeck et al., Reference Lambeck, Rouby, Purcell, Sun and Sambridge2014) initiated an inland frontal retreat of the glaciers and flooding of the deep and extended fjords behind them. The Oga Fjord, with a maximum water depth of 190 m, is separated from the Novaya Zemlya Trough by an almost vertical sill (top of the sill <50 m water depth), featuring a chain of small islands, and consists of three local deepwater basins (Fig. 1). The site of the studied core is located in the inner basin, adjacent to the Goluboi tidewater glacier that serves as a natural trap for proximal glaciomarine sediments.
Overview map of the Arctic Ocean, the Novaya Zemlya archipelago, and the study area: (a) the Arctic Ocean; (b) Novaya Zemlya, the solid box outlines index map in c; (c) satellite image of the Oga Fjord fed by the Goluboi tidewater glacier and the position of core AMK-5248 (100 m isobath is drawn in white lines, separate numbers show water depths, white arrows indicate the most likely direction of the frontal glacial movement in the past); (d) water depth profile along the Oga Fjord and site of core sampling is shown on the profile, along with the glacial fronts currently and during AD 1530 to AD 1600 (dotted lines).
Extensive valleys that crosscut the North Island in the latitudinal direction from the Barents Sea to the Kara Sea serve as natural channels for glaciers; the Goluboi glacier originated from the main ice cap of the island (Kotlyakov, Reference Kotlyakov1978). According to Chizhov et al. (Reference Chizhov, Koryakin, Davidovich, Kanevskii, Zinger, Bazheva, Bazhev and Khmelevskoi1968), the valleys are cut almost perpendicularly by bedrock ridges stretching from north to south. At the intersection with the valleys, the ridges form narrow barriers. The shallow sill in the Oga Fjord (Fig. 1d) represents a similar barrier composed of rocks resistant to denudation.
Oceanographic studies in the northern fjords on the east coast of Novaya Zemlya revealed a seasonal pycnocline (at water depths of 10–15 m) separating the surface water layer (<30‰) and underlying seawater (>34‰; Korsun and Hald, Reference Korsun and Hald1998). Similar vertical salinity profiles are also typical for the Oga Fjord. However, here they are distinguished by a thicker (25–30 m) upper layer (24–32‰; Udalov et al., Reference Udalov, Vedenin, Chava and Shchuka2019), which indicates a stronger influence of glacial meltwater runoff. The pronounced water stratification causes the development of an estuarine-type circulation in the fjord, wherein the meltwater discharge leads to an increase in the counterflow of open-sea waters (Howe et al., Reference Howe, Husum, Inall, Coogan, Luckman, Arosio, Abernethy and Verchili2019). Isotopic studies of the waters in eastern fjords (Kossova et al., Reference Kossova, Dubinina and Miroshnikov2019) showed that the water layer above the halocline contains up to 30% of the freshwater component, formed from a mixture of local glacial meltwater and waters of the Ob’ River's runoff. The Ob’ River's runoff waters are brought to the eastern fjords of the archipelago by the Eastern Novaya Zemlya Current (Gorshkov, Reference Gorshkov1980).
MATERIALS AND METHODS
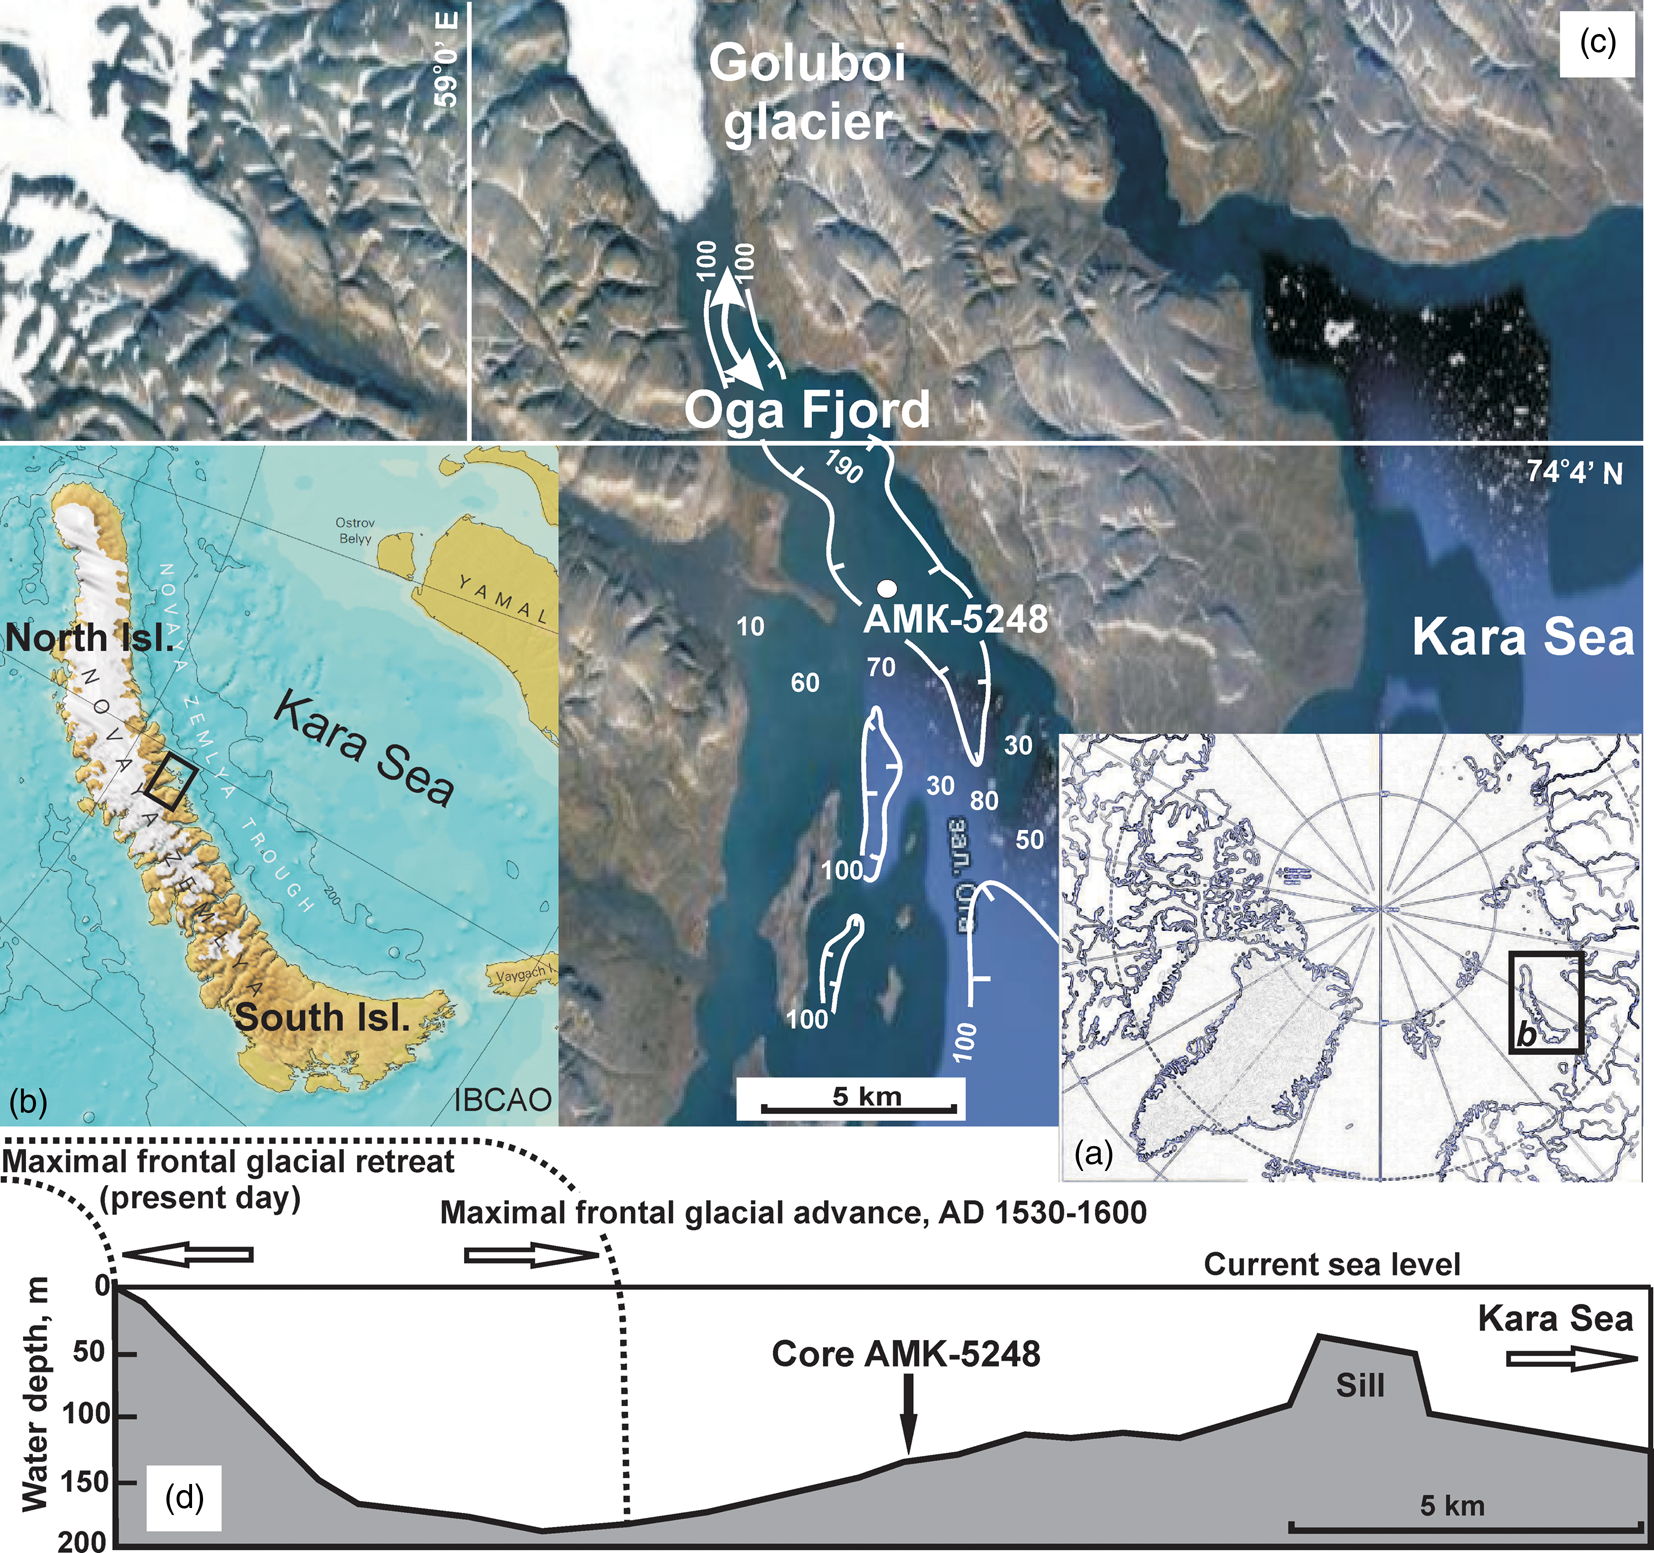
Core AMK-5248 was retrieved at a site with coordinates 74°37.9′N, 59°18.3′E and a water depth of 129 m during the 63rd cruise of RV Akademik Mstislav Keldysh in 2015 (Fig. 1c). Core sampling was carried out by means of a box corer and a gravity corer; the total length of the sections was 26 cm and 402 cm, respectively (Fig. 2). Because the gravity corer destroys the uppermost soft sediment layer, the studied sedimentary sequence is a combination of the two cores, correlated based on the down-core variability in water content, grain size, and chemical composition. It was found that the lower boundary of the upper sediment layer destroyed by the gravity corer corresponds to 19 cm (Fig. 2).
Lithologic scheme of core AMK-5248, built on the basis of a preliminary (field) description, as well as grain-size analysis (Supplementary Table 2): 1, watered sludge with a water content of 40–50 wt%; 2, clayey silt; 3, silt; 4, clayey silt with thin (<1 cm) sand interlayers; and 5, iceberg-rafted debris (IRD). Vertical profiles of individual fractions and clay mineral content (wt%), water calculated content (Water cont.; wt%), along with clay minerals/clastic minerals, Qz/Pl, and Al/Si ratios. Dating model (solid line) and changes in sedimentation rates (dashed line). The arrows show the reference horizons of the age model and the corresponding dates (see Tables 1 and 2, Supplementary Table 1). cal yr BP calculated by linear interpolation for a surface sample corresponding to AD 2015 (see Tables 1 and 2).
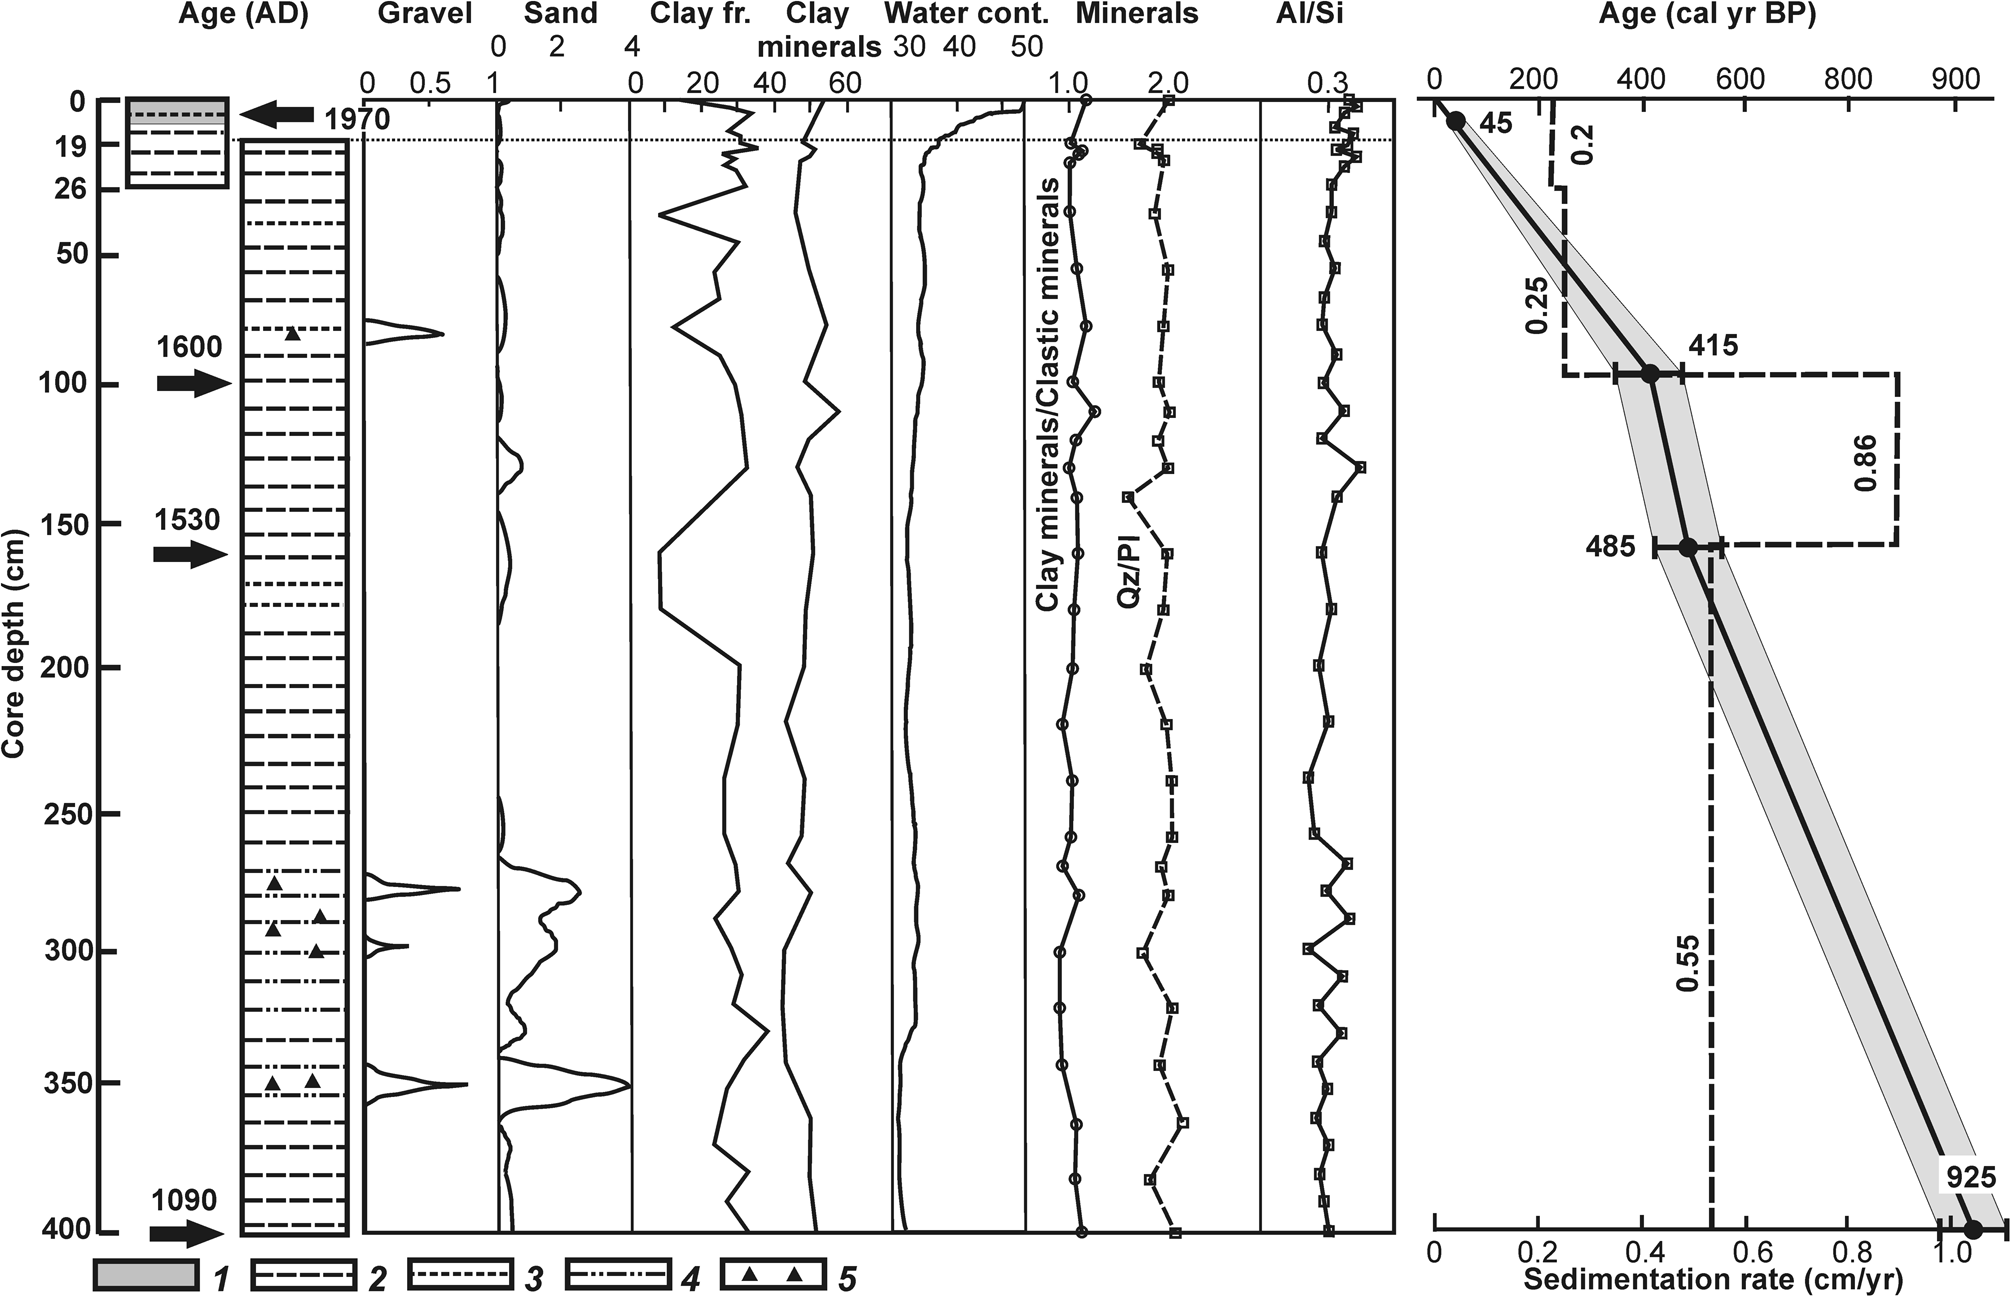
Activity of natural (210Pb) and technogenic (137Cs) radionuclides was continuously (every 2 cm) measured in the box core section. The samples were measured on a low-background gamma-spectrometric complex having multilayer passive shielding (lead, old low-background iron, copper, and plexiglass). For recording purposes, we used a BEGe3825 broadband detector made of ultrapure germanium of the planar type (Canberra, USA) having a thin carbon composite entrance window (0.6 mm wide), crystal diameter of 70 mm, an area of 3800 mm2, and a thickness of 25 mm, which makes it possible to record gamma quanta with energies from 5 keV to 3 MeV. Notably, the energy resolution along the 1332 keV 60Co line was not less than 1.7 keV and that along the 57Co 122 keV isotope line was not less than 0.6 keV. The collection and processing of information was carried out on a DSA-1000 pulse analyzer (Canberra, USA). DSA-1000 is a complete integrated multichannel analyzer with 16 channels, built with reference to modern digital signal processing technology. In combination with the DSA-1000 analyzer (connected to a computer), the BEGe3825 germanium detector forms a complete spectrometric unit, providing the highest-quality collection and analysis of spectra. In this study, Genie 2000 v. 3.2.1 software was used to analyze the spectrum obtained on the detector. The results are summarized in Table 1.
The specific activity of short-lived radionuclides in Bq/kg in sediments of core AMK-5248, the standard deviation (Δ), mass of samples, and estimated age of horizons.
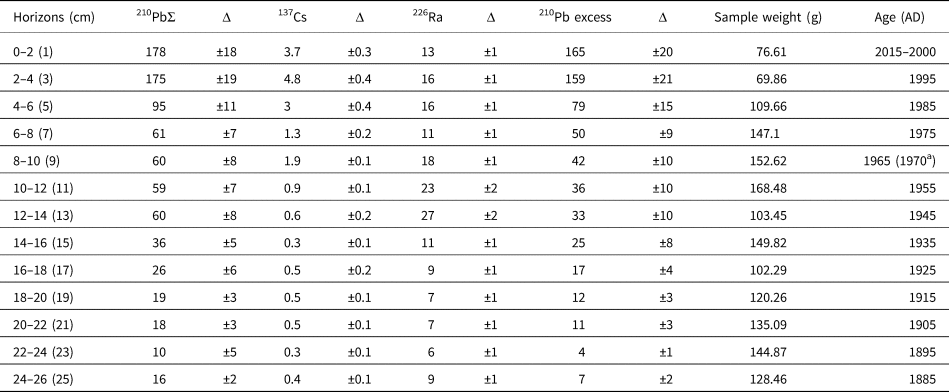
a Calendar age calculated by linear interpolation for a sample with modern accelerator mass spectrometry 14C age (see Table 2).
The dating model used in this study was based on four AMS 14С dating results of benthic foraminifera; these results were obtained from the Poznań Radiocarbon Laboratory (Fig. 2, Table 2). The choice of intervals for dating the benthic foraminifera was determined by the availability of a sufficient number of tests (>0.7 mgC). In the upper part of the box core, the required number of foraminifera was collected from several samples in the 6–12 cm interval. AMS 14C dating was calibrated to calendar years using the Calib Rev v. 8.1.0 software (www.calib.org) with the 402 yr standard reservoir correction provided by the program and the Marine20 calibration database, assuming the age of the surface sample to be the year of core sampling, AD 2015 (Supplementary Table 1).
Accelerator mass spectrometry 14C dating of carbonate benthic foraminiferal shells (bulk) from core AMK-5248 and the corresponding calendar age calibrated using the Calib Rev v. 8.1.0 (www.calib.org) with the Marine20 calibration curve.

a Calendar age calculated for a surface sample corresponding to AD 2015 (see Table 1).
After onboard lithologic description of the core, the “wet” samples taken in plastic bags were stored at a temperature of ~0°С until they were transported to onshore laboratories. Parts of individual samples were dried to determine their water content. Water content was determined as the weight difference between the wet and dry samples (Supplementary Table 2).
Grain-size analysis was carried out with wet samples using the wet-sieve and decantation method, as proposed by Petelin (Reference Petelin1967) and later improved by Andreeva and Lapina (Reference Andreeva and Lapina1998). Before sieve dispersion and decantation, the wet samples were dispersed using ultrasound in an ultrasonic bath for 5 min at a vibration frequency of 21–22 kHz. To calculate the content of fine silt and clay fractions (<0.01 mm), the specific gravity of the average sample was taken as 2.55 g/cm3. The sedimentation rate of the fine particles in the water column and the time for pouring the suspension out of the cans were calculated using the Stokes law and Arkhangelsky formulas (coefficients 2/9 and 0.16, respectively). The size of the sieves corresponds to the selected fractions >0.01 mm in Supplementary Table 2. The grain-size data are summarized in Supplementary Table 2.
The mineral composition of several dried samples was studied using an X-ray diffractometer (XRD). The X-ray diffraction patterns from the samples were obtained using the Ultima-IV XRD (Rigaku, Japan) and semiconductor 1D detector D/Tex Ultra, (scan range of 3–65°2θ, scan speed of 3°2θ/min, and step of −0.02°2θ). The mineralogical composition was analyzed via the method applied by Moore and Reynolds (Reference Moore and Reynolds1997); the quantitative composition of the samples was estimated by applying the Rietveld method (Post and Bish, Reference Post, Bish, Bish and Post1989) using the BGMN code (Profex software v. 3.14.3; Doebelin and Kleeberg, Reference Doebelin and Kleeberg2015). The results are summarized in Supplementary Table 3.
For chemical composition analysis, sediment was dried at temperatures of up to +105 °C. No washing of sea salt was done to avoid the loss of elements due to desorption and solubility in freshwater. Chemical composition was studied using two methods: X-ray fluorescence (XRF) and inductively coupled plasma atomic emission spectrometry (ICP-AES). XRF analysis was carried out on a stationary spectrometer, with a scanning channel AXIOS Advanced (PANalytical BV, Netherlands), which has an X-ray tube (with a rhodium anode as a source of excitation of characteristic radiation). We used 36 standard samples of bottom sediments, soils, and rocks to calibrate the spectrometer, obtain the characteristics of the calibration curves, and quantify the rock-forming oxides and impurity elements in the samples. The content of the following elements was determined: Si, Al, Ti, Fe, Mn, K, Ca, Mg, Na, P, Cr, S, V, Co, Ni, Cu, Zn, Rb, Sr, Nb, Pb, Zr, Ba, and Y, as well as loss on ignition (Supplementary Table 4). ICP-AES was performed on the ICAP-6500 Duo plasma Echelle spectrometer (Thermo Scientific, UK). The emission spectral range of 166–847 nm was recorded on a highly sensitive semiconductor detector charge-injection device. The REE and yttrium content (collectively “REY”) determined is given in Supplementary Table 5.
The data on grain-size and chemical composition were processed by mathematical statistics methods using the standard Statgraphics Plus v. 10 software package. To assess the degree of heterogeneity of the studied samples, methods of statistical analysis such as factor analysis in the R-modification were applied.
RESULTS
Stratigraphy
Chronostratigraphy and sedimentation rate
Reliable information on sedimentation history over the recent decades was provided via the activity of short-lived radionuclides, such as 210Pb and 137Cs, with half-lives of 22.3 and 30.174 yr, respectively (Koide et al., Reference Koide, Soutar and Goldberg1972; Kuptsov, Reference Kuptsov1986; Sapozhnikov et al., Reference Sapozhnikov, Aliev and Kalmykov2006; Supplementary File 1). The subsurface peak of 137Cs activity at 8–10 cm presumably reflects global fallout from nuclear weapon tests in AD 1958 to AD 1963 (Supplementary Fig. 1). However, accumulation of technogenic radionuclides in the fjord sediments occurs with some delay, because the bulk of radionuclides from the atmosphere initially accumulate on the surface of the snow and ice cover and only then enter the fjord (with the meltwater). Therefore, it can be presumed that the sediment layer at 8–10 cm could have accumulated between 1960 and 1970. This is consistent with the results of the AMS 14C–dated sample from 6 to 12 cm (average 9 cm; Tables 1 and 2). The sedimentation rates derived from 137Cs measurements were also found to be in good agreement with sedimentation rates estimated by “excess” 210Pb (Supplementary Fig. 1), both differing from linear sedimentation rates based on the AMS 14C dating by 5–7 yr in the upper 26 cm of the core. This allowed us to accept the dating model shown in Figure 2 and presented in Supplementary Table 1 as the basis for reconstructing the sedimentation history of the Oga Fjord over the last millennium.
The core sequence can be subdivided into three sections using the down-core variability in sedimentation rates (Fig. 2). The upper section, 0–100 cm, corresponding to the last ca. 415 yr is characterized by the lowest sedimentation rates, close to 0.2–0.25 cm/yr. The middle section, 100–160 cm, accumulated over 70 yr between AD 1600 and AD 1530 under the highest sedimentation rates of 0.86 cm/yr. The lower section, 160–402 cm (AD 1090 to AD 1530), is characterized by moderate average sedimentation, close to 0.55 cm/yr.
Lithostratigraphy
Core AMK-5248 largely consists of reduced medium dark-gray sediments (N4 according to the Munsell Rock Color Chart), with patches of darker, almost black, hydrotroilite spots, except the uppermost 0–2 cm oxidized layer, which is colored a dark greenish-gray to dark-gray (5GY4/1–N3). The upper 12-cm-thick unit is distinguished by high water content of 40–50 wt% (Fig. 2). As the sediments gradually get denser down core, the water content decreases to ~30 wt% at 19–25 cm and remains close to this value in the rest of the core. During onboard visual description, laminated sediments were recorded in the lower part of the core, along with coarse-grained inclusions at 276–319 and 335–366 cm. Otherwise, the core sequence appeared visually relatively homogeneous.
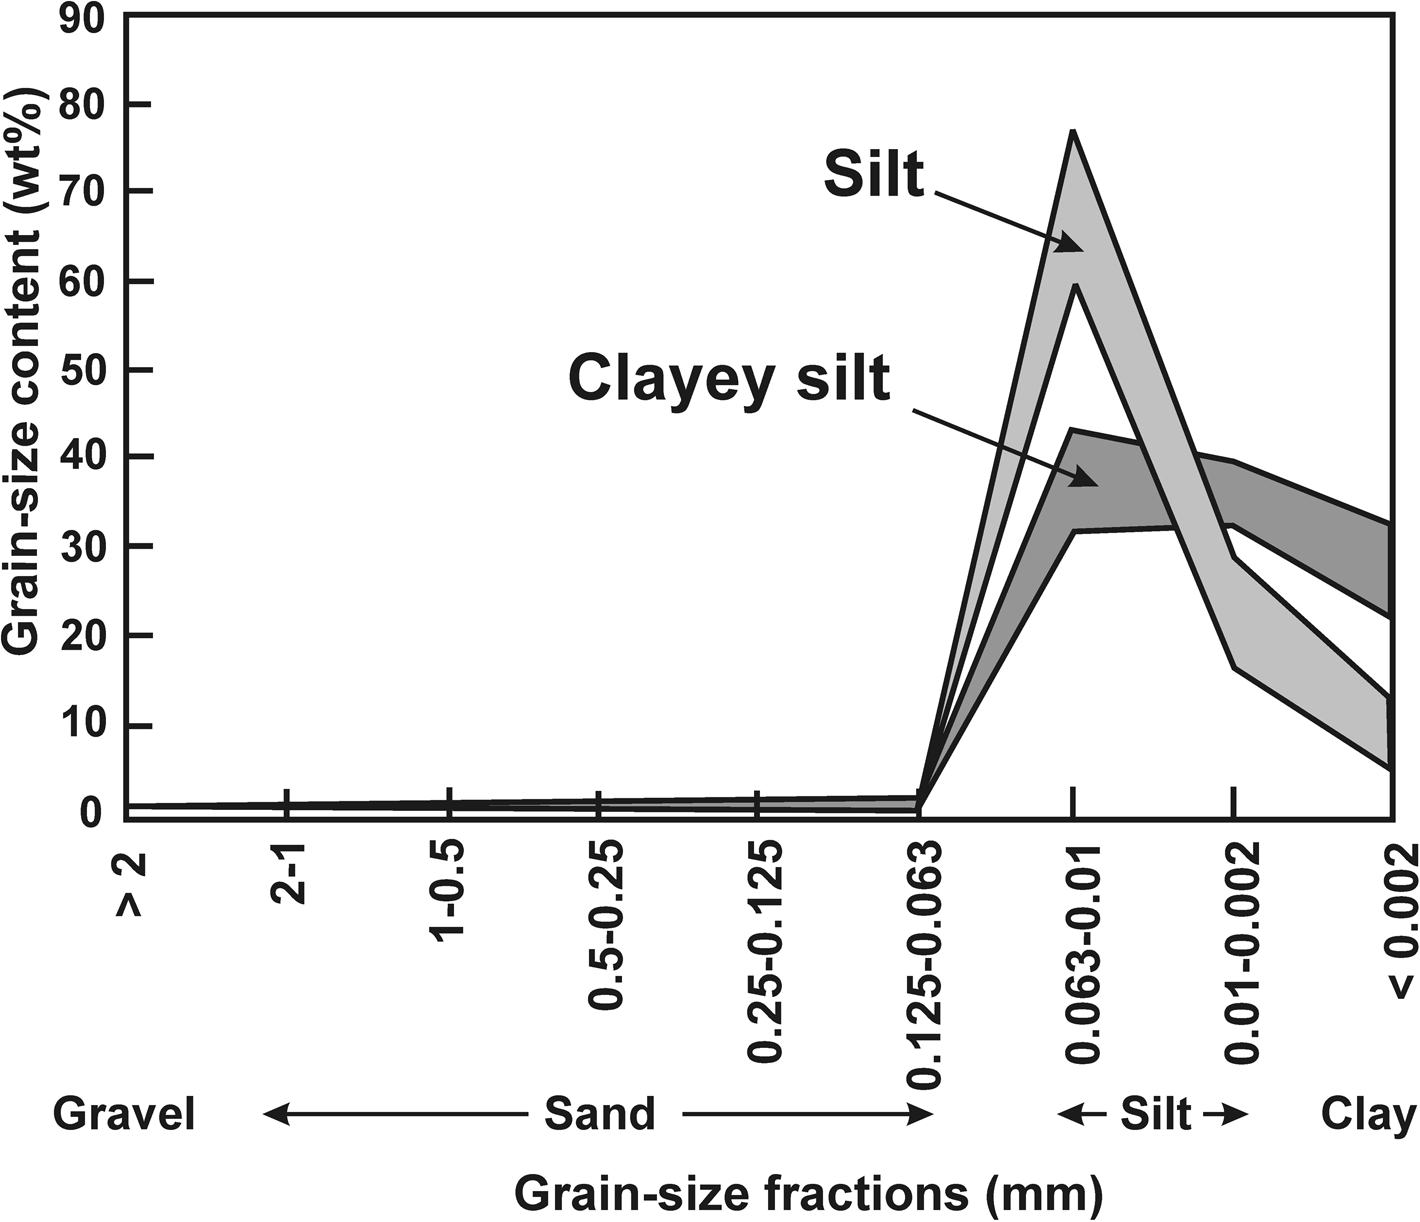
Based on the grain-size analysis, two granulometric types are distinguished: silt and clayey silt (Fig. 3, Supplementary Table 2). In our analysis, silty sediment is dominated by a coarse silt (0.01–0.063 mm) fraction that constitutes 60–80 wt%. Clayey–silty sediment contains equal amounts (20–40 wt%) of the three finest fractions: coarse silt, 0.01–0.063 mm; fine silt, 0.002–0.01 mm; and clay <0.002 mm. Both granulometric types are characterized by extremely low gravel (0–0.8 wt%) and sand (0–3.8 wt%) content, indicating a predominant supply of fine suspended glacial material (with meltwater) and a relatively limited IRD input.
Percentage (wt%) of individual fractions of sediments in core AMK-5248 indicating granulometric types: silt and clayey silt. See also Supplementary Table 2.
Statistical analysis revealed more variables than those used to establish granulometric types and included five sand-sized and two silt-sized fractions (Supplementary Table 2). According to a previous study, subdivision of the core sequence based on statistical clustering is more accurate than that based solely on the types (Rusakov et al., Reference Rusakov, Kuz'mina, Levitan, Toropchenova and Zhilkina2017, Reference Rusakov, Kuz'mina, Тoropchenova and Zhilkina2018). Factor analysis of grain-size data revealed the two main significant factors that explain the effect of different fractions on the composition (Fig. 4). Factor 1 explains 62.6% of the dispersion and reflects the effect of gravel–sand material >0.063 mm (positive values of the factor; Fig. 4a). Factor 2 explains 29.5% of the dispersion and represents the competition between the fractions of coarse silt (0.063–0.01 mm; negative factor values) and the total content of fine silt and clay (<0.01 mm; positive factor values).
Results of factorial and cluster analyzes of the grain-size composition of sediments of core AMK-5248: (a) most significant factors and their load in %; (b) distribution of values in the factor space of the first two factors; (c) dendrogram of hierarchical connections between individual horizons: cluster/granulometric unit I (clayey silt with inclusion of gravel–sand material), cluster/granulometric unit IIa (silt), and cluster/granulometric unit IIb (clayey silt; Supplementary Table 2); and (d) vertical distribution of the first two factors along the core and granulometric type division: S (silt), CS (clayey silt), S* (silt with iceberg-rafted debris [IRD] inclusions), and CS* (clayey silt with IRD inclusions).
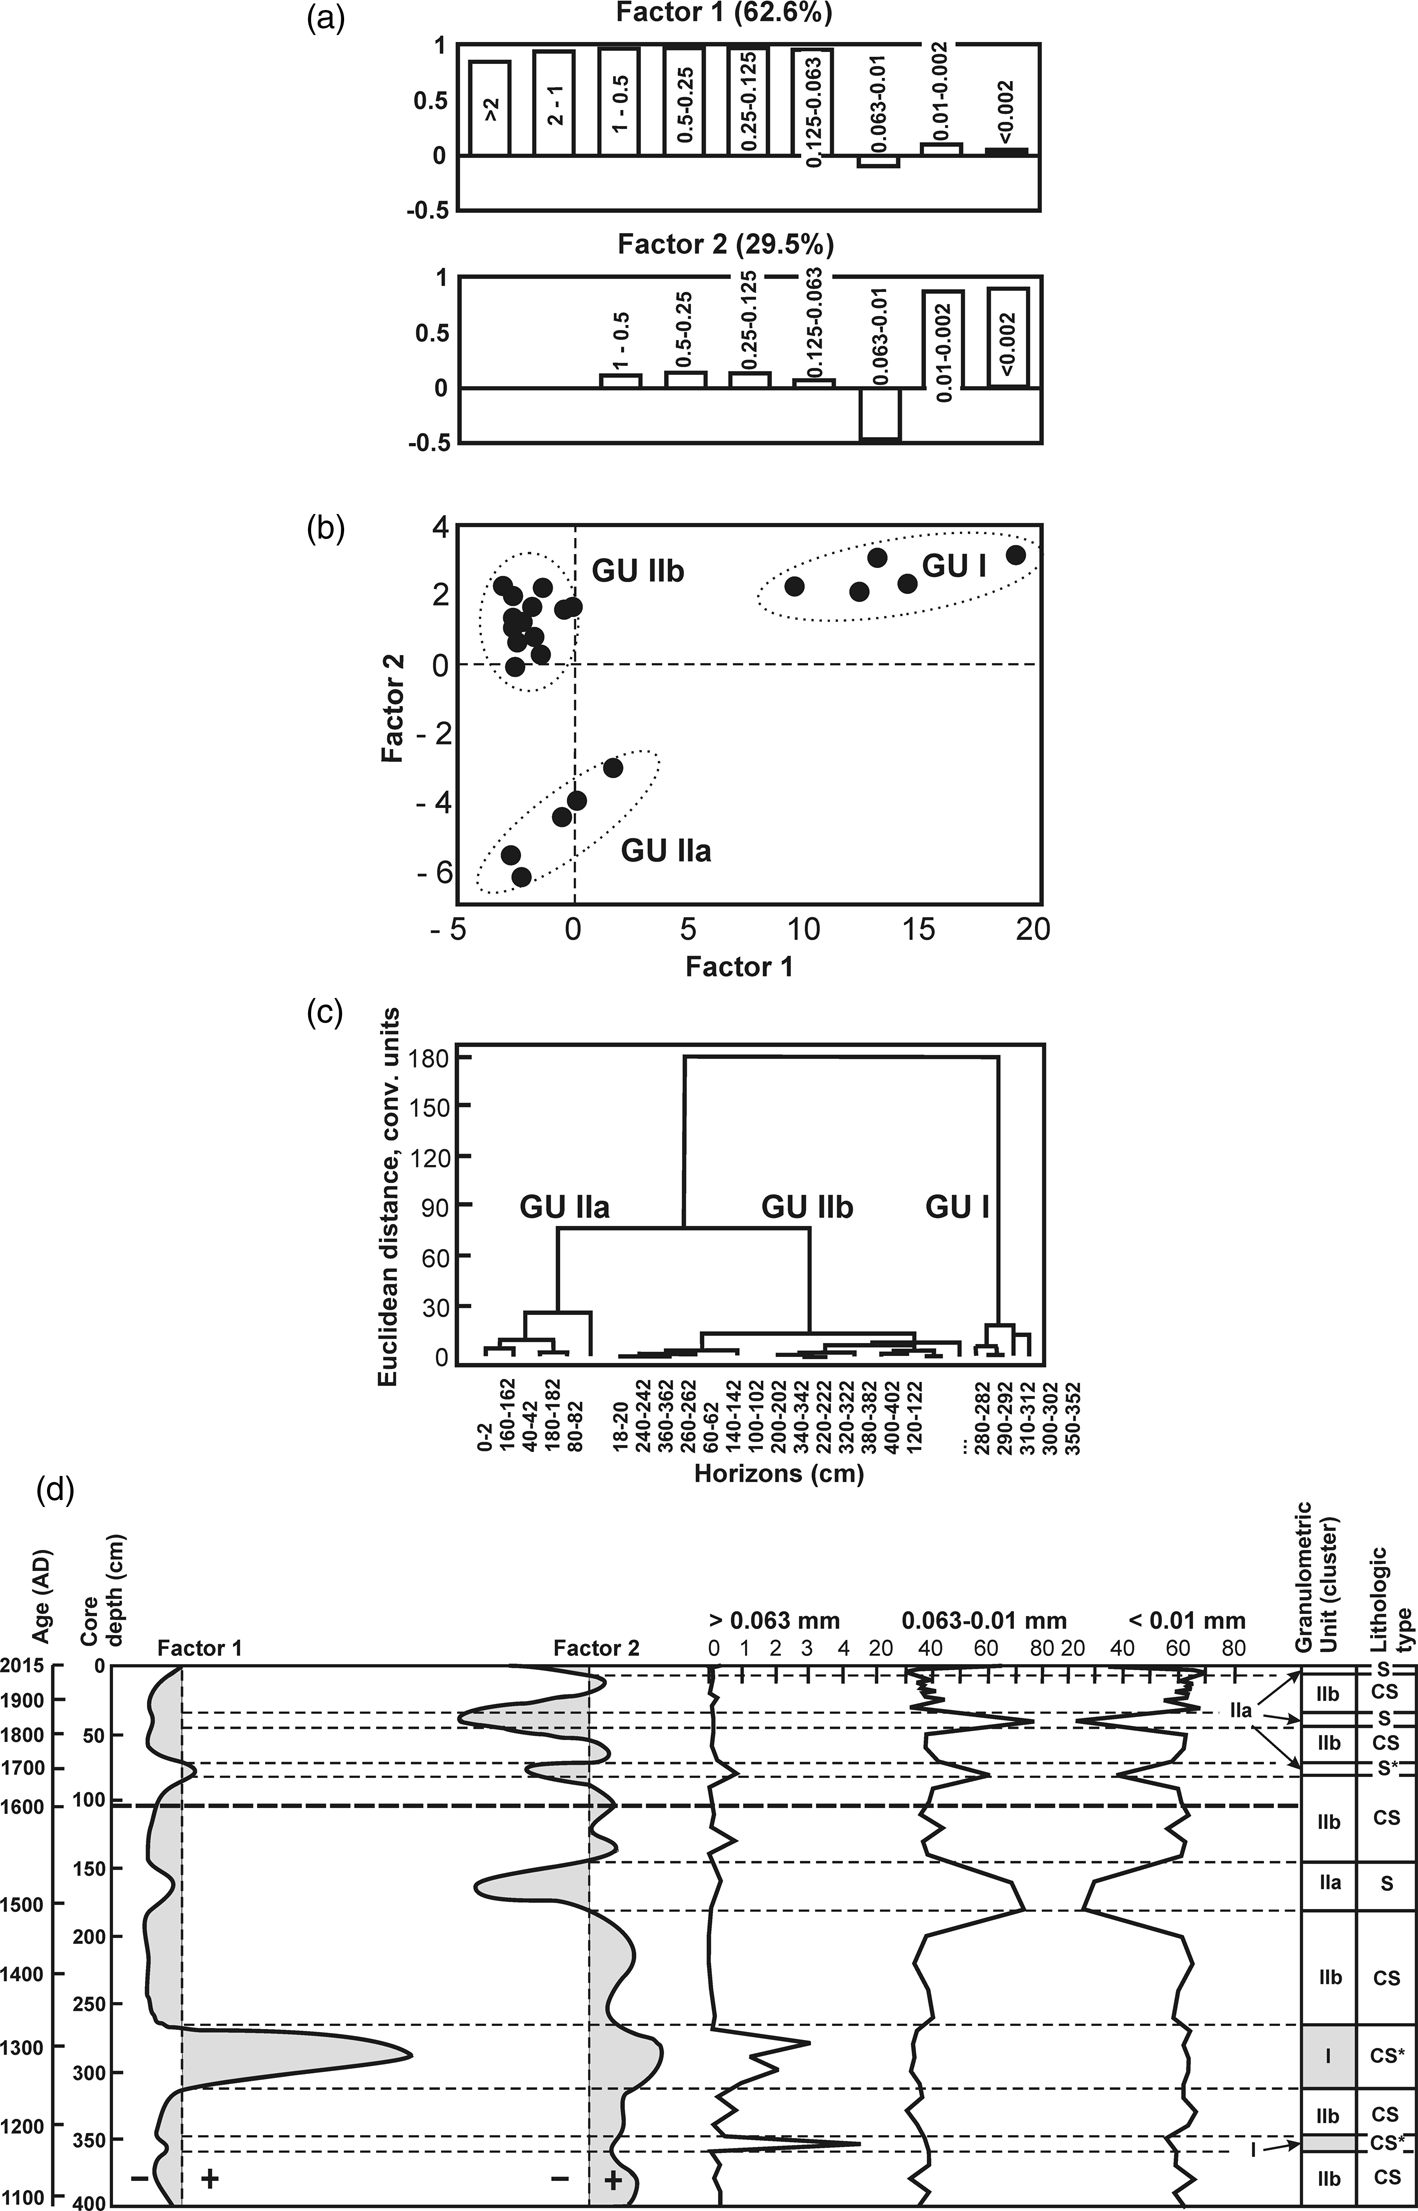
The graph of factor value (load) distribution in the space of the first two most significant factors (Fig. 4b) and cluster dendrogram (Fig. 4c) display three clusters/granulometric units (GU): GU I, GU IIa, and GU IIb. The low affinity between GU I and GU II (Fig. 4c) is associated with gravel and sand. Notably, the sediments of GU I, with increased IRD input, consist predominantly of fine-grained material.
GU IIa includes sediments having a high coarse silt fraction contribution. As a rule, the increase in coarse silt in the sediments of tidewater fjords is associated with their proximity to the glacial front, where discharge of meltwater and suspended glacial sediment load takes place (proximal glaciomarine sediments; Syvitski, Reference Syvitski1989; Ó Cofaigh and Dowdeswell, Reference Ó Cofaigh and Dowdeswell2001; Murdmaa et al., Reference Murdmaa, Polyak, Ivanova and Khromova2004; Polyak et al., Reference Polyak, Murdmaa and Ivanova2004; Meire et al., Reference Meire, Mortensen, Meire, Juul-Pedersen, Sejr, Rysgaard, Nygaard, Huybrechts and Meysman2017).
GU IIb corresponds to sediments with a high content of fine silt and clay fractions <0.01 mm. This material reflects suspension-rich surface glacial–meltwater plumes, also called “glacial milk,” and containing a large amount of the suspended glacial matter.
Chemostratigraphy
The down-core distribution of chemical elements in core AMK-5248 was found to be rather uniform. The use of trace elements is limited, as most of the variation in their content is close to the statistical error of chemical analysis (Supplementary Table 4), and variations in the content of major elements were only slightly higher: SiO2 (55.2–56.4 wt%), Al2O3 (16.2–17.4 wt%), Fe2O3 (7.4–7.9 wt%), MgO (2.71–3.53 wt%), and CaO (1.97–2.88 wt%). For comparison, in the Kara Sea sediments, the major and trace element content varies within 40% (Rusakov et al., Reference Rusakov, Kuz'mina, Levitan, Toropchenova and Zhilkina2017, Reference Rusakov, Kuz'mina, Тoropchenova and Zhilkina2018). To derive the relevant information from such a homogeneous geochemical data set, we applied methods of mathematical statistics (Davis, Reference Davis1990), which allowed us to unravel the “hidden” relationships between chemical elements inaccessible to other geochemical analysis methods. The application of mathematical statistics allows the widest possible range of data on elemental composition of sediments to be used as opposed to, for example, geochemical modules, for which only a finite set of chemical elements is used.
Factor analysis revealed the two main significant factors that together explain 63.6% of the variance in the chemical composition of sediments (Fig. 5a). The remaining factors had low significance. Factor 1 explains 34.4% of the variance and represents competition between Si, Ti, Fe, Mg, and K (positive factor values) and Al, Ca, P, and Mn (negative factor values). Factor 2 explains 29.2% of the variance and reflects the competition between Si, Ca, Mg, and P (positive factor values) and Al and K (negative factor values).
Results of factor analysis of chemical composition of sediment of core AMK-5248: (a) the most significant factors and their load in %; (b) distribution of values in the factor space of the first two factors; and (c) vertical distribution of the first two factors along the core and chemostratigraphic division. See also Supplementary Table 4.
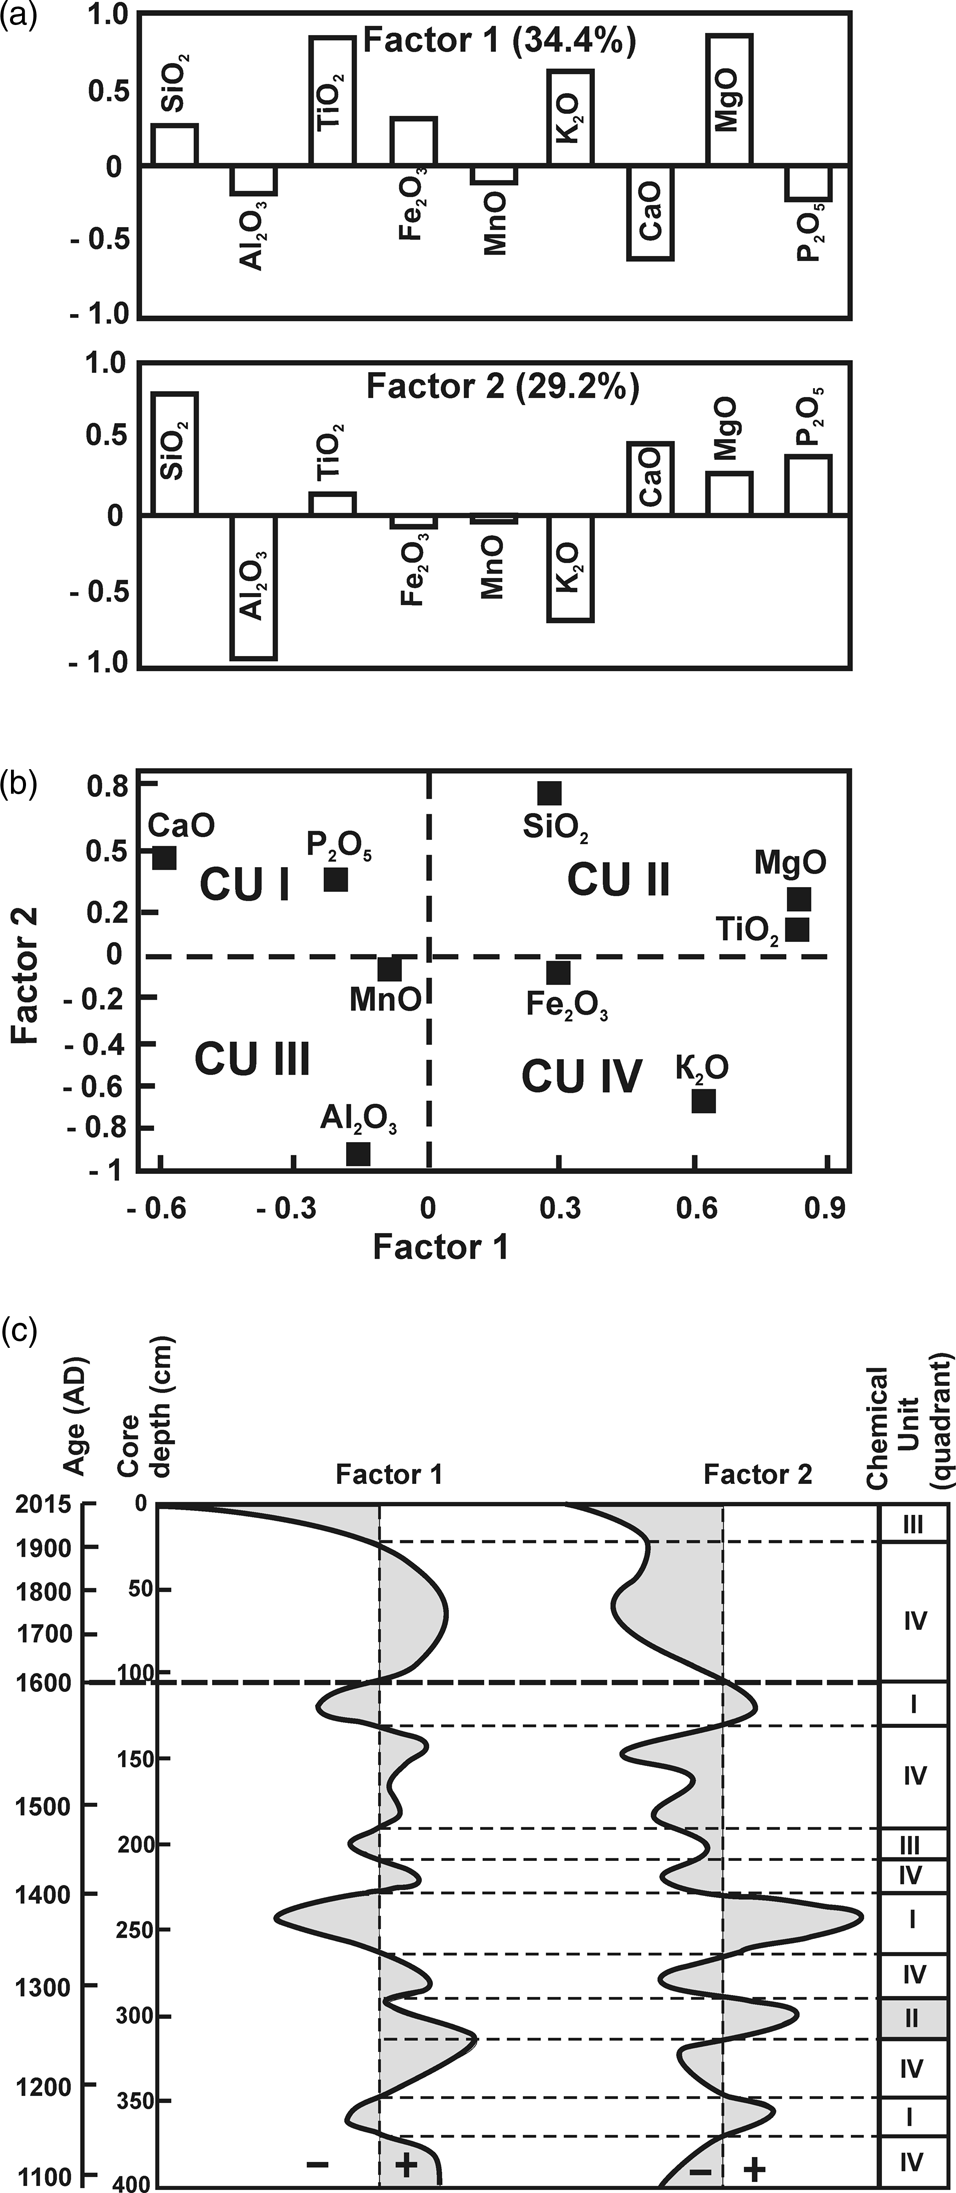
Chemical elements that show the highest dispersion are plotted in the factor space of the first two factors in Fig. 5b. Here, the factor space is divided into four quadrants, each reflecting a certain combination of factor signs, similar to the factor space shown in Fig. 4b for grain-size composition. However, in contrast to the grain-size factor values, positions of individual chemical elements in the factor space do not form independent clusters. For this reason, further classification of chemical elements is based on their position in the corresponding factor space quadrant. The established chemical quadrants are referred to as chemical units (CU; Supplementary File 2).
Mineralogy
The mineral composition of 27 sediment samples (Supplementary Table 3) demonstrated equal representation of clastic and clay minerals. Quartz and plagioclase predominated among clastic (bulk non-clay) minerals, accounting for ~43 wt% in total. The average proportion of quartz was approximately two times higher than that of plagioclase (Fig. 2, Supplementary Table 3). The remaining clastic minerals accounted for 5–6 wt% (ankerite, 2.3 wt%; calcite, 2.2 wt%; potassium feldspar, <0.9 wt%; and dolomite, <0.9 wt%). The presence of these carbonate minerals indicates Paleozoic terrigenous-carbonate beds as a potential source of sedimentary material (Lopatin, Reference Lopatin1999). Notably, biogenic calcite was significantly less abundant than clastic calcite (<<1 wt%).
The total content of clay minerals (illite, chlorite, and kaolinite) exceeded 50 wt%, allowing us to refer the studied sediments as siliciclastic clay, according to the accepted lithologic classification (Frolov, Reference Frolov1993; Boggs, Reference Boggs2009; Prothero and Schwab, Reference Prothero and Schwab2013). Among them, illite is the main clay mineral, accounting for an average of 32.8 wt% of the total mass. Notably, the sum clay mineral content was higher than the clay fraction (Fig. 2, Supplementary Tables 2 and 3). This indicates that some of the clay minerals grains were larger than 0.002 mm.
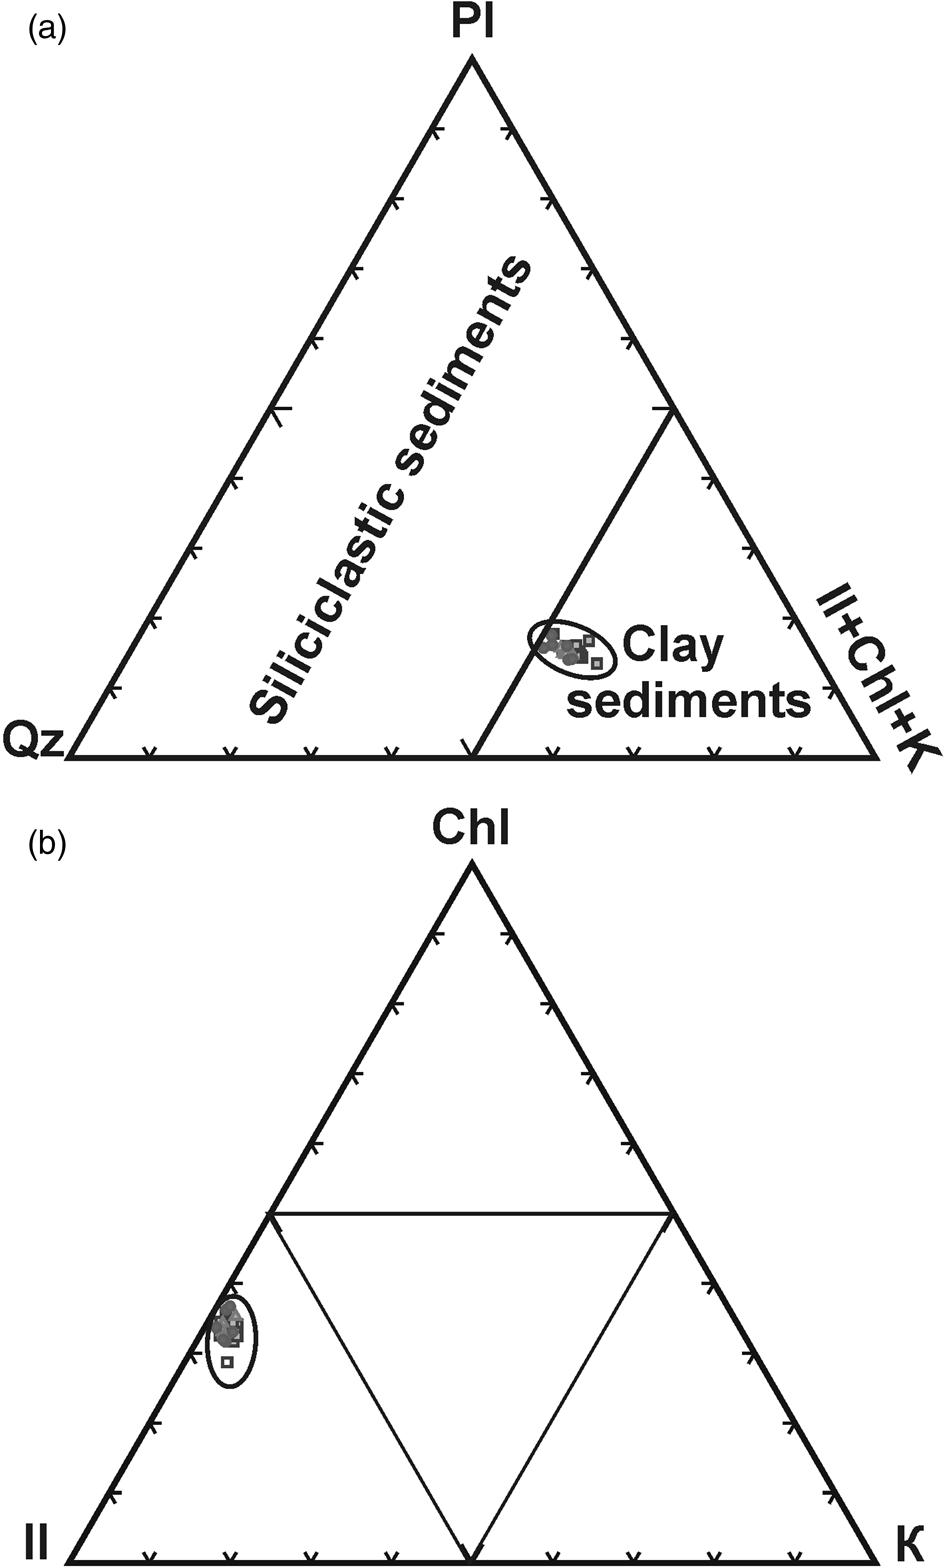
On triangular diagrams in the coordinates “quartz–plagioclase–sum of clay minerals” (Fig. 6a), as well as in coordinates “illite–chlorite–kaolinite” (Fig. 6b), all studied samples form a local area. This indicates both a homogeneous source of sedimentary material and a weak reaction of the mineral composition of these terrigenous siliciclastic clayey sediments to changes in sedimentation conditions over the last millennium. Minor down-core changes in mineral composition likely result from hydraulic differentiation of sedimentary material within the fjord in relation to glacial front shifts, sea-ice conditions, and water circulation (Supplementary File 3).
Triangular diagrams of mineral composition of sediments of core AMK-5428: (a) in coordinates: quartz (Qz)–plagioclase (Pl)–the sum of clay minerals; (b) in coordinates: illite (Il)–chlorite (Chl)–kaolinite (K). See also Supplementary Table 3.
Rare earth elements and yttrium
The down-core records of REY content were extremely uniform. The ratios of light REE to heavy ones, expressed as La/Yb and LREE/HREE, varied within a very narrow range, amounting to 10.5 ± 1.0 and 1.1 ± 0.1, respectively (Supplementary Table 5). The correlation between these ratios was high, as was evident from the accuracy of the approximation (R 2 = 0.78). The ratios indicate an intermediate position of the studied sediments between sandstones having high quartz content and shales. They also differed from the reference composition of shales (North American shale composite [NASC]; Gromet et al., Reference Gromet, Dymek, Haskin and Korotev1984) in their relatively low REY content due to the influence of clastic minerals. This conclusion is confirmed by the low total content of REE (ΣREE = 130 ± 5 ppm), which also corresponds to an intermediate position between sandstones and shales (Taylor and McLennan, Reference Taylor and McLennan1985). The studied sediments differed from NASC because of high europium anomaly (Eu/Eu* = 1.06 ± 0.2), which indicates a considerable contribution of plagioclase (Taylor and McLennan, Reference Taylor and McLennan1985). Thus, the composition of REY in core AMK-5248 largely reflects the mineral composition of sediments characterized by a mixture of clay minerals and clastic minerals in proportions close to 50/50, together with a high representation of quartz (28.8 wt%) and plagioclase (14.6 wt%) among the clastic group (Supplementary Table 3).
The REY composition curves, normalized to the average composition of NASC, roughly correspond to the composition of Holocene sediments of the Kara Sea (Fig. 7, Supplementary Table 5). Meanwhile, their distribution pattern and total REY content are in good agreement with the sediments of the southern part of the Novaya Zemlya Trough (Rusakov et al., Reference Rusakov, Kuz'mina, Тoropchenova and Zhilkina2018), which is a natural trap for sedimentary material carried by the eastern glaciers of Novaya Zemlya.
Range of composition values for rare earth elements and yttrium (REY) content in sediments of core AMK-5248 (highlighted darker; data from this work), as well as the clayey and clayey silty surface (0–2 cm) bottom sediments of Kara Sea and Novaya Zemlya Trough (highlighted lighter; Rusakov et al., Reference Rusakov, Kuz'mina, Тoropchenova and Zhilkina2018), normalized to the composition of the North American shale composite (NASC; Gromet et al., Reference Gromet, Dymek, Haskin and Korotev1984). The curve of average composition of core AMK-5248 is shown as a solid line. The curves of average composition of Kara Sea and Novaya Zemlya Trough are shown as dotted lines. See also Supplementary Table 5.
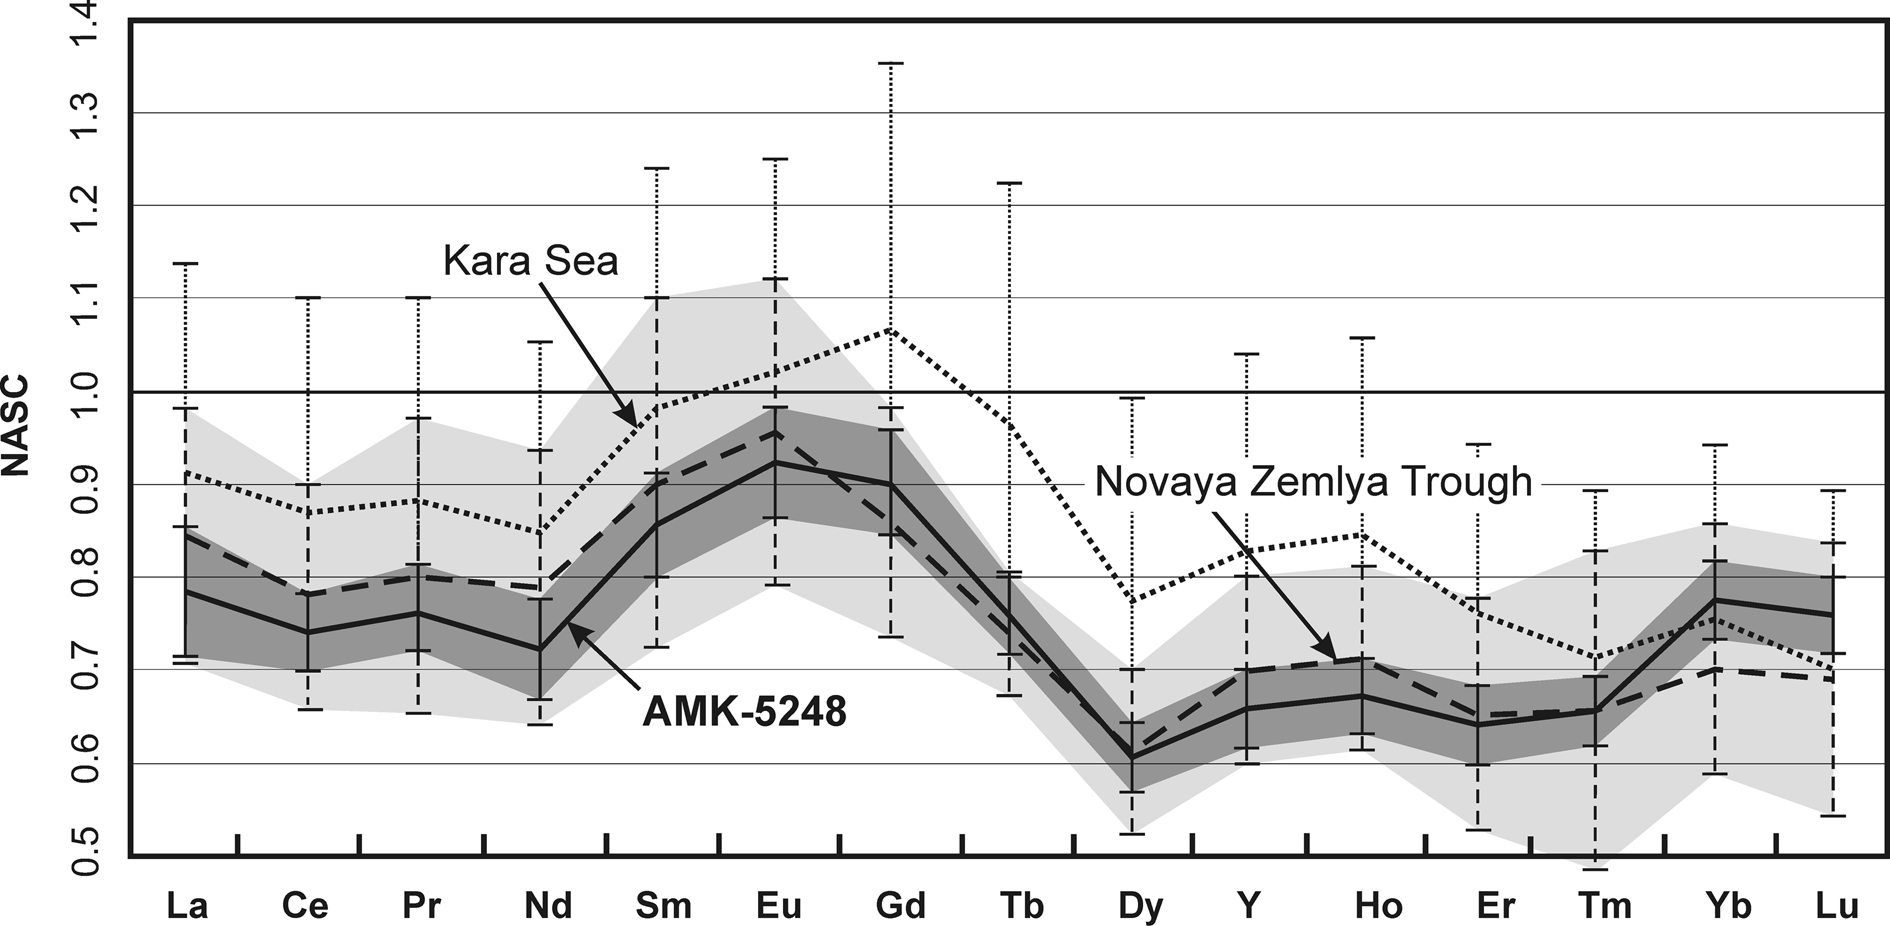
Similar to the mineral and chemical compositions, the uniform distribution of REY in core AMK-5248 indicates a single source of sedimentary material, that is, a Paleozoic (Ordovician–Permian) bedrock represented by terrigenous–marine sedimentary complex with thin layers of carbonates (Lopatin, Reference Lopatin1999).
DISCUSSION
Major glaciological factors affecting proximal glaciomarine sediment
From the point of view of lithologic facies analysis, the studied sediment core AMK-5248 belongs to proximal glaciomarine sediments accumulated in the immediate vicinity of the glacial front (Syvitski, Reference Syvitski1989; Ó Cofaigh and Dowdeswell, Reference Ó Cofaigh and Dowdeswell2001; Murdmaa et al., Reference Murdmaa, Polyak, Ivanova and Khromova2004; Polyak et al., Reference Polyak, Murdmaa and Ivanova2004; Meire et al., Reference Meire, Mortensen, Meire, Juul-Pedersen, Sejr, Rysgaard, Nygaard, Huybrechts and Meysman2017). In general, the use of the proximal glaciomarine sediments for paleoreconstructions has significant limitations, due to the relatively homogeneous composition of the sediments. As shown earlier, noticeable changes along the core are observed only for the grain-size and chemical composition of sediment (Figs. 4d and 5c, Supplementary Tables 2 and 4), while for the mineral and REY composition of sediment (Figs. 3 and 7, Supplementary Tables 3 and 5), they are almost invisible. Based on this, the major factor affecting the change in the sedimentation in the fjord is sedimentation rate, which indicates both a distance to the glacial front and glacial dynamics. In turn, these factors are determined, first of all, by the external glaciological factors (Meier and Post, Reference Meier and Post1969; Clarke, Reference Clarke1987; Eisen et al., Reference Eisen, Harrison and Raymond2001; Copland et al., Reference Copland, Sharp and Dowdeswell2003; Nesje and Dahl, Reference Nesje and Dahl2003; Matthews and Briffa, Reference Matthews and Briffa2005), which are highly dependent on changes in temperature and the amount of atmospheric precipitation. Ice temperature largely controls the speed of glacial ice movement, and the precipitation affects glacial mass-balance conditions. The cumulative effect of these two main factors will ultimately determine the intensity and composition of the sediment discharged into the fjord. Based on their combination, at least four scenarios for the development of depositional/environmental events are assumed. (1) Cooling combined with a decrease in atmospheric precipitation will contribute to a decrease in the dynamics of glacial ice movement, stabilization of the glacial front, and a decrease in the intensity of iceberg calving. (2) Cooling combined with an increase in atmospheric precipitation will contribute to an increase in the volume of an ice cap and a glacial frontal advance. Both scenarios are expressed in a decrease in sedimentation rates and accumulation of the finest sediment in the fjord. (3) Warming combined with a decrease in atmospheric precipitation will contribute to an active glacial frontal retreat, accompanied by an increase in meltwater runoff. Accordingly, (4) warming combined with an increase in atmospheric precipitation will initiate an active iceberg calving and an intense meltwater discharge. The last scenario assumes the highest sedimentation rates, accompanied by the accumulation of sediment of wide grain-size composition.
The internal glaciological factor influencing the sedimentation in the fjord is the rapid and short-term movement of the glacial ice (“surge”; Dowdeswell and Williams, Reference Dowdeswell and Williams1997; Eisen et al., Reference Eisen, Harrison and Raymond2001; Evans and Rea, Reference Evans, Rea and Evans2003; Grant et al., Reference Grant, Stokes and Evans2009). Despite the fact that the Goluboi tidewater glacier is not classified as a surge-type (Kotlyakov Reference Kotlyakov1978; Grant et al., Reference Grant, Stokes and Evans2009), periodic sandy and gravel–sand interlayers in core AMK-5248 (Fig. 2) may indicate short-term periods of rapid glacial movement accompanied by active iceberg calving.
Paleoreconstruction
Time period AD 1090 to AD 1600
The stratigraphical division of the core AMK-5248 based on the study of its grain-size and chemical composition (granulometric and chemical units; Figs. 4d and 5c) made it possible to identify the main stages of sedimentation history in the Oga Fjord. The earliest stage, according to the accepted age model (Fig. 2, Supplementary Table 1), dates back to the time period before AD 1600. The sediments of this time can be conditionally divided into two parts, accumulated before and after AD 1300. Stratified sediments accumulated before 1300 are characterized by a higher content of coarse fractions and the highest amount of IRD (Figs. 2 and 8). This period coincides in time with the warm Medieval Climate Anomaly (MCA). It should be noted that the stratified sediments are not traced higher along the core. This suggests this is the warmest period in the fjord's sedimentation history before AD 1300.
Subdivision of core AMK-5248, based on lithostratigraphy and chemostratigraphy (data from this work) and core ASV-987 (Murdmaa et al., Reference Murdmaa, Polyak, Ivanova and Khromova2004; Polyak et al., Reference Polyak, Murdmaa and Ivanova2004). SR, sedimentation rate.
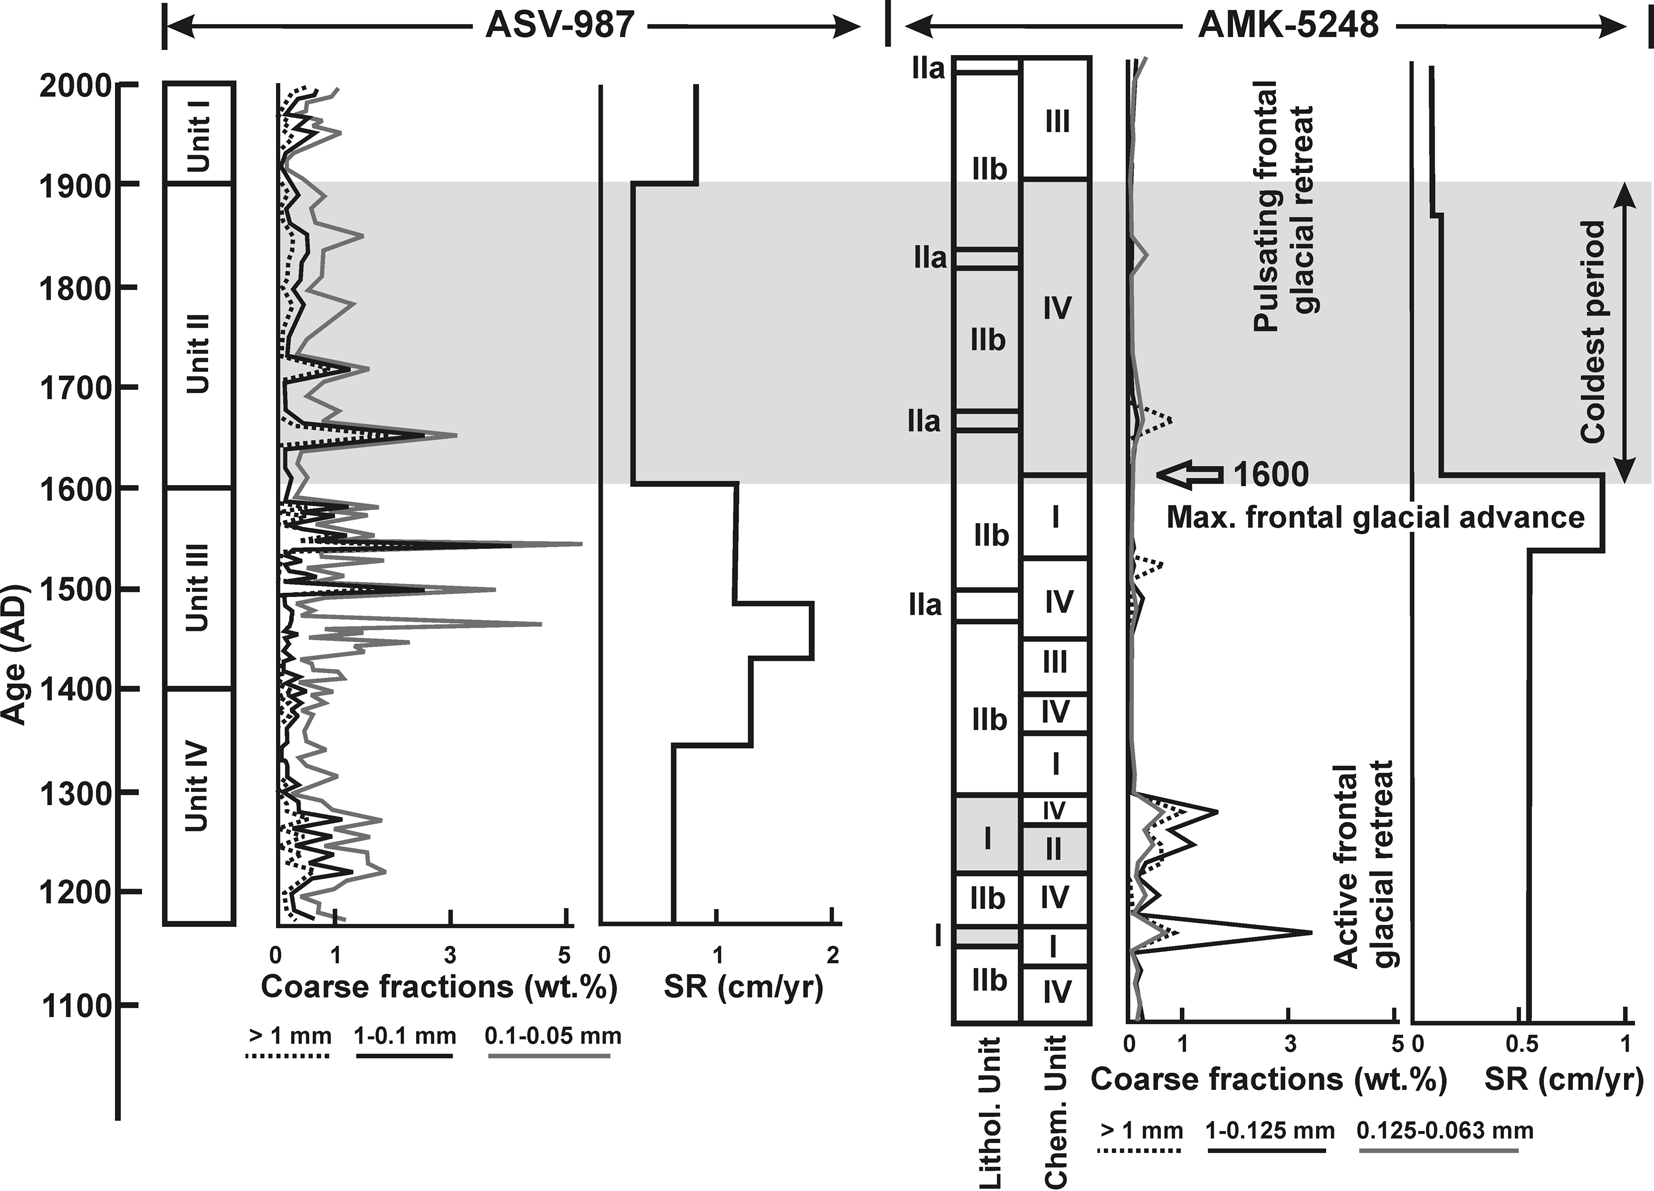
Sediments of GU IIb (clayey silt) predominated in core AMK-5248 (Fig. 4d, Supplementary Table 2). They alternated with sediments of GU IIa (silt) in the upper part of the core (0–180 cm; after AD 1495), whereas they alternated with sediments of GU I (IRD-enriched clayey silt) in its basal part (280–402 cm; before AD 1315). The time period before AD 1300 was characterized by high supply of coarse fractions (sand and gravel-sand; Fig. 2). CU II that coincides with the sediments of the IRD peak (300–312 cm, AD 1255–1275) points to a warming peak in the second half of the thirteenth century and the important role of elements such as Si, Ti, and Mg (Fig. 5b), indicating high content of quartz and other clastic minerals (Supplementary Files 2 and 3). In general, the warmest epoch before AD 1300 was characterized by a frontal glacial retreat accompanied by active meltwater discharge and iceberg calving in the Oga Fjord (Fig. 8).
The alternation of GU IIa and GU IIb in the upper part of the core points to an unstable hydrodynamic regime in the fjord after AD 1300, most likely associated with glacial dynamic instability. It is important to note that the outlined transition to a cooling, first of all, was reflected in the change in the chemical composition of sediment. Around AD 1275, CU II was replaced by CU IV (Fig. 5c). The change in grain-size composition occurs with a slight delay (Fig. 8). This indicates that changes in the chemical composition of the studied sediments are more sensitive to changes in sedimentation conditions.
Sediments accumulated after AD 1300 are characterized by a finer grain-size composition (Fig. 4d, Supplementary Table 2) and coincide in time with the gradual transition from the warm MCA to the cooling of the early Little Ice Age (LIA). During this period, the granulometric type of the sediment remains practically unchanged (GU IIb), except for the 160–182 cm horizon (AD 1495 to AD 1535), corresponding to the coarser GU IIa sediment (Fig. 4d). As mentioned earlier, the GU IIa sediment can be associated with a short-term surge event (Grant et al., Reference Grant, Stokes and Evans2009 and references therein). At the same time, the chemical composition of sediments varied widely (CU I, III, and IV; Fig. 5c, Supplementary Table 4), indicating short-term changes in sedimentation conditions. From the fine-grained sediment composition (GU IIb), in combination with the near absence of IRD, it is possible to assume severe sea-ice conditions during the entire fourteenth century. The relatively high Mn content in CU III (Fig. 5b) indicates a good aeration of the water column (Supplementary File 2), likely due to active vertical water circulation caused by the formation of brines when the seawater freezes.
Sedimentation rates before AD 1530 were around 0.55 cm/yr, but then sharply increased up to 0.86 cm/yr (Figs. 2 and 8), indicating the highest meltwater runoff carrying large amounts of the insoluble glacial matter into the fjord and/or the frontal glacial advance. A drastic increase in the sedimentation rate was also reflected in the change in the chemical composition of sediment (Figs. 5c and 8). The highest sedimentation rates are characterized by the accumulation of CU I sediments, reflecting the highest role of Ca and P (Fig. 5b, Supplementary File 2). The main source of Ca is clastic minerals such as Ca-rich plagioclase, ankerite, calcite, and dolomite (Supplementary Table 3), while the source of P is possibly insoluble organic matter discharged into the fjord by glacier.
Similar warm environmental conditions for the MCA (denoted as AD 1170 to AD 1400) were reconstructed in the Russkaya Gavan’ Fjord on the west coast of North Island facing the Barents Sea (Murdmaa et al., Reference Murdmaa, Polyak, Ivanova and Khromova2004; Polyak et al., Reference Polyak, Murdmaa and Ivanova2004). Sedimentation rates on the west coast were higher (1.0 cm/yr; Fig. 8), most likely due to the stronger dynamics of the western glaciers, which are influenced by Atlantic cyclones carrying a large amount of moisture. According to Glazovsky (Reference Glazovsky and Casey2003), the west coast of the archipelago receives 600 mm/yr more atmospheric precipitation than the east coast. There is also a difference in the snow accumulation pattern between glaciers located on the west and east coasts of North Island (Chizhov et al., Reference Chizhov, Koryakin, Davidovich, Kanevskii, Zinger, Bazheva, Bazhev and Khmelevskoi1968; Zeeberg and Forman, Reference Zeeberg and Forman2001; Polyak et al., Reference Polyak, Murdmaa and Ivanova2004). At AD 1380, the sedimentation rate in the Russkaya Gavan’ Fjord increased twofold to 1.3 cm/yr, and later, between AD 1434 and AD 1488, reached a maximum of 1.8 cm/yr (Fig. 8). Together with distinct coarse lamination, increase in silt to fine sand fraction content, and the presence of clay pellets, the sharp rise in sedimentation rates indicates a rapid frontal glacial advance and/or the highest meltwater runoff carrying large amounts of the insoluble glacial matter into the fjord during the fourteenth and fifteenth centuries.
The oxygen isotopes and Na content in the ice-core records of Svalbard, Franz Josef Land, and Severnaya Zemlya indicate three main stages of climate change in the Arctic during the eleventh to sixteenth centuries (Opel et al., Reference Opel, Fritzsche and Meyer2013). During the eleventh and twelfth centuries, in general, a warm climate prevailed. After AD 1300, an unstable climate with changeable atmospheric circulation is noted. Since the middle of the fifteenth century, the amount of atmospheric precipitation has increased, probably influencing the dynamics of the glacial ice movement and the frontal glacial advance on Novaya Zemlya. This is the main reason behind the dramatic increase in sedimentation rates in the fjords (Fig. 8).
Coldest time period AD 1600 to AD 1920
Around AD 1600 in the Oga Fjord, sedimentation rate decreases fourfold from 0.86 to 0.25 cm/yr (Figs. 2 and 8). The only explanation for such a drastic decrease in the supply of sedimentary material to the fjord is a significant slowdown or “stop” of the glacial movement caused by a sharp cooling in combination with a decrease in the amount of atmospheric precipitation. It should be noted that only a change in the chemical composition of the sediments is noted at this time. CU I is replaced by CU IV, reflecting the change in the leading role of Ca and P to Fe and K (Fig. 5b). Presumably, this reflects a slight increase in the proportion of K-rich minerals in sediments, such as potassium feldspar and illite, as well as Fe oxyhydroxides and hydrotroilite (Supplementary File 2). A change in the grain-size composition of sediment (GU IIa, silt with gravel-sandy material inclusions; Supplementary Table 2) is noted only at the horizon of 80–82 cm (AD 1685), that is, about 85 yr after the sharp decline in the sedimentation rate. This sediment coarsening could have been caused by a short-term frontal glacial advance into the fjord in combination with iceberg calving, which both followed its slowdown/stop glacial dynamics. The late LIA, after 1600 AD, stands out as the coldest period in the Oga Fjord, with the lowest glacial dynamics, almost no meltwater impact, and severe sea-ice conditions, as indicated by low sedimentation rates, no IRD, and predominantly fine-grained sediment (Fig. 8). Further, until the end of the nineteenth century, no significant changes were observe in either the grain-size or chemical composition of sediments, which indicates the stabilization of the coldest and driest climate during the late LIA.
A synchronous and drastic decrease in sedimentation rates is also noted in the Russkaya Gavan’ Fjord. After AD 1600, the sedimentation rates in core ASV-987 dropped threefold and remained low until the beginning of the twentieth century (Murdmaa et al., Reference Murdmaa, Polyak, Ivanova and Khromova2004; Polyak et al., Reference Polyak, Murdmaa and Ivanova2004; Fig. 8). A possible reason for such significant climatic changes, both on the east and west coasts of Novaya Zemlya, was the explosive eruption of the Huaynaputina volcano, AD 1600, in southern Peru (Thouret et al., Reference Thouret, Davila and Eissen1999). According to the chronicles, the eruption lasted from February 19 to March 6 and became the largest explosive eruption in historical times in the Andes. It is believed that this eruption could have caused great climatic changes during the LIA (Verosub and Lippman, Reference Verosub and Lippman2008; Witze, Reference Witze2008). According to Witze (Reference Witze2008), the eruption may have had a far wider effect, injecting sulfur particles high into the atmosphere and disrupting the climate worldwide. This is corroborated by tree-ring records showing that it was the coldest year in six centuries in the Northern Hemisphere (Verosub and Lippman, Reference Verosub and Lippman2008 and references therein). It could also have caused the Great Famine of AD 1601 to AD 1603 (Boguslavskiy, Reference Boguslavskiy2004), which led to the change of the ruling dynasties in Russia. In the Russian annals, it is written (Karamzin, Reference Karamzin1829; page 704): “In the spring of 1601, the sky was clouded with thick darkness and the rains poured incessantly for ten weeks … On August 15, a severe frost damaged the unripe bread (rye) and all the fruits.” Despite the fact that direct evidence of a connection between these events has not yet been found, the difference between them is only a year. The drastic decrease in sedimentation rates in the fjords of Novaya Zemlya that we discovered, which are synchronous with the described events of the eruption and famine, may be an additional fact confirming the influence of the eruption in Peru on the global climate.
The frontal retreat of the Goluboi tidewater glacier after its maximum progradation in the sixteenth century occurred in pulses, with periods of stabilization and short-term frontal glacial readvances (glacial surges; Grant et al., Reference Grant, Stokes and Evans2009), when the sediment composition became coarser (GU IIa; Figs. 4d and 8). Similar cold climatic conditions were reconstructed in the Russkaya Gavan’ Fjord during AD 1600 to AD 1900 (Murdmaa et al., Reference Murdmaa, Polyak, Ivanova and Khromova2004; Polyak et al., Reference Polyak, Murdmaa and Ivanova2004). Cold regional conditions were also clearly recorded in the oxygen isotopic composition of the ice core of Severnaya Zemlya, with a maximum in AD 1760 to AD 1800 followed by a gradual warming until the early twentieth century (Opel et al., Reference Opel, Fritzsche and Meyer2013). According to the Na content of this ice core, the most severe sea-ice conditions were recorded in the earliest nineteenth century. A similar pattern in the oxygen isotope composition changes characterizes ice-core records in Svalbard and Franz Josef Land (Opel et al., Reference Opel, Fritzsche and Meyer2013). Analysis of numerous proxy data sets revealed a general circum-Arctic summer cooling during the century-long period of AD 1766 to AD 1865, with the coldest decade being AD 1811 to AD 1820 (Werner et al., Reference Werner, Divine, Ljungqvist, Nilsen and Francus2018). Cold environmental conditions and the relatively stable position of the glaciers on Novaya Zemlya during the eighteenth and nineteenth centuries were coeval with frontal glacial advances in western Norway and Svalbard (Nesje and Dahl, Reference Nesje and Dahl2003; Mangerud and Landvik, Reference Mangerud and Landvik2007; Nesje et al., Reference Nesje, Dahl, Thun and Nordli2008; Majewski et al., Reference Majewski, Szczuciński and Zajączkowski2009). Mean surface atmospheric circulation in the Kara Sea region facilitates the transport of continental air masses with a low amount of moisture (Moore, Reference Moore2013; Dubinina et al., Reference Dubinina, Chizhova, Kossova, Avdeenko and Miroshnikov2020). As a result, the Novaya Zemlya glaciers experience a precipitation deficit compared with Svalbard, which is more strongly influenced by humid Atlantic cyclones. However, this also might have been a result of the shift in the tracks of winter cyclones during the late LIA (Zeeberg and Forman, Reference Zeeberg and Forman2001; Nesje and Dahl, Reference Nesje and Dahl2003; Matthews and Briffa, Reference Matthews and Briffa2005; Nesje et al., Reference Nesje, Dahl, Thun and Nordli2008; Luoto and Helama, Reference Luoto and Helama2010; D'Andrea et al., Reference D'Andrea, Vaillencourt, Balascio, Werner, Roof, Retelle and Bradley2012).
Time period AD 1920 to AD 2015
The warming in the early twentieth century is characterized only by a change in the chemical composition in the AMK-5248 core (Figs. 5c and 8). The CU III sediment reflects the leading role of Mn and Al (Supplementary File 2), indicating an increase in aeration of the water column and an increase in role of clay minerals in sediment, respectively. In turn, the aeration reflects the conditions of the fjord's prolonged seasonal opening from sea ice, and the accumulation of clay minerals could be explained by the glacial front's distant position from sampling site. Perhaps position of the glacier in retreat was partially retained after the previous cold eighteenth and nineteenth centuries and later enhanced by active thinning occurring during the twentieth century. Sediment coarsening was noted only for the upper 2 cm of the core (GU IIa; Supplementary Table 2), dated AD 2000 to AD 2015 (Table 1). It is possible that the change in the grain-size composition of sediment is associated with an increase in the amount of atmospheric precipitation and a steady rise in surface air temperatures over the past decades.
In the Russkaya Gavan’ Fjord, warming and active glacial thinning are reconstructed on the basis of an increase in sedimentation rates, growing bioproductivity, and two pronounced stable isotope minima during the early twentieth century and recently (Murdmaa et al., Reference Murdmaa, Polyak, Ivanova and Khromova2004; Polyak et al., Reference Polyak, Murdmaa and Ivanova2004). Although the climatically induced environmental changes on the east and west coasts of Novaya Zemlya are almost synchronous, sedimentation rates are higher in the west. This is likely the result of the climate on the Kara Sea coast being the colder and drier than on the maritime Barents Sea coast. The last 100 yr were generally characterized by rapid widespread warming in the Arctic and subarctic regions (Kaufman et al., Reference Kaufman, Schneider, McKay, Ammann, Bradley, Briffa and Miller2009; PAGES 2k Consortium, 2013). In the ice-core records of Severnaya Zemlya, warming is indicated by the absolute maximum surface air temperatures, manifested by positive shifts in oxygen isotope composition and highest Na content, especially in the early twentieth century (Opel et al., Reference Opel, Fritzsche and Meyer2013). Matusevich and Sokolov (Reference Matusevich and Sokolov1927), in their monograph Novaya Zemlya, describe the results of the geographic exploration of the east coast of Novaya Zemlya. Although they do not provide the data on glacial front positions and sea-ice regime, they state that, until the 1920s, the exploration of the Kara Sea was only possible with an icebreaker. Nowadays, summer expeditions to the Kara Sea are conducted on ships of a non- icebreaker class. This clearly indicates rapid climate change and summer sea-ice loss.
CONCLUSIONS
Based on the proximal glaciomarine sediment records in the sedimentation history of the Oga Fjord, at least four depositional/environmental periods have been distinguished during the last millennium. The earliest period, before AD 1300, was characterized by the warmest epoch of Novaya Zemlya, accompanied by active frontal glacial retreat, active meltwater discharge, and iceberg calving.
This was followed by a period of paleoenvironmental instability, with a changeable climate between AD 1300 and AD 1600, and it coincides in time with the gradual transition from the warm MCA to the cooling of the early LIA. At the end of this period, AD 1530 to AD 1600, a sharp increase in sedimentation rates is noted, due to an increase in atmospheric precipitation, the intensified dynamics of the glacial ice movement, and the frontal glacial advance on Novaya Zemlya.
The beginning of the seventeenth century is marked by a drastic decrease in sedimentation rates in the fjords, both on the east and west coasts of Novaya Zemlya. This event coincides in time with the largest explosive eruption in historical times of the Huaynaputina volcano in the Andes and the Great Famine (AD 1601 to AD 1603) in Russia. The late LIA, after 1600 AD, stands out as the coldest period in the Oga Fjord, with the lowest glacial dynamics, almost no meltwater impact, and severe sea-ice conditions, as indicated by low sedimentation rates, no IRD, and predominantly fine-grained sediment. At the same time, the coldest period was characterized, in general, by frontal glacial retreat occurring in pulses, with periods of stabilization and short-term frontal glacial readvances. The main reason for this retreat was apparently the systemic deficit of atmospheric precipitation due to a change of atmospheric circulation pattern and a shift in the tracks of winter cyclones.
The last 100 yr were characterized by warming and active glacial thinning. In the Oga Fjord, warming was recorded as sediment coarsening, especially in the first decade of the twenty-first century, possibly due to an increase in the amount of atmospheric precipitation and a steady rise in surface air temperatures.
Supplementary Material
The supplementary material for this article can be found at https://doi.org/10.1017/qua.2021.74
Acknowledgments
The authors express their deep gratitude to the crew of the RV Akademik Mstislav Keldysh, especially to the head of the expedition, Аcademician Mikhail V. Flint, for the assistance in obtaining scientific material, Larisa A. Zadorina for sample processing, and Alexey M. Asavin for assistance in computer data processing.
Financial Support
This research was supported by the Russian Foundation for Basic Research (RFBR grant no. 18-05-00032) and state assignment GEOKHI RAS.