



INTRODUCTION
Chagas disease (CD) is a serious public health problem which currently affects about 7·7 million people, mainly in the poorest endemic rural areas in Latin America (World Health Organization, 2010). It is caused by the protozoan parasite Trypanosoma cruzi, which is transmitted by blood-feeding triatomine bugs. Although the transmission of CD has been controlled in several endemic countries, the prevalence of chronic T. cruzi infections in non-endemic areas, such as the USA, Japan and Europe has increased substantially in the past 20 years, mainly due to blood transfusion from infected immigrants (Gascon et al. Reference Gascon, Albajar, Canas, Flores, Gomez i Prat, Herrera, Lafuente, Luciardi, Moncayo, Molina, Munoz, Puente, Sanz, Trevino and Sergio-Salles2007; Bern and Montgomery, Reference Bern and Montgomery2009; Perez-Molina et al. Reference Perez-Molina, Norman and Lopez-Velez2012). The disease is clinically divided into acute and chronic phases. The initial acute phase lasts 8–10 weeks and is followed by a chronic phase, which is divided into indeterminate, cardiac, digestive or cardio-digestive forms. The indeterminate form is characterized by reactive serology and/or demonstration of the parasite in the blood and also by the absence of clinical and pathological manifestation of heart and/or digestive disorders. Around 30% of infected individuals progress to disease associated with cardiac and/or digestive disorders (Bilate and Cunha-Neto, Reference Bilate and Cunha-Neto2008). The cardiac form, named chronic chagasic cardiomyopathy (CCC), is the most threatening and frequent manifestation of chronic CD (Rassi et al. Reference Rassi, Rassi and Little2000). CCC is characterized by severe myocarditis, T cell-rich lymphomononuclear infiltrates (Reis et al. Reference Reis, Gazzinelli, Gazzinelli and Colley1993; Brener and Gazzinelli, Reference Brener and Gazzinelli1997), interstitial fibrosis (Rossi, Reference Rossi1991; Prata, Reference Prata2001), autonomic dysfunction (Ribeiro et al. Reference Ribeiro, Moraes, Ribeiro, Ferlin, Torres, Oliveira and Rocha2001) and cardiomyocyte hypertrophy that can lead to dilated cardiomyopathy, end-stage heart failure and sudden death (Prata et al. Reference Prata, Lopes and Chapadeiro1986; Ribeiro et al. Reference Ribeiro, Moraes, Ribeiro, Ferlin, Torres, Oliveira and Rocha2001).
Several hypotheses have been proposed to account for the pathogenesis of CCC; among these are parasite persistence in target tissues (Higuchi, Reference Higuchi1995) and autoimmune events (Cunha-Neto et al. Reference Cunha-Neto, Bilate, Hyland, Fonseca, Kalil and Engman2006). The parasite persistence theory affirms that tissue parasitism is directly related to tissue damage and would be a prerequisite for the development of CCC. The relatively low number of parasites in the myocardium and the presence of auto-reactive antibodies (Ab) support the autoimmune theory. These Ab can be derived by molecular mimicry between parasite and host antigens or by antigen exposure due to cardiac damage (Cossio et al. Reference Cossio, Diez, Szarfman, Kreutzer, Candiolo and Arana1974; Kierszenbaum, Reference Kierszenbaum1985; Leon and Engman, Reference Leon and Engman2003; Iwai et al. Reference Iwai, Juliano, Juliano, Kalil and Cunha-Neto2005). The emergence of these Ab can be responsible for the destruction of cardiac conduction tissues and cardiac autonomic nerves observed during the chronic state of the disease (Koberle, Reference Koberle1970; Thiers et al. Reference Thiers, Barbosa, Pereira Bde, Nascimento, Nascimento, Medei and Pedrosa2012).
Several authors have reported the presence of circulating Ab in the sera of animals and patients affected by CCC (de Oliveira et al. Reference de Oliveira, Pedrosa, Nascimento, Campos de Carvalho and Masuda1997; Labovsky et al. Reference Labovsky, Smulski, Gomez, Levy and Levin2007; Hernandez et al. Reference Hernandez, Nascimento, Chaves, Costa, Masuda, Kurtenbach, Campos and Gimenez2008) and dilated cardiomyopathy (Jahns et al. Reference Jahns, Boivin, Siegmund, Inselmann, Lohse and Boege1999, Reference Jahns, Boivin, Hein, Triebel, Angermann, Ertl and Lohse2004; Stork et al. Reference Stork, Boivin, Horf, Hein, Lohse, Angermann and Jahns2006; Dandel et al. Reference Dandel, Wallukat, Potapov and Hetzer2012). These Ab are able to interact with the second extracellular loop of G-protein coupled receptors, such as β 1 and β 2 adrenergic (anti-β 1-AR and anti-β 2-AR, respectively) and muscarinic cholinergic receptors of the myocardium (anti-M2-CR) (Wallukat et al. Reference Wallukat, Wollenberger, Morwinski and Pitschner1995; Elies et al. Reference Elies, Ferrari, Wallukat, Lebesgue, Chiale, Elizari, Rosenbaum, Hoebeke and Levin1996; Jahns et al. Reference Jahns, Boivin, Siegmund, Inselmann, Lohse and Boege1999; Escobar et al. Reference Escobar, Fernandez-Gomez, Peter, Mobini, Hoebeke and Mijares2006) and ultimately lead to receptor activation (Iwata et al. Reference Iwata, Yoshikawa, Baba, Anzai, Mitamura and Ogawa2001; Feldman et al. Reference Feldman, Carnes, Abraham and Bristow2005). The presence of such functionally active, receptor-stimulating Ab is associated with a markedly worse prognosis in dilated cardiomyopathy (Schulze et al. Reference Schulze, Kunze and Wallukat2005). The continuous stimulation of the receptors by the Ab could induce desensitization and/or down-regulation of the receptor, explaining the progressive loss of function and consequent autonomic disturbance observed in CD patients (Sterin-Borda and Borda, Reference Sterin-Borda and Borda2000). In fact, the presence of muscarinic cholinergic receptor activating antibodies in patients’ sera have been shown to induce complex cardiac arrhythmias and AV conduction block in isolated rabbit hearts (de Oliveira et al. Reference de Oliveira, Pedrosa, Nascimento, Campos de Carvalho and Masuda1997). Ribeiro et al. (Reference Ribeiro, Gimenez, Hernandez, de Carvalho, Teixeira, Guedes, Barros, Lombardi and Rocha2007) showed that vagal impairment, evidenced by reduced indexes of heart rate variability (HRV), occurs early in the course of infection, i.e. before the appearance of left ventricle (LV) dysfunction, and that it is correlated to the levels of anti-M2-CR Ab. Circulating auto-antibodies with partial muscarinic cholinergic agonistic activity have also been found in CD patients in the indeterminate form, in the absence of ECG and X-ray alterations (Borda and Sterin-Borda, Reference Borda and Sterin-Borda1996). Together, these data suggest that the circulating reactive Ab can have a causal role in the cardiac alterations and dysautonomia observed in Chagasic patients.
To investigate more rigorously the relation between the presence of the Ab and the occurrence of cardiac disturbances, and the influence of the host in disease pathogenesis in the present report we: (a) investigated using ELISA the time-course of anti-β 1-AR, anti-β 2-AR and anti-M2-CR Ab appearance in the sera of C3H/He T. cruzi-infected mice in the acute and chronic phases of the disease and (b) determined the levels of reactivity to β 1-AR, β 2-AR and M2-CR of the serum of chronically infected C3H/He and C57BL/6 mice and their correlation to cardiac function evaluated by histopathological alterations, echocardiography (ECHO), electrocardiography (ECG) and heart rate variability indexes (HRV).
MATERIALS AND METHODS
Animals and parasite infection
All experiments were performed with 5–7-week-old female C3H/He (H-2K) or C57BL/6 (H-2) mice from our animal facilities (CECAL, Oswaldo Cruz Foundation, Rio de Janeiro, Brazil). The animals were maintained under standard conditions and treated according to institutional guidelines regarding ethics of animal usage (CEUA-Fiocruz, protocol #161/03). Mice were infected intraperitoneally with 100 blood trypomastigote forms of the low virulence T. cruzi Colombian strain isolated from a Colombian chagasic patient obtained by serial passages from mouse to mouse (Marino et al. Reference Marino, da Silva, dos Santos, Pinto, Gazzinelli, Teixeira and Lannes-Vieira2004). Parasitaemia was estimated from 5 μL of tail vein blood and established as a parameter for acute and chronic phases (dos Santos et al. Reference dos Santos, Roffe, Santiago, Torres, Marino, Paiva, Silva, Gazzinelli and Lannes-Vieira2001). Analyses in the acute phase were done at 30 and 60 days post infection (dpi) and included histopathology and ELISA; while the chronic phase analyses (120–150 dpi) included histopathology, ELISA, ECG, ECHO and HRV indexes (see descriptions below).
Histopathology
Left ventricles (LV) were excised and fixed in 10% buffered formalin, embedded in paraffin and sectioned. The sections were stained with haemotoxylin and eosin (H&E) and with picrosirius and evaluated by light microscopy.
Anti-β1-AR, anti-β2-AR and anti-M2-CR Ab detection
ELISA plates were coated with 20 μg mL−1 of synthetic peptides comprising the second extracellular loops of the β 1, β 2 or M2 cardiac receptors (Ribeiro et al. Reference Ribeiro, de Carvalho, Lombardi, Talvani, Teixeira and Rocha2010; Daliry et al. Reference Daliry, Caldas, de Figueiredo Diniz, Torres, Talvani, Bahia and Campos de Carvalho2014) in 0·1 m Na2CO3 or buffer alone for 16 h at 4 °C. After saturation of the wells with PBS/0·1% Tween/2% BSA, mouse sera from control or from infected animals were diluted 1:100 in PBS/0·05% Tween and added to the wells. After incubation for 2 h at room temperature (RT), bound antibodies were detected by a secondary anti-mouse IgG antibody labelled with peroxidase, diluted 1:5000 in PBS/0·1% Tween/2% BSA. Between each step, plates were washed 4× with PBS/0·05% Tween. Afterwards, 100 μL of TMB substrate solution was dispensed into the wells. The plates were covered and incubated for 5 min at RT, in a dark room. The enzyme reaction was stopped by addition of 100 μL stop solution (1 N HCL) to each well. The absorbance was read at 450 nm. ELISA values were expressed as the ratio (R) between the optical densities (OD) determined for each sample and cut-off values. Cut-off was the mean OD of non-infected animals plus 2 standard deviations (s.d.). Positivity was defined as R>1·2 (Daliry et al. Reference Daliry, Caldas, de Figueiredo Diniz, Torres, Talvani, Bahia and Campos de Carvalho2014).
Electrocardiography
For the analysis of P duration, PR interval, QRS duration and QTc in the infected animals during the chronic phase the following methodology was used: all mice were intraperitoneally injected with diazepam (10 mg kg−1) and the electrodes were carefully placed subcutaneously according to the chosen preferential derivation (DII). ECGs were recorded for at least 2 min using a digital system Power Lab 2/20 that was connected to a bio-amplifier (PanLab Instruments, Barcelona, Spain). Filters were standardized to 0·1–100 Hz and traces were analysed using the Scope software for Windows V3.6.10 (PanLab Instruments, Barcelona, Spain). Heart rate (HR) (in beats per minute, bpm) and duration of P wave, QRS, PR and QT intervals (in milliseconds, ms) were measured. The relationship between the QT interval and the RR interval in the mouse was assessed in all animals. To obtain physiologically relevant values for the heart rate-corrected QT interval (QTc) in units of time (rather than time to a power that is not equal to 1), the observed RR interval (RR0) was first expressed as a unitless multiple of 100 ms, yielding a normalized RR interval, RR100 = RR0/100 ms. Next, the value of the exponent (y) in the relationship QT0 = QTc×RR100 y was assessed, with QT0 indicating the observed QT (in ms) and the unit for QTc being milliseconds. The natural logarithm was computed for each side of this relationship [ln (QT0) = In (QTc)+y ln (RR100)]. Thus, the slope of the linear relationship between the log-transformed QT and RR100 defined the exponent to which the RR interval ratio should be raised to correct QT for HR (Silverio et al. Reference Silverio, Pereira, Cipitelli Mda, Vinagre, Rodrigues, Gazzinelli and Lannes-Vieira2012).
For the analysis of the HRV indexes the ECG recordings used were acquired based on the following methodology: recording was carried out in conscious animals by a non-invasive method. Electrodes were positioned in DI derivation and connected by flexible cables to a differential AC amplifier (model 1700, A-M Systems, USA), with signal low-pass filtered at 500 Hz and digitized at 1 kHz by a 16-bit A/D converter (Minidigi 1-D, Axon Instruments, USA) using Axoscope 9.0 software (Axon Instruments, USA). Data were stored in a PC for offline processing.
Transthoracic echocardiography (ECHO)
For analysis of cardiac function, mice were anaesthetized with 1·5% isoflurane in 100% O2, trichotomized in the precordial region and examined with a Vevo 770 ultrasound apparatus from Visual Sonics (Canada) coupled to a 30 MHz transducer. Left ventricular ejection fractions (LVEF) were determined using Simpson's method, and left and right ventricular area (LV and RV) were obtained in B-mode using a short axis view at the level of the papillary muscles.
HRV indexes
For HRV analyses, stable 60 s segments were extracted from 180s ECGs acquired in the conscious state, and, in order to allow for a more accurate R wave peak detection process, all signals were resampled by cubic spline interpolation at 10 kHz. Baseline drift was subtracted from the 10 kHz ECG signals and, after R wave peak detection, 60 s tachograms were generated, containing all heart period fluctuations within this time segment. In the time domain, the following indexes were obtained: HR, standard deviation of the RR intervals (SDNN) and square root of the mean squared differences of successive RR intervals (RMSSD). For spectral (frequency domain) analysis of HRV, beat-by-beat HR time series were resampled to equal intervals by the spline cubic interpolation method, at 20 Hz, and the linear trend was removed. Power spectrum was obtained using a fast Fourier transform-based method (Welch's periodogram: 512 points, 50% overlap and Hanning window), and high-frequency power (HF: 1–8 Hz) was estimated as the area under the spectrum within this frequency range, being expressed as ln bpm2.
Statistical analysis
Data are expressed as mean±s.d. Analysis was performed using GraphPrism (GraphPad, San Diego, CA, USA). Comparison between groups was carried out by analysis of variance (ANOVA) followed by Bonferroni's post-test or Student's t-test were indicated. Probability values were considered significant when P<0·05.
RESULTS
Figure 1a shows the experimental design of the present study. We first evaluated the number of mononuclear cells in the myocardium of T. cruzi-infected-C3H/He mice during the course of infection (Fig. 1b and d) and in chronically infected C57BL/6 mice (Fig. 1c and e). During the acute infection (30 dpi), we detected intense mononuclear inflammatory infiltrates in the myocardium of C3H/He mice. These inflammatory infiltrates persisted at 60 dpi and decreased in intensity in the chronic phase of infection, although were still significantly higher than non-infected controls (Fig. 1b and d). A similar increase in inflammatory infiltrates was observed in chronically infected C57BL/6 mice (Fig. 1c and e) when compared with C3H/He mice at the same stage of infection.
Histopathological analysis of the cardiac tissue of T. cruzi-infected mice. Panel (a) shows the general scheme of the study; (b) representative photomicrography of left ventricle of T. cruzi-infected C3H/He mice showing mononuclear inflammatory cells (Bar = 50 μm); (c) representative photomicrography of left ventricle of T. cruzi-infected C57BL/6 mice at the chronic phase showing mononuclear inflammatory cells (scale bar = 50 μm); (d) quantification of the number of mononuclear inflammatory cells of left ventricle of T. cruzi-infected C3H/He mice at 30, 60 and 120–150 days post infection (d.p.i.) and (e) quantification of the number of mononuclear cells of left ventricle of T. cruzi-infected C57BL/6 mice at 120–150 d.p.i. Data are represented as mean±s.d. ***P<0·001 vs non-infected (NI) group, ### P<0·001 vs 30 dpi, §§§ P<0·001 vs 60 dpi. Abbreviations: Electrocardiography (ECG), echocardiography (ECHO) and heart rate variability analyses (HRV).

The fibrotic area was evaluated by collagen deposition (picrosirius staining), which in T. cruzi-infected C3H/He mice showed a significant increase in the acute and chronic phases of infection (Fig. 2a and b). The percentage of picrosirius positive area was higher at 60 dpi in C3H/He infected mice (Fig. 2b). In chronically infected C57BL/6 mice, there was also a significant increase in fibrotic area in comparison with non-infected controls (Fig. 2c and d).
Histopathological analysis of fibrotic area of cardiac tissue of T. cruzi-infected mice stained with picrosirius red: (a) representative photomicrography of left ventricle of T. cruzi-infected C3H/He mice showing fibrotic area; (b) quantification of the fibrotic area of the T. cruzi-infected C3H/He mice at 30, 60 and 120–150 d.p.i.; (d) representative photomicrography of left ventricle of T. cruzi-infected C57BL/6 mice at the chronic phase showing fibrotic area and (e) quantification of the fibrotic area of left ventricle of T. cruzi-infected C57BL/6 mice at 120–150 d.p.i. Data are represented as mean±s.d. ***P<0·001 vs non-infected (NI) group, +++ P<0·001 vs 30 dpi, §§§ P<0·001 vs 60 dpi.

We then analysed the ECG alterations induced by T. cruzi infection in the chronic phase in both mouse strains (Fig. 3a–d). Trypanosoma cruzi-infected C3H/He mice showed a substantial increase in P wave and QRS duration, and prolonged PR and QTc intervals (Fig. 3a, b, c and –d, respectively). In contrast, C57BL/6 mice only showed a significant increase in P wave duration and PR interval (Fig. 3a and b, respectively).
Electrocardiographic analyses of T. cruzi-infected C3H/He and C57BL/6 mice: (a) P duration (ms); (b) PR interval (ms); (c) QTc (ms) and (d) QRS duration (ms). ***P<0·001 vs non-infected (NI) group, **P<0·01 vs NI group and *P<0·05 vs NI group.

The analyses of HRV of chronically T. cruzi- infected C3H/He mice showed no alteration in any of the evaluated parameters (Fig. 4a–d), while infected C57BL/6 mice showed significantly lower values of many components of HRV: HR (Fig. 4a), SDNN (Fig. 4b), RMSSD (Fig. 4c) and HF (Fig. 4d).
Heart rate variability (HRV) analysis of T. cruzi-infected C3H/He and C57BL/6 mice: (a) Heart rate (bpm); (b) standard deviation of NN intervals (SDNN) (ms); (c) root mean square of successive differences (RMSSD) (ms) and (d) HF power (ln bpm2). ***P<0·001 vs non-infected (NI) group, **P<0·01 vs NI group and *P<0·05 vs NI group.

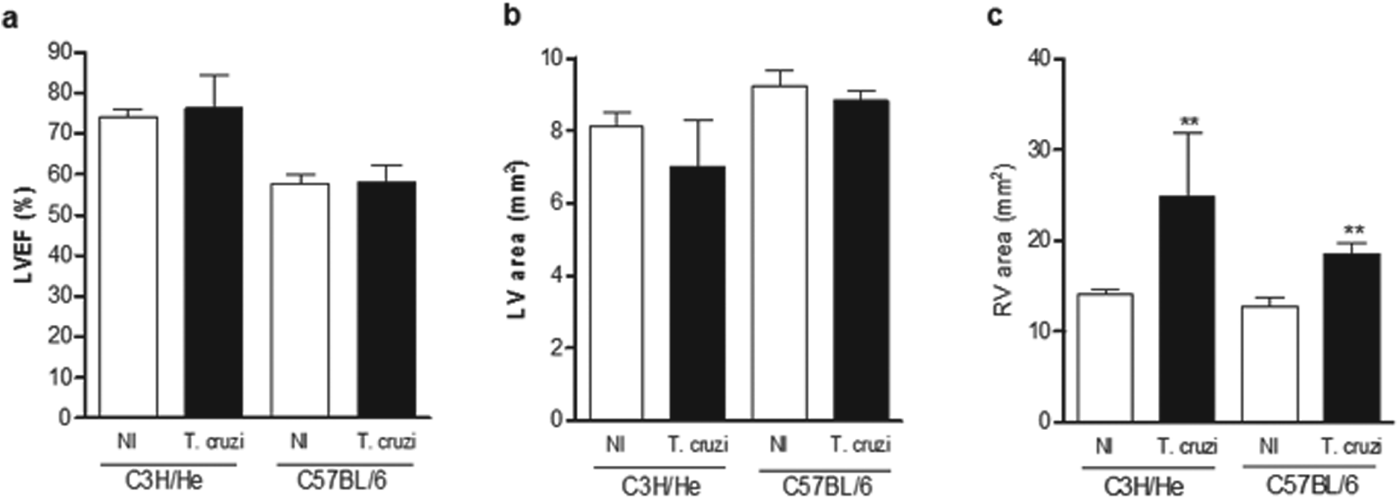
The echocardiogram analyses were performed in chronically infected mice from both lineages (Fig. 5a–c). The LVEF and left ventricular area (LV) were not affected by T. cruzi-infection in mice of both lineages (Fig. 5a and b, respectively), but there was a significant enlargement of the right ventricle in chronically infected C3H/He and C57BL/6 mice (Fig. 5c).
Cardiac function assessed by echocardiogram of T. cruzi-infected C3H/He and C57BL/6 mice: (a) Percentage of left ventricle ejection fraction (% LVEF); (b) left ventricle area (mm2) and (c) right ventricle area (mm2). **P<0·01 vs non-infected (NI) group.
We further analysed the anti-β 1-AR, anti-β 2-AR and anti-M2-CR Ab titres of C3H/He infected mice during the course of infection (Fig. 6a–c, respectively). Significantly higher levels of anti-β 1-AR Ab were detected only in the chronic phase in C3H/He mice (Fig. 6a). However, much higher levels of anti-β 2-AR and anti-M2-CR Ab were observed in the acute phase (30 dpi), diminishing to non-significant levels at 60 dpi and increasing again in the chronic phase (Fig. 6b and c). Analyses of Ab titres in C57BL/6 mice were performed only in the chronic phase of infection (Fig. 6a–c). There were no differences in anti-β 1-AR and anti-β 2-AR Ab titres in T. cruzi-infected C57BL/6 mice when compared with the non-infected group (Fig. 6a and b, respectively), but anti-M2-CR Ab titres were higher in T. cruzi-infected C57BL/6 mice when compared with their respective non-infected controls (Fig. 6c). Comparing Ab titres in T. cruzi-infected mice of both mouse lineages in the chronic phase all three Ab evaluated, namely anti-β 1-AR, anti-β 2-AR and anti-M2-CR, presented significantly higher prevalence in infected C3H/He mice when compared with C57BL/6 (Fig. 6a–c).
Autoantibodies titres evaluated by ELISA during the course of infection of T. cruzi-infected C3H/He and C57BL/6 mice: (a) anti-β 1-AR antibodies titres of C3H/He and C57BL/6 non-infected and infected mice; (b) anti-β 2-AR autoantibodies titres of C3H/He and C57BL/6 non-infected and infected mice and (c) anti-M2-CR autoantibodies titres of C3H/He and C57BL/6 non-infected and infected mice. ***P<0·001 vs non-infected (NI) group, **P<0·01 vs NI group and ϕϕϕ P<0·001 vs C57BL/6 infected group.

DISCUSSION
The physiopathology of Chagas disease, particularly with regard to chagasic cardiomyopathy, is very complex and not completely understood. It is well accepted that the balance between parasite invasiveness and the host immune response plays a major role in the development and evolution of the acute and chronic manifestations of CD. Additionally the presence of auto-reactive antibodies that recognize cardiac epitopes adds even more complexity to the disease. However, the exact contribution of each of the components of the disease – parasite invasiveness, inflammatory responses and autoimmunity – is difficult to evaluate, especially in human patients. Trying to help understand this issue, we infected two different lineages of mice – C3H/He and C57BL/6 – with the same T. cruzi strain and the same number of parasites, and evaluated heart morphology and function, HRV indexes and their relation to anti-muscarinic and anti-adrenergic Ab levels.
During the chronic phase, cardiac inflammatory infiltrates, fibrotic area deposition and echocardiogram parameters in both lineages presented similar patterns in response to parasite infection. ECG analyses showed prolonged P wave and PR interval in infected mice of both lineages, which is a common finding in experimental infection and in human patients with CD (Williams-Blangero et al. Reference Williams-Blangero, Magalhaes, Rainwater, Blangero, Correa-Oliveira and Vandeberg2007; Eickhoff et al. Reference Eickhoff, Lawrence, Sagartz, Bryant, Labovitz, Gala and Hoft2010). Interestingly, QRS and corrected QT (QTc) intervals significantly increased only in infected C3H/He mice. The differences in ECG abnormalities between the mouse lineages infected with the same T. cruzi strain shown here, suggest that the degree of electrical cardiac dysfunction is dependent not only on the T. cruzi strain (Eickhoff et al. Reference Eickhoff, Lawrence, Sagartz, Bryant, Labovitz, Gala and Hoft2010; Daliry et al. Reference Daliry, Caldas, de Figueiredo Diniz, Torres, Talvani, Bahia and Campos de Carvalho2014) but also on the host genetic background.
We next detected the presence and titres of anti-β 1-AR, β 2-AR and M2-CR Ab in the sera of the infected animals. We found that anti-β 1, anti-β 2 and anti-M2 Ab titres were higher in chronically infected C3H/He mice than in C57BL/6 mice and non-infected controls, while only anti-M2 titres were significantly high in infected C57BL/6 animals when compared with non-infected controls. Since the number of ECG alterations was higher in infected C3H/He mice, our findings suggest that the degree of ECG abnormalities could be related to the presence of circulating levels of those Ab. This hypothesis is reinforced by our previous study with T. cruzi-infected dogs (Daliry et al. Reference Daliry, Caldas, de Figueiredo Diniz, Torres, Talvani, Bahia and Campos de Carvalho2014). The correlation between Ab presence and ECG alterations can be attributed to the arrhythmic effect of those Ab in CCC, as previously shown (Iwata et al. Reference Iwata, Yoshikawa, Baba, Anzai, Mitamura and Ogawa2001; Jahns et al. Reference Jahns, Boivin, Hein, Triebel, Angermann, Ertl and Lohse2004; Medei et al. Reference Medei, Nascimento, Pedrosa, Barcellos, Masuda, Sicouri, Elizari and de Carvalho2008). Escobar et al. (Reference Escobar, Fernandez-Gomez, Peter, Mobini, Hoebeke and Mijares2006) found that anti-β 2-AR reactivity induced conduction blocks in isolated heart mouse preparations, suggesting that these antibodies could be responsible for ventricular arrhythmias (Escobar et al. Reference Escobar, Fernandez-Gomez, Peter, Mobini, Hoebeke and Mijares2006).
It is interesting to note that the same T. cruzi strain induced production of distinct levels of circulating antibodies recognizing the β 1-AR, β 2-AR and M2-CR in the two mouse lineages. This indicates that there is not only a T. cruzi strain-specific modulation of antibody titres – observed previously in infected dogs (Daliry et al. Reference Daliry, Caldas, de Figueiredo Diniz, Torres, Talvani, Bahia and Campos de Carvalho2014) – but also a mouse lineage-specific modulation of Ab production.
Although presenting positivity for anti-β 1, anti-β 2 and anti-M2 in the chronic phase, T. cruzi-infected C3H/He animals did not show any HRV index alteration. Chronically infected C57BL/6 mice, which displayed only anti-M2-CR Ab, presented a decrease in all HRV indexes analysed, suggestive of dysautonomia. Several reports have shown the presence of circulating anti-M2 Ab concomitant with autonomic dysfunction, suggesting that those Ab could have a causal effect on clinical manifestations of CD (Goin et al. Reference Goin, Borda, Leiros, Storino and Sterin-Borda1994, Reference Goin, Borda, Auger, Storino and Sterin-Borda1999; Talvani et al. Reference Talvani, Rocha, Ribeiro, Borda, Sterin-Borda and Teixeira2006; Ribeiro et al. Reference Ribeiro, Gimenez, Hernandez, de Carvalho, Teixeira, Guedes, Barros, Lombardi and Rocha2007). In fact, autonomic disorders have been described before the occurrence of LV dysfunction in patients and even in the indeterminate phase of CD, suggesting that it appears early during the infection, before any cardiac structural and functional alteration can be detected (Ribeiro et al. Reference Ribeiro, Gimenez, Hernandez, de Carvalho, Teixeira, Guedes, Barros, Lombardi and Rocha2007). In agreement with that, we detected anti-M2 Ab in the serum of C3H/He T. cruzi-infected mice at 30 dpi, and similarly in a canine model of CD infected with three different T. cruzi strains (Daliry et al. Reference Daliry, Caldas, de Figueiredo Diniz, Torres, Talvani, Bahia and Campos de Carvalho2014).
Another interesting finding of the present report is that the presence of anti-β 1 and anti-β 2-CR Ab, concomitant with anti-M2 Ab, did not alter HRV indexes, suggesting that the presence of both anti-adrenergic and anti-cholinergic Ab may balance each other's effects, resulting in no autonomic dysfunction.
There are two possible explanations for the effect of anti-M2 Ab on lowering HRV indexes: (1) impairment of vagal-mediated autonomic modulation of the heart and (2) enhanced parasympathetic modulation of the sinus node. Since we found a significant HR reduction in T. cruzi-C57BL/6 infected mice, this could only result from parasympathetic hyperstimulation. However, in chagasic patients Ribeiro et al. (Reference Ribeiro, Gimenez, Hernandez, de Carvalho, Teixeira, Guedes, Barros, Lombardi and Rocha2007) found that reduced HRV was not accompanied by reduced HR and that anti-M2-CR Ab titres did not correlate with basal HR. Based on these findings they stated that vagal enhancement remains a theoretical hypothesis that still needs demonstration. Additional experiments are necessary to establish if these differences are due to species-specific effects.
FINANCIAL SUPPORT
This work was supported by grants from the National Research Council (CNPq), The Rio de Janeiro State Research Agency (FAPERJ), the National Institute for Science and Technology in Structural Biology and Bioimaging (INBEB) and CAPES.



