Introduction
Ground ice is one of the most important and dynamic geologic components of permafrost systems. While ample literature exists regarding the distribution and origin of ground ice in permafrost regions in the Arctic (e.g. French Reference French2007), comparatively few studies have been conducted in the McMurdo Dry Valleys (MDV), the largest ice-free region in Antarctica. Based on climate and soil properties, the MDV can be divided into three zones: i) the coastal or subxerous zone, where mean daily summer air temperatures exceed 0°C and liquid water exists seasonally, ii) the inland mixed or xerous zone where summer air temperatures may rise above 0°C for short periods and liquid water is periodically present, and iii) the stable upland or ultraxerous zone located adjacent to the polar plateau where maximum air temperatures rarely exceed 0°C and little to no melting of snow and/or ice occurs (Doran et al. Reference Doran, McKay, Clow, Dana, Fountain, Nylen and Lyons2002, Marchant & Head Reference Marchant and Head2007).
Active layer and permafrost samples collected at more than 100 sites to depths of up to 1.5 m across the three zones (> 70% of samples taken from the coastal thaw zone; Campbell & Claridge Reference Campbell and Claridge2006) have been used to produce a qualitative map of permafrost and ground ice in the MDV (Bockheim et al. Reference Bockheim, Campbell and McLeod2007). In the coastal thaw zone, ground ice was described in the form of ice-cemented permafrost, ice wedges, buried glacier ice and buried remnants of the Ross Sea ice sheet (Campbell & Claridge Reference Campbell and Claridge2006, Swanger et al. Reference Swanger, Marchant, Kowalewski and Head2010). In the stable upland zone, dry permafrost dominated the region (Campbell & Claridge Reference Campbell and Claridge2006, Bockheim et al. Reference Bockheim, Campbell and McLeod2007) and buried glacial ice was documented at two locations (e.g. Sugden et al. Reference Sugden, Marchant, Potter, Souchez, Denton, Swisher and Tison1995, Marchant et al. Reference Marchant, Lewis, Phillips, Moore, Souchez, Denton, Sugden, Potter and Landis2002, Lacelle et al. Reference Lacelle, Davila, Pollard, Andersen, Heldmann, Marinova and McKay2011). However, recent measurements of ice table depths (the interface between the dry and ice-bearing permafrost) in the stable upland zone revealed that c. 90% of the measurement sites had a relatively shallow ice table (<80 cm) (e.g. Kowalewski et al. Reference Kowalewski, Marchant, Head and Jackson2012, Marinova et al. Reference Marinova, McKay, Pollard, Heldmann, Davila, Anderson, Jackson, Lacelle, Paulsen and Zacny2013). This conflicts with the permafrost and ground ice map of Bockheim et al. (Reference Bockheim, Campbell and McLeod2007) that suggested ice-bearing permafrost to be largely absent from the area. Therefore, the amount, distribution and origin of ground ice in the stable upland zone remains poorly documented; yet, as illustrated by the many examples from Arctic permafrost, they are essential components of the dynamic relationships between the climate and landscape evolution.
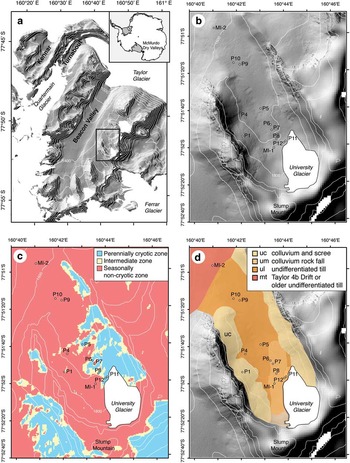
In this study, we investigated the distribution and origin of near-surface ground ice in University Valley, a small hanging glacial valley in the Quartermain Mountains of the upper MDV of Antarctica (Fig. 1). Based on the analysis of 18 ice-bearing permafrost cores collected from 12 sites along the valley floor, we: i) determined the sediment properties of the polygonal terrain, ii) quantified ground ice content (excess ice and, gravimetric water contents), and iii) measured the δD-δ18O composition of ground ice to infer its origin. The spatial distribution of the ice-bearing permafrost cores, taken within individual polygons (centre and shoulders) and in polygons along the valley floor, allowed the assessment of both local and regional variations in ground ice conditions within the valley and factors influencing its variability. The results presented in this study contribute towards a better understanding of ground ice conditions in extremely cold and hyper-arid regions where liquid water is rare, which defies the conventional understanding of ground ice forming processes (e.g. Mackay Reference Mackay1972).
Hillshade image showing the location of a. University Valley, Quartermain Mountains, Antarctica, and b. the 12 polygons. Hillshade images were derived from a LiDAR digital elevation model (http://usarc.usgs.gov/lida_dload.shtml) embedded into a 15 m ASTER digital elevation model (http://asterweb.jpl.nasa.gov/data/asp) and contour lines (100 m interval) indicated with thin white lines. c. Map showing ground surface temperature zones of University Valley and location of 12 polygons (from Lacelle et al. Reference Lacelle, Lapalme, Davila, Pollard, Marinova, Heldmann and McKay2016). d. Surface geology map of University Valley (derived from Cox et al. Reference Cox, Turnbull, Isaac, Townsend and Smith2012) and location of 12 polygons.

Study area
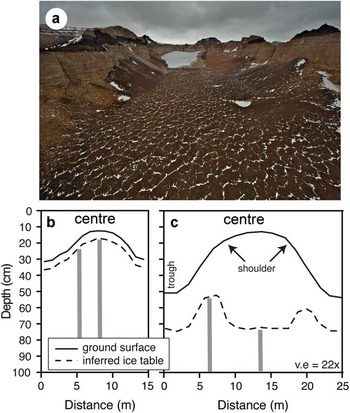
University Valley (77°52'S, 163°45'E, 1600–1800 m a.s.l.) is a 1.5 km long, 500 m wide and north-west facing valley in the Quartermain Mountains of the MDV (Fig. 1). A small glacier, unofficially named ‘university glacier’, is located at the head of the valley and polygonal terrain comprised of sand wedges (typical of ultraxerous environments) is widespread on the valley floor and some of the talus cones. The morphology of the polygons is fairly consistent across the valley with flat to slightly convex centres and shallow troughs (on the order of 10–50 cm deep and 20–50 cm wide) (Fig. 2); however, polygon diameter increases from c. 10 m in the upper section of the valley to c. 20 m in the lower part (Mellon et al. Reference Mellon, McKay and Heldmann2014).
Image showing the polygonal terrain in University Valley. Sketch of a polygon in b. upper University Valley and c. lower University Valley illustrating the location of the centre, shoulder and trough of the polygons and the variability in ice table depth. The surface topography of the polygons was derived from a LiDAR digital elevation model (http://usarc.usgs.gov/lida_dload.shtml).

The local geology consists of sills of Ferrar Dolerite (Jurassic age intrusives) and sedimentary rock of the Beacon Supergroup (Devonian to Triassic age sandstones and conglomerates) (Barrett Reference Barrett1981, Cox et al. Reference Cox, Turnbull, Isaac, Townsend and Smith2012). The surface sediments consist of undifferentiated till and alpine drift on the valley floor and colluvium on talus cones at the base of the valley walls (Cox et al. Reference Cox, Turnbull, Isaac, Townsend and Smith2012). The alpine drift is restricted to the upper and central parts of the valley. Optically stimulated luminescence ages obtained from a core in upper University Valley yielded ages of 17.9±1.6 kyr for sediments at 2–5 cm depths whereas those at 90–95 cm depths were dated to 170±36 kyr (Lacelle et al. Reference Lacelle, Davila, Fisher, Pollard, DeWitt, Heldmann, Marinova and McKay2013). These ages fit reasonably well with those estimated from Cl concentration in near-surface soils (top 56 cm) where apparent minimum sediment accumulation time ranges from 10–30 kyr near the glacier to 70–200 kyr in the central part of the valley (Jackson et al. Reference Jackson, Davila, Böhlke, Sturchio, Sevanthi, Estrada, Brundrett, Lacelle, McKay, Poghosyan, Pollard and Zacny2016). The undifferentiated till, which is confined to the lower part of the valley and contains granite erratics, is probably associated with the Taylor 4b Drift (>2.7 Ma) or an older glaciation (Cox et al. Reference Cox, Turnbull, Isaac, Townsend and Smith2012).
University Valley is located in the ultraxerous environment of the stable upland climatic zone of the MDV. A three-year (2010–12) climate record collected from an automated weather station in University Valley (77°51.729'S, 160°42.606'E, 1677 m a.s.l.) reported a mean annual air temperature of -23.4±0.9°C and a mean annual relative humidity of 45.5±1.8%. The mean summer air temperature was -13.9±0.4°C and the maximum mean daily and hourly air temperatures were -5.7 and -2.8°C, respectively (Lacelle et al. Reference Lacelle, Lapalme, Davila, Pollard, Marinova, Heldmann and McKay2016). Although precipitation is low (<10 mm snow water equivalent; Fountain et al. Reference Fountain, Nylen, Monaghan, Basagic and Bromwich2010), perennial snow patches were found in depressions scattered along the western portion of the valley floor and snow frequently occupies the troughs of polygons. Two zones defined by distinct ground surface temperatures were identified in University Valley (Fig. 1c) including: i) a perennially cryotic zone (PCZ) in the north-east portion of the valley that is characterized by ground surface temperatures always <0°C due to higher topographical shading, and ii) a seasonally non-cryotic zone (NCZ) characterized by ground surface temperatures > 0°C for up to a few hours on clear summer days (Lacelle et al. Reference Lacelle, Lapalme, Davila, Pollard, Marinova, Heldmann and McKay2016). The mean annual ground surface relative humidity in University Valley decreases along the valley floor from 100%ice in upper University Valley to near 85%ice in the central portion (Lacelle et al. Reference Lacelle, Davila, Fisher, Pollard, DeWitt, Heldmann, Marinova and McKay2013).
Measurements of ice table depths in University Valley, generally increasing with distance from ‘university glacier’ from <1 cm in proximity to the glacier to >50 cm at the mouth of the valley, suggest the presence of widespread ice-bearing sediments overlain by dry sediments (McKay Reference McKay2009, Marinova et al. Reference Marinova, McKay, Pollard, Heldmann, Davila, Anderson, Jackson, Lacelle, Paulsen and Zacny2013). In addition, two bodies of massive ice have been discovered, one is adjacent to ‘university glacier’ (MI-1), which was interpreted as a buried portion of the glacier as a result of a rockslide (Lacelle et al. Reference Lacelle, Davila, Pollard, Andersen, Heldmann, Marinova and McKay2011), and the other (MI-2) is situated near the mouth of the valley near a lateral moraine of the undifferentiated till but its origin has not yet been assessed (Pollard et al. Reference Pollard, Lacelle, Davila, Andersen, McKay, Marinova and Heldmann2012). Despite these studies documenting the presence of ice-bearing permafrost in University Valley, little is known about ground ice content, its origin and the factors that control the potential spatial variability in ground ice conditions.
Methodologies
Field sampling
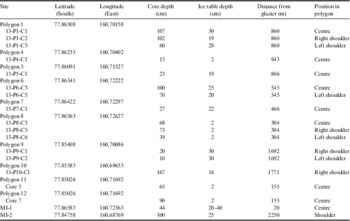
Between 2009 and 2013, 18 ice-bearing permafrost cores (<2 m) were collected from 12 polygons along the length of the valley (Fig. 1). Three polygons (P8, P6, P1) were cored in the centre and shoulders, and nine polygons (P4, P5, P7, P9, P10, P11, P12, MI-1, MI-2) were cored only in the centre or the shoulder of the polygon depending on the depth of the ice table (Fig. 2). Polygons 5, 8, 11 and 12 were located in the PCZ, polygons 1, 4, 7, 9, 10, MI-1 and MI-2 were situated in the NCZ, and polygon 6 was located in the intermediate mixed zone (IMZ), a transitional area between the PCZ and NCZ that may exhibit characteristics of either zone. All polygons were situated in the undifferentiated drift, except for polygons 7, 8, 11 and 12 which were located in the colluvium fallout of a rock fall and MI-2 that was located in the Taylor 4b Drift. In addition, ‘university glacier’ and a permanent snow patch were also cored to compare their δD-δ18O composition with the ground ice samples. Table I provides the details of the permafrost cores collected in University Valley.
Details of ice-bearing permafrost cores collected in University Valley, Quartermain Mountains, McMurdo Dry Valleys, Antarctica.

The permafrost cores were collected using an 11.5 cm diameter SIPRE corer. Prior to coring, the dry loose sediment layer above the ice-bearing permafrost was removed (and not sampled). Each core was retrieved in 10–50 cm long segments, wrapped in plastic core sleeves and shipped frozen in thermally insulted boxes to the University of Ottawa (Ottawa, Canada). The glacier was sampled to a depth of 56 cm using a Kovacs corer, whereas a pit was dug in the 65 cm thick snow patch to the surface of the ice-cemented ground. The glacier and the snow patch were sub-sampled at 2 cm intervals; the samples were allowed to melt in the field in sealed plastic bags, filtered through 0.45 μm diameter filters and transferred into 20 ml high-density polyethylene bottles for stable water isotope analyses.
Ground ice content and sediment properties of polygons
The ice-bearing permafrost cores were cut into c. 2 cm thick slices using a RIDGID circular saw with a 0.8 mm thick diamond blade and allowed to thaw in sealed plastic bags. The thawed samples were transferred into graduated 50 ml polypropylene tubes, weighed, and the volume of supernatant water (if present) and sediments were recorded once the sediments had settled. The supernatant water was extracted and filtered (0.45 μm pore diameter filter) into 20 ml vials for stable water isotope analyses. The 50 ml tubes with the remaining wet sediment were placed into an oven at 105°C for 24 hours to dry and the weight of the dried sediment was then recorded.
Ground ice content was assessed by determining the excess ice and gravimetric water contents. Excess ice content, defined as the volume of ice in the sediments exceeding the total pore volume that the sediments would have under natural unfrozen conditions, was calculated using the equation from van Everdingen (Reference Van Everdingen1998). The gravimetric water content (GWC) was determined from the mass of the water and dry mass of the sediments using the equation from van Everdingen (Reference Van Everdingen1998).
Sediment properties in eight of the sampled polygons were determined at c. 10 cm depth intervals. The sediment colour was determined dried using a Munsell soil colour chart and the grain size distribution of the sediments was determined using the stacked sieve method where 15–250 g of dry sediment was passed through a series of stacked stainless steel sieves (2, 1, 0.5, 0.25, 0.125 and 0.0625 mm). A ternary diagram was made by classifying the sediments into three dominant particle sizes: gravel (≥2 mm), sand (<2 mm to ≥0.0625 mm) and fine sediments (<0.0625 mm). Errors in the calculation of the grain size distribution were ±4% due to the occasional retention of soil particles in the sieve mesh.
Stable water isotope analyses
Stable isotope (18O and D) measurements can reveal processes and conditions that led to the formation of ground ice, such as the freezing of liquid water and vapour deposition, each of which generates distinct isotopic trends (Lacelle Reference Lacelle2011). The 18O/16O and D/H ratios of the glacier ice, perennial snow patch and ground ice samples (when enough water could be extracted) were determined using a Los Gatos Research (LGR) liquid water analyser coupled to a CTC LC-PAL autosampler for simultaneous 18O/16O and D/H ratios measurements of H2O. Following analysis, all measured water samples were verified for spectral contaminants in the samples using the LGR spectral interference contamination identifier software. The results are presented using the δ-notation (δ18O and δD), where δ represents the parts per thousand differences for 18O/16O or D/H in a sample with respect to Vienna Standard Mean Ocean Water (VSMOW). Analytical reproducibility for δ18O and δD was ± 0.3‰ and ± 1‰, respectively. Based on δD and δ18O measurements, the d (D-excess) was calculated using the equation from Dansgaard (Reference Dansgaard1964).
Statistical analyses
The Shapiro-Wilk test for normality was performed on the ground ice content data of all cores. Nearly half of the data from the groups of samples were normally distributed, the others showed a non-normal distribution. As such, the Mann-Whitney U test was used to assess if there was a statistically significant difference in the medians of ground ice content for different depths (top 20 and 50 cm) within polygons (centres vs shoulders). Regression analyses were performed to investigate the potential influence of sediment properties on ground ice content and to test for the significance of variations in median ground ice content along the valley floor. All statistical analyses were performed using R Studio statistical analysis software.
Results
Description of sediments in the polygonal terrain
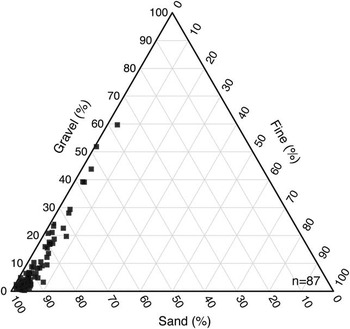
The sediments in the alpine drift of upper and central University Valley are mainly pale to light brown in colour (10YR 6/3, 7.5YR 6/4 and 10YR 7/3); whereas, pale to light yellowish-brown coloured sediments (2.5Y 7/3 and 2.5Y 6/4) were observed in the undifferentiated till of lower University Valley. The sediments along the valley floor can be classified as medium to coarse sand (dominant mode fraction at 0 to 2ϕ) with <8% fines (silt and clay) (Fig. 3). In each polygon, there was little change in soil texture with depth; however, the gravel content increased down-valley for both the centres and shoulders of polygons (only statistically significant for the shoulders).
Ternary diagram depicting the sediment properties in polygons P1, P4, P5, P6, P7, P8, P9 and P10 in University Valley, Quartermain Mountains, McMurdo Dry Valleys, Antarctica.

Ground ice content in polygons
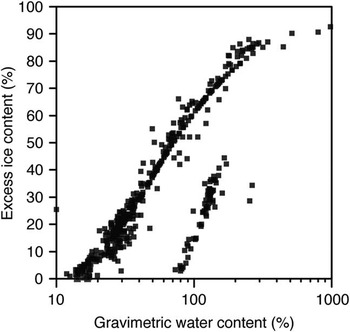
Ground ice content along the valley floor (excluding both bodies of massive ice, MI-1 and MI-2) was highly variable within the polygons and with increasing distance from ‘university glacier’. In the 16 cores, excess ice content ranged from 0–93% and GWC ranged from 9–981%. Since the excess ice content and GWC in the mineral soils are highly correlated (Fig. 4), we present results for excess ice content only.
Gravimetric water content compared to excess ice content for 16 ice-bearing permafrost cores collected in 10 polygons in University Valley, Quartermain Mountains, McMurdo Dry Valleys, Antarctica. The datapoints that are offset are from sites P1-C2 and P6-C3. The two bodies of massive ground ice (MI-1 and MI-2) are not shown.

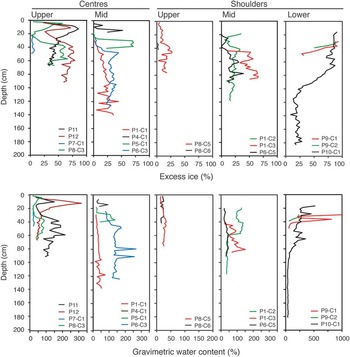
General trends in ground ice content with respect to the location in the polygons and along the valley floor were observed (Fig. 5). In upper University Valley, three of the four centres of the polygons (P8, P11, P12) contained a shallow ice-rich horizon 5–10 cm below the ice table (excess ice reaching >55% in all three cores). This ice-rich horizon was not present in the shoulders of P8 (the only polygon out of the four sampled on its shoulders). Below 20 cm depth, excess ice in the centre and shoulders of the polygons increased with depth to c. 70 cm then remained fairly constant below this depth. In central University Valley, the near-surface ice-rich layer was not observed in the centre of polygons; however, like the polygons in upper University Valley, the ground ice content in the centre and shoulders of the polygons increased with depth to c. 70 cm, below which it remained fairly constant. The polygons in lower University Valley were sampled only on their shoulders because the ice table was too deep in the centres (>70 cm depth). The shoulders of the polygons in this part of the valley contained the highest ground ice contents including an ice-rich zone in the uppermost c. 40–80 cm (excess ice reaching >60%) that was not observed in upper and central University Valley. Below this ice-rich zone, ground ice content decreased with depth to reach values comparable to the other polygons in the valley.
Excess ice content (top) and gravimetric water content (bottom) profiles in the centres and shoulders of polygons sampled in upper, mid and lower University Valley. See Fig. 1 for location of sampling sites.

Variations of ground ice content within polygons
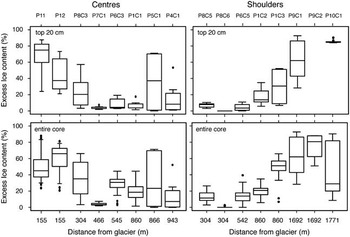
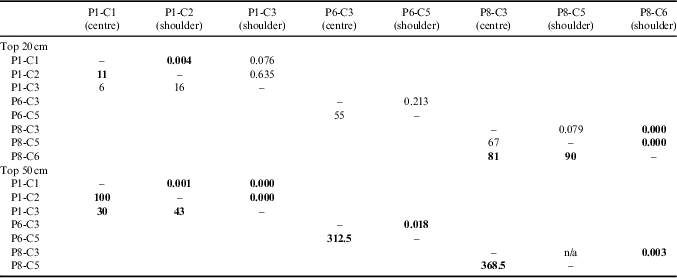
Samples collected from both the centre and shoulders of three polygons, P8 (304 m distance from the glacier), P6 (545 m distance from the glacier) and P1 (860 m distance from the glacier), were used to assess changes in ground ice content within polygons composed of medium sandy soils (Fig. 6). Based on the Mann-Whitney U test, the median excess ice content in P8 was significantly higher in the centre relative to the shoulders, and this trend was observed down to 50 cm depth (only for the top 20 cm between P8-C3 and P8-C5; Table II). In P6, the median excess ice content was statistically similar between the centre and the shoulder down to 50 cm depth (Table II). In P1, the median excess ice content was significantly lower in the centre compared to the shoulders down to 50 cm depth (only for the top 20 cm between P1-C1 and P1-C3; Table II).
Inter-polygon comparison of excess ice content in the top 20 cm (top) and entire core (bottom) for centre and shoulders of polygons with increasing distance from ‘university glacier’. Boxplots show the median (horizontal line), 10th and 90th percentiles (whiskers) and outliers (dots).

Mann-Whitney U test comparison of the median excess ice content in the top 20 and top 50 cm of ice-bearing permafrost in University Valley. Mann-Whitney U values are presented below the diagonal, P-values are presented above the diagonal. Statistically significant differences in median ground ice content between centre and shoulder of same polygon are in bold (P<0.05).
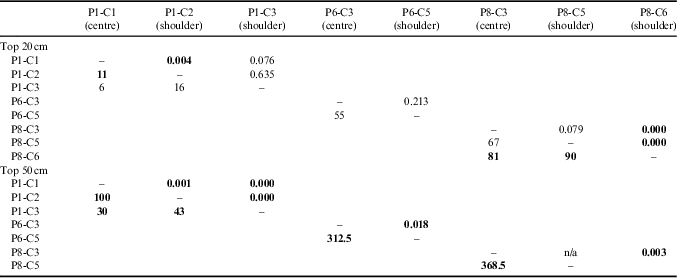
Overall, the median excess ice content in the uppermost 20 and 50 cm of ice-bearing permafrost was higher in the centre relative to the shoulders for the polygon situated in the PCZ (P8). The polygon situated in the IMZ (P6) showed no significant differences between the centre and shoulders, whereas the polygon situated in the NCZ (P1) had a median ice content higher in the shoulders of the polygon relative to the centre.
Variations of ground ice content in polygons along the valley floor
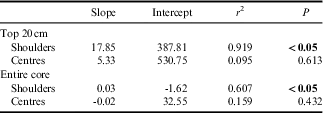
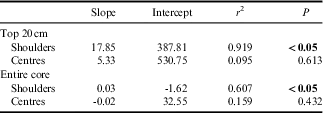
Figure 6 compares the median excess ice content in the centres and shoulders of polygons for the uppermost 20 cm and entire core as a function of distance from ‘university glacier’ (MI-1 and MI-2 are not shown since they consist of bodies of massive ice). The median excess ice content in the centres of polygons ranged from 3.4–65.2% and decreased with distance from the glacier, but linear regression analysis indicated that the trend is not significant (Table III). Conversely, the median excess ice content in the shoulders of the polygons ranged from 0–80.7% and showed a significant increase down-valley in both the top 20 cm and entire core from <40% in the upper and central portions of the valley to >60% in lower University Valley (Table III).
Regression coefficients between the down-valley distance from ‘university glacier’ and median excess ice content in the top 20 cm and entire core of ice-bearing permafrost in the centres and shoulders of polygons in University Valley. Values significant at a 95% level of significance are in bold.
Stable water isotopes composition of glacier, snow patch and ground ice
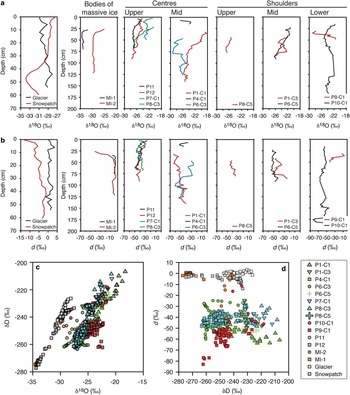
The δ18O and d profiles from ‘university glacier’ and a perennial snow patch are shown in Fig. 7. In the upper 56 cm of ‘university glacier’, the δ18O values fluctuated between -30.9 and -28.1‰ with depth, whereas the d values varied between -1.3 and 3.5‰. In a δD-δ18O diagram (Fig. 7c), the samples plot along a regression slope value of 7.9 (δD=7.9, δ18O=0.9; r 2=0.97), which was similar to the local meteoric water line (LMWL) of 7.7 (δD=7.7, δ18O=8.7, r 2=0.99; Gooseff et al. Reference Gooseff, Lyons, McKnight, Vaughn, Fountain and Dowling2006) derived from precipitation and snow in lower elevation valleys.
δ18O and b. D-excess (d) profiles in ‘university glacier’, a perennial snow patch, and centres and shoulders of polygons sampled in upper, mid and lower University Valley. c. Diagram showing δD-δ18O relations in ‘university glacier’, a perennial snow patch and the 14 permafrost cores collected from polygons in University Valley. d. Diagram showing the d-δD relations in ‘university glacier’, a perennial snow patch and the 14 permafrost cores collected from polygons in University Valley. See Fig. 1 for sampling site locations.

The δ18O composition of the 65 cm thick snow patch had a similar range to the glacier (-33.9 and -27.5‰); however, the d values were lower, ranging from -13.5 to -1.3‰. The uppermost 10 cm of the snow patch showed upward convex δ18O and d profiles, which are consistent with the sublimation of snow. In a δD-δ18O diagram (Fig. 7c), the entire snow patch plotted along a regression slope value of 6.9 (δD=6.9 δ18O=34.9; r 2=0.98), which was lower than the LMWL. However, if the samples in the uppermost 10 cm were excluded due to post-depositional modification, a regression slope of 7.4 was calculated (δD=7.4 δ18O=23.8; r 2=0.99), which was similar to the value of the glacier and the LMWL.
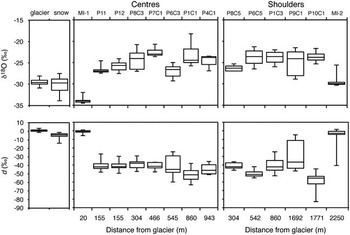
The δ18O and d composition of ground ice was measured in 14 cores from 11 polygons along the valley floor (Fig. 7; not measured for P1-C2, P5-C1, P8-C6 and P9-C2 as not enough water could be extracted for analysis). The δ18O composition of ground ice ranged from -34.5 to -18.3‰ (average of -25.7±3.0‰) and d values ranged from -83.0 to 1.6‰ (average of -40.2±17.1‰). With the exception of the massive ice bodies at MI-1 and MI-2, the average δ18O values of all ice-bearing permafrost cores were higher than those measured in ‘university glacier’ and the perennial snow patch, whereas the average d values were lower. No trends were discernible in regards to variations in δ18O and d with depth in the centres or shoulders of polygons. The average and range of δ18O and d in the centres and shoulders of polygons also showed some significant trends with distance from ‘university glacier’; only the average d values in the centre of polygons showed a near-significant decrease down-valley (r 2=0.49, P=0.078) (Fig. 8).
Comparison of δ18O (top) and D-excess (d) (bottom) for ice-bearing permafrost cores from centre and shoulders of polygons with increasing distance from ‘university glacier’. Boxplots show the median (horizontal line), 10th and 90th percentiles (whiskers) and outliers (dots).

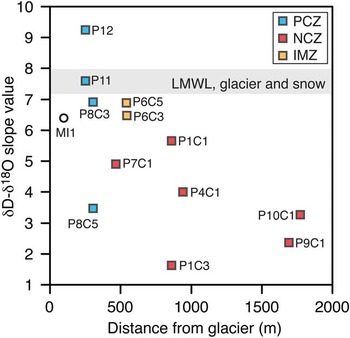
Figure 9 shows the values of the calculated linear regression slope between δD-δ18O for the ground ice as a function of distance from ‘university glacier’. General trends in regards to the value of the slope (i.e. a surrogate to infer the origin of the ground ice) emerged with respect to the site location in the valley. All cores taken from the PCZ (except P8-C5), yielded regression slope values within one unit of the LWML and glacier (6.5 to 9.3) but shifted below it due to much lower d. Such trends have been attributed to vapour-deposition origin of ground ice (Lacelle et al. Reference Lacelle, Davila, Fisher, Pollard, DeWitt, Heldmann, Marinova and McKay2013, Fisher & Lacelle Reference Fisher and Lacelle2014). The sites situated in the NCZ yielded regression slope values <6, which is suggestive of freezing of liquid water (Lacelle Reference Lacelle2011). The massive ice body (MI-1) found adjacent to ‘university glacier’ yielded a regression slope value of 6.4 and was interpreted as a buried portion of the glacier as a result of a rockslide (Lacelle et al. Reference Lacelle, Davila, Pollard, Andersen, Heldmann, Marinova and McKay2011). The massive ice body (MI-2) found in the undifferentiated till had highly clustered δD-δ18O values such that a reliable regression slope value could not be calculated; however, its d values were similar to those calculated for ‘university glacier’ and MI-1, suggesting a buried glacier ice origin.
Diagram showing the regression slope values between δD and δ18O as a function of distance from ‘university glacier’ for 13 ice-bearing permafrost cores collected in the centre and shoulders of polygons in University Valley (MI-2 is not shown since it had highly clustered δD-δ18O values such that a reliable regression slope value could not be calculated). Shown for comparison (grey box) is the range of regression slope values between δD and δ18O for the local meteoric water line (LMWL), ‘university glacier’ and perennial snow patch. IMZ=intermediate mixed zone, NCZ=non-cryotic zone, PCZ=perennially cryotic zone.

Discussion
Factors influencing the variability of near-surface ground ice conditions
According to previous studies (Campbell & Claridge Reference Campbell and Claridge2006, Bockheim et al. Reference Bockheim, Campbell and McLeod2007), the upper 2 m of sediments in University Valley was not expected to contain ground ice as the area was mapped as dry permafrost (i.e. <3% water content by weight). However, our results indicate that ground ice in University Valley is ubiquitous, abundant and variable within polygons and along the valley floor; the ground ice content decreased in the centres of polygons and increased in the shoulders of polygons along a down-valley gradient. Further, the ground ice in the valley was emplaced by three different mechanisms: vapour deposition, freezing of liquid water and burial of glacier ice.
Contrasting ground ice conditions within a region have often been attributed to differences in sediment textures, which affect the frost susceptibility of the sediments (e.g. Smith Reference Smith1975, Morse et al. Reference Morse, Burn and Kokelj2009). In University Valley, the sediments are composed of a homogenous medium to coarse sand, irrespective of location within a polygon or along the valley floor, and as such this factor can be ruled out to explain the variable ground ice conditions. Therefore, we attribute the spatial variability in the distribution and origin of ground ice to ground surface temperature conditions that define a colder PCZ in the topographically shaded north-east portion of the valley, and a warmer NCZ in the middle and south-west portions of the valley. For example, sites with ground ice of vapour-deposition origin (P6, P8, P11, P12) are situated in the PCZ and IMZ, whereas sites with ground ice formed predominantly by the freezing of liquid water (P1, P4, P7, P9, P10) are all found in the NCZ (Fig. 1c). The factors within both regions that influence the ground ice content and origin are discussed separately below.
Ground ice conditions in the perennially cryotic zone
Ground ice content in the centre of the polygons situated in the PCZ (P8, P11, P12) and the IMZ (P6) showed similar profiles, including a shallow and narrow ice-rich horizon at 5–10 cm depth (>50% excess ice content), whereas the shoulders of the polygons contained much lower ground ice content (<25% excess ice content) and did not exhibit the shallow ice-rich horizon. All of these sites yielded δD-δ18O regression slope values similar to the LMWL but with much lower d values such that the data plot well below the LMWL (Figs 7 & 9). These δD-δ18O trends have been attributed to vapour deposition into the mineral soils (Lacelle et al. Reference Lacelle, Davila, Fisher, Pollard, DeWitt, Heldmann, Marinova and McKay2013, Fisher & Lacelle Reference Fisher and Lacelle2014). The very low d values suggest that the source of water vapour is either from direct condensation of atmospheric moisture in the soils, which would plot along the LMWL with d near -35‰, and/or from transient frost that forms just at and under the ground surface in winter (Fisher et al. 2016). In the latter case, the transient frost partially sublimates into the atmosphere in early summer, leading to higher δ18O and lower d in the residual frost (i.e. Lacelle et al. Reference Lacelle, Davila, Pollard, Andersen, Heldmann, Marinova and McKay2011, Heldmann et al. Reference Heldmann, Marinova, Williams, Lacelle, McKay, Davila, Pollard and Andersen2012). The residual frost is then transported downwards into the soil along the negative soil temperature gradient to form ground ice.
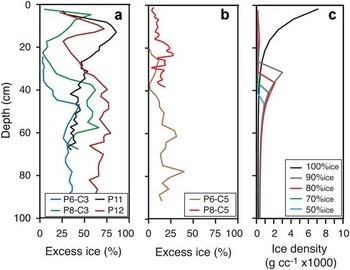
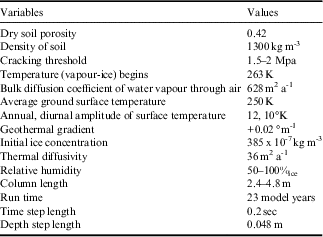
Considering that the δD-δ18O composition of ground ice in the PCZ formed from long-term vapour deposition in the mineral sandy sediments, we investigated the effect of variable ground surface relative humidity on ground ice content profiles using the REGO vapour-diffusion model (numerical solutions given in Fisher & Lacelle Reference Fisher and Lacelle2014, Fisher et al. 2016). The input climatic parameters and sediment properties were similar to those measured in upper University Valley and listed in Table IV. Figure 10a & b show the measured excess ice contents from the centres and shoulders of polygons with ground ice of vapour-deposition origin compared to the modelled ground ice density (after 23 model years; Fig. 10c) starting from dry sediments, ground surface temperature of 250 K (-23.15°C) and ground surface humidity ranging from 50 to 100%ice. For ground surface humidity of 100%ice, simulating a thin snow cover on the surface (observed during field investigations in regions located in proximity to ‘university glacier’), the predicted ground ice content is highest at the ground surface and decreases with depth (Fig. 10c). For ground surface relative humidity > 85%ice (but <100%ice), an ice-rich layer is predicted to develop just below the ice table and ground ice content subsequently decreases with depth (Fig. 10c). The scenario with ground surface relative humidity between >85 and <100%ice is the most consistent with the ground ice content profiles in the PCZ. Given the estimated age of near-surface sediments (17.9 kyr at 2–5 cm depth) in this part of the valley, there is sufficient time to accommodate the growth of excess ice by vapour deposition and reach the measured ice contents (Lacelle et al. Reference Lacelle, Davila, Fisher, Pollard, DeWitt, Heldmann, Marinova and McKay2013).
Excess ice content profiles in a. centres and b. shoulders of polygons in the perennially cryotic zone in University Valley compared with c. modelled ground ice density after 23 model years using REGO vapour-diffusion model starting from nearly dry sediments, 250 K ground surface temperature and ground surface humidity ranging from 50–100%ice. See Table IV for REGO model’s climatic and sediment property inputs. Due to run time restrictions, model is not meant to replicate the data, but provides a simple outline of ground ice content distribution in shallow permafrost using the cracking-diffusion model under current climate conditions in University Valley.

The values of the variables used in the REGO model runs over a range of surface relative humidity values (50–100%ice). Sediment porosity and density values used are similar to the measured values in adjacent valleys (i.e. McKay et al. Reference McKay, Mellon and Friedmann1998, Hagedorn et al. Reference Hagedorn, Sletten, Hallet, McTigue and Steig2010).

Conversely, samples collected on the shoulders of polygons had lower ground ice contents in the uppermost 50 cm and did not show a shallow ice-rich layer, yet the δD-δ18O results suggest that the ground ice has the same origin as in the centres. The lower ice content in the shoulders of the investigated polygons could be attributed to the processes associated with the development of the sand-wedge polygons. These polygons develop in a manner similar to ice wedge polygons except that contraction cracks are infilled with sand particles that originated from the shoulders of the polygon by gravity-induced movement (Péwé Reference Péwé1959). The deformation of sediment that raises the shoulders during wedge growth (Sletten et al. Reference Sletten, Hallet and Fletcher2003) coupled with the surface creep of the loose material down the slope of the shoulder (i.e. Hallet et al. Reference Hallet, Sletten and Whilden2011) would result in less stable sediment on the shoulders of the polygon than in the centre. In turn, this would disturb the process of vapour diffusion and deposition in the underlying sediments and result in lower ice content in the shoulders of the polygon.
Ground ice conditions in the seasonally non-cryotic zone
Ground ice content in the polygons sampled in the NCZ (P1, P4, P7, P8, P9 and P10) increased along a down-valley gradient and did not display the shallow ice-rich horizon observed for the sites in the PCZ. All sites yielded δD-δ18O regression slope values <6, which is suggestive that ground ice is derived from the freezing of a liquid water source (see Lacelle Reference Lacelle2011). We attributed these trends to variations in ground surface temperature, the distribution of snow and ice table depths in the valley. In University Valley, the number of thaw degree hours increases from zero in the upper section of the valley to almost 400 near the mouth of the valley (Lacelle et al. Reference Lacelle, Lapalme, Davila, Pollard, Marinova, Heldmann and McKay2016). A thin perennial snow layer covers the ground surface near the glacier; however, the snow only fills the troughs of polygons in the central and lower sections of the valley (Fig. 2) and the snow recurrence interval probably decreases down-valley (McKay Reference McKay2009). As such, the increase in thaw degree hours in central and lower portions of the valley would create favourable conditions to partially melt the snow in the troughs and allow the meltwater to infiltrate and freeze in the sediments in the areas near the shoulders. Field observations made in January 2013 of wet sediments to the depth of 25–30 cm following a snow fall in University Valley provide evidence that sufficient snowmelt can infiltrate the dry sediments and reach shallow ice tables when the ground surface temperatures are above freezing (see Lacelle et al. Reference Lacelle, Lapalme, Davila, Pollard, Marinova, Heldmann and McKay2016).
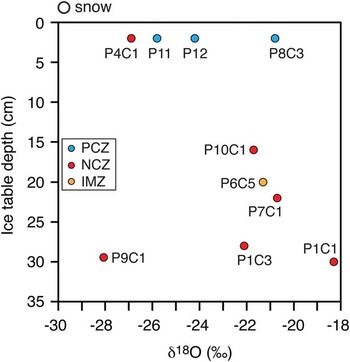
In the NCZ, the δ18O composition of ground ice at the ice table, ranging from -24.5 – -18.3‰, are 5.5–12‰ higher than that measured for the snow patch (average δ18O: -30.3±1.9‰) (see Fig. 7). This suggests that the snow meltwater partially evaporated as it infiltrated the dry soil layer before reaching the ice table, a process leading to a higher δ18O composition of the residual snow meltwater. Figure 11 illustrates the positive relationship between the δ18O composition of ground ice at the ice table and the ice table depth at the sampling sites in the NCZ. Assuming that the δ18O composition of snow patches is the same along the valley, the depth of the ice table is likely to affect the amount of snow meltwater evaporation taking place in the dry soils, with more evaporation at sites with deeper ice tables, before freezing in the soils to form the ground ice. Below, we present an evaporation–freezing equilibrium model that starts with a thin snow layer covering the ground that subsequently melts when soil surface temperature is above freezing and infiltrates into the sandy sediments to reach the ice table. While percolating through the dry sediments, the meltwater can evaporate and the extent of evaporation will determine its isotopic composition at the ice table where it will begin to freeze and form the ground ice in the ice-bearing permafrost.
Relationship between δ18O of ground ice at the ice table and ice table depth for ice-bearing permafrost cores collected in University Valley, Quartermain Mountains, McMurdo Dry Valleys, Antarctica. See Fig. 1 for location of sampling sites. IMZ=intermediate mixed zone, NCZ=non-cryotic zone, PCZ=perennially cryotic zone.

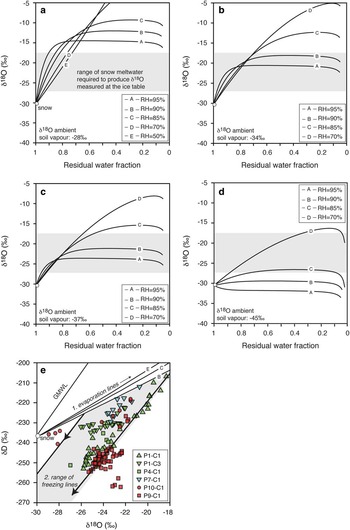
Using the Criss (Reference Criss1999) open system evaporation model that accounts for isotopic exchanges with the ambient soil moisture combined with the Sofer & Gat (Reference Sofer and Gat1975) isotope salt effects model (as used in Hagedorn et al. Reference Hagedorn, Sletten, Hallet, McTigue and Steig2010), we estimated the δ18O and δD evolution of evaporating snow meltwater in sandy soils above the ice table for various soil relative humidity values and δD-δ18O of soil moisture (Fig. 12a–d). The initial δ18O composition of snow was set at -30‰ (same as measured), and that of the soil water vapour ranged from -45 – -28‰. Soil relative humidity ranged from 50–95% (values near 50% represent atmospheric humidity, those >85% were measured at the ground surface in University Valley). The typical total soluble ions concentration was set at 4 g l-1 (Lacelle et al. Reference Lacelle, Davila, Fisher, Pollard, DeWitt, Heldmann, Marinova and McKay2013). In all numerical scenarios, evaporation at soil relative humidity <70% caused strong δ18O enrichment in the residual water, with enrichment in the order of 20–30‰ when most of the water had evaporated. However, for soil relative humidity >85%, the equilibrium exchange between snowmelt and soil moisture approached a steady state value that was dependent on the δ18O of the ambient soil moisture and soil relative humidity; this was irrespective of the initial δ18O composition of snowmelt (not shown). The modelled δ18O composition of infiltrating snowmelt required to develop the measured δ18O at the ice table was reached using soil relative humidity of 85–95% and ambient δ18O soil moisture of -45 – -34‰, after >10% of the meltwater had evaporated. This contrasts with findings from Victoria Valley (400 m a.s.l.) where Hagedorn et al. (Reference Hagedorn, Sletten, Hallet, McTigue and Steig2010) suggested that 95% of snowmelt needed to evaporate in the dry soil in order to develop the isotopic composition of the ground ice at the ice table. The discrepancy can be explained by the fact that Hagedorn et al. (Reference Hagedorn, Sletten, Hallet, McTigue and Steig2010) assumed a soil relative humidity similar to that of the atmosphere (50%); however, direct measurements in University Valley showed that the mean annual relative humidity at the ground surface (>85%ice) is higher than in the atmosphere (50%ice).
Evolution of δD-δ18O of evaporating water (1/10th seawater) for a range of relative humidity and with an ambient soil water vapour δ18O of a. -28‰, b. -34‰, c. -37‰ and d. -45‰ using the Criss (Reference Criss1999) and Sofer & Gat (Reference Sofer and Gat1975) models. The start snow meltwater in a. to d. is assumed to have δ18O and δD of -30.4 and -238.2‰, respectively, but the snow meltwater isotopic composition has negligible influence on final results. e. δD-δ18O data of the cores in the NCZ cores and the modelled isotope evolution lines for the remaining water (converted to ice to reflect ground ice values at the ice table) for the c. scenario, in the evaporative range of 1 to 0.7. A simple Rayleigh freezing model then defines the freezing lines starting over the range of δ18O partially evaporated snow meltwater (-27 – -22‰). GMWL represents the global meteoric water line (δD=8, δ18O+10).

Based on our series of numerical scenarios, the evaporation of >10% of snow meltwater in the dry sandy soils under relative humidity conditions of 85–95% and δ18O soil moisture of -45 – -34‰ sets the initial δD-δ18O composition of the water that will begin to freeze at and below the ice table to form the ground ice (no data plot above the 90% relative humidity δD-δ18O evaporation curves, which suggests that the boundary conditions used in the modelling exercise are reasonable; Fig. 12e). Freezing of the partially evaporated snow meltwater will then impart a progressive depletion in δ18O in the residual water due to the preferential incorporation of the heavier isotopes in the ice following a Rayleigh-type isotope fractionation with the extent of fractionation being dependent on the freezing rate and thickness of the boundary layer (Lacelle Reference Lacelle2011). Figure 12e shows a range of equilibrium closed-system freezing lines starting from initial δ18O water values of -27–-22‰. The δD-δ18O composition of ground ice in the NCZ plots within the range of expected freezing curves (excluding the two bodies of massive ground ice). However, some of the ground ice δD-δ18O data deviate from the freezing lines, suggesting that mixing with vapour-deposited ice, as observed in the PCZ, is probably occurring. Given the sharp boundary in soluble salt content between dry and icy sediments (Jackson et al. Reference Jackson, Davila, Böhlke, Sturchio, Sevanthi, Estrada, Brundrett, Lacelle, McKay, Poghosyan, Pollard and Zacny2016), brine interactions and isotope exchange with the ground ice, as described in Victoria Valley (e.g. Hagedorn et al. Reference Hagedorn, Sletten, Hallet, McTigue and Steig2010), is not likely to be occuring in University Valley.
The interpretation that ground ice in the NCZ formed mainly by the freezing of partially evaporated snow meltwater is one of the few descriptions of the presence of liquid water in the stable upland zone. Based on the OSL dates and salt concentration ages in near-surface soils (Jackson et al. Reference Jackson, Davila, Böhlke, Sturchio, Sevanthi, Estrada, Brundrett, Lacelle, McKay, Poghosyan, Pollard and Zacny2016), the soils in the NCZ of University Valley experienced wet conditions prior to 70–200 k years ago, an interpretation that challenges the current consensus that there has been minimal to no liquid water in this region during the past few million years (e.g. Sugden et al. Reference Sugden, Marchant, Potter, Souchez, Denton, Swisher and Tison1995, Lewis et al. Reference Lewis, Marchant, Ashworth, Hemming and Machlus2007, Marchant et al. Reference Marchant, Mackay, Lamp, Hayden and Head2013). Considering that ground surface temperatures can exceed 0°C in the NCZ during clear summer days (Lacelle et al. Reference Lacelle, Lapalme, Davila, Pollard, Marinova, Heldmann and McKay2016), we suggest that an additional limiting factor to having ground ice of snow meltwater origin is not ground temperature but the presence of snow on the ground that can be melted during summer. However, little data exists on the distribution and amount of snow in the Quartermain Mountains, which makes it difficult to assess the potential distribution of ground ice of snow meltwater origin.
The bodies of buried glacier ice
In University Valley, two bodies of buried glacier ice have been discovered: one next to ‘university glacier’ (MI-1) and the other near the mouth of the valley (MI-2). The buried glacier ice (MI-1) situated next to ‘university glacier’ was interpreted as a portion of the glacier buried by a rock fall that occurred c. 150 ka yrs ago (Lacelle et al. Reference Lacelle, Davila, Pollard, Andersen, Heldmann, Marinova and McKay2011). The buried glacier ice body near the mouth of the valley (MI-2) was found buried beneath 25 cm of the Taylor 4b Drift (>2.7 Ma) or an older drift and as such originated from an advance of the Taylor Glacier. The buried glacier ice at MI-2, with an average δ18O composition of -29.6 ± 0.9‰ (26 samples with a range of -30.3 – -25.6‰) is probably unrelated to the buried glacier ice in central Beacon Valley; the latter which originated from the upper valleys, has a much lower average δ18O composition (-33.2‰) and range (-33.6 – -33.0‰) and is buried beneath the 8.1 Ma years old Granite Drift (Marchant et al. Reference Marchant, Lewis, Phillips, Moore, Souchez, Denton, Sugden, Potter and Landis2002). Based on the age of overlying sediments and the δD-δ18O composition, the three buried glacier ice bodies appear to be unrelated to each other, which attest to multiple glaciations in this alpine region.
Conclusions
Based on the results presented in this study, the following conclusions can be reached regarding ground ice conditions in University Valley:
-
∙ Even though air temperatures are always <0°C and precipitation is <10 mm snow water equivalent, ground ice is ubiquitous and abundant in the mineral sandy sediments. Excluding the two bodies of buried glacier ice, excess ice content ranged from 0–93% and GWC ranged from 9–981%. These ice contents are as high as those measured in the Antarctic coastal thaw zone and in Arctic permafrost; as such, the cold temperatures and low precipitation in the upper MDV are probably not limiting factors to the development of ice-rich permafrost in this region.
-
∙ Ground ice content was variable within polygons and along the valley floor. Ground ice content was higher in the centre relative to the shoulders for the polygons situated in the PCZ; whereas in the NCZ, ground ice content was higher in the shoulders of the polygon relative to the centre. Along the valley floor, the ground ice content decreased in the centres of polygons and increased in the shoulders.
-
∙ Ground ice can be attributed to three origins: vapour deposition, freezing of partially evaporated snow meltwater and the burial of glacier ice. The variability in the origin of ground ice is attributed to ground surface temperature conditions where vapour-deposited ground ice is situated in the PCZ and ground ice of snowmelt water origin is situated in the NCZ; the latter has also been described in lower elevation valleys. The description of vapour-deposition ground ice is rare in the literature and as such the PCZ offers a unique environment to further our understanding about this type of ground ice.
-
∙ The discovery of ground ice of snow meltwater origin in sediments dated to a few hundred thousand years challenges the consensus that the uppermost 2 m of the ground surface in this valley of the stable upland zone remained frozen for the past 8.2 Ma years, as inferred from past studies. However, the major limiting factor to having ground ice of liquid water origin in University Valley is not ground temperatures >0°C, but the presence of snow on the ground that can be melted.
Acknowledgements
Fieldwork in University Valley (summers 2009 to 2012) was supported by NASA’s Astrobiology Science and Technology for Exploring Planets (ASTEP) programme and operated by the National Science Foundation (NSF) Office of Polar Programs. Natural Science and Engineering Research Council of Canada (NSERC) Discovery Grant provided financial support for data analyses and modelling. B. Lauriol and A. Lewkowicz examined the MSc thesis on which this paper is based. We thank W. Dickinson for constructive comments on the manuscript. The data set can be obtained by contacting the corresponding author.
Author contributions
All authors designed the project. DL, WP, AD, CMP collected the samples in University Valley. All authors contributed to data analysis and writing the manuscript.
Supplemental material
Supplemental data, photographs and radiographs will be found at https://doi.org/10.1017/S0954102016000572.