Implication
The 41 studies compiled in this meta-analysis highlight that satisfactory average daily gain (ADG) is possible in tropical pastures. The feed conversion efficiencies calculated showed that natural grassland had great potential for animal feeding, which is primarily associated with dry matter intake rather than digestibility. The stocking rate managed as kg BW per ha, studied extensively in the literature, could efficiently increase ADG per ha. The main expected implications of this quantitative analysis of the literature are a better understanding of what governs grazing livestock performance and appropriate management strategies, which prioritize consumption of the forage rather than its digestibility.
Introduction
Livestock production systems are facing challenges posed by increasing food demand and environmental issues (Godfray et al., Reference Godfray, Beddington, Crute, Haddad, Lawrence, Muir, Pretty, Robinson, Thomas and Toulmin2010; Pretty et al., Reference Pretty, Sutherland, Ashby, Auburn, Baulcombe, Bell, Bentley, Bickersteth, Brown, Burke, Campbell, Chen, Crowley, Crute, Dobbelaere, Edwards-Jones, Funes-Monzote, Godfray, Griffon, Gypmantisiri, Haddad, Halavatau, Herren, Holderness, Izac, Jones, Koohafkan, Lal, Lang, McNeely, Mueller, Nisbett, Noble, Pingali, Pinto, Rabbinge, Ravindranath, Rola, Roling, Sage, Settle, Sha, Luo, Simons, Smith, Strzepeck, Swaine, Terry, Tomich, Toulmin, Trigo, Twomlow, Vis, Wilson and Pilgrim2010; Reynolds et al., Reference Reynolds, Crompton and Mills2010). In the tropics, a main concern is the poor performance of growing animals on grasslands as compared with the high-production performance observed in stall-feeding systems. Indeed, most tropical ruminants are fed a diet based essentially on grasslands, which are considered to have a low nutritional value, with large seasonal variations in quantity and quality.
However, previous studies have reported satisfactory performances approaching 1 kg average daily gain (ADG) with only grass and sometimes with minimal amount of concentrate in tropical and Mediterranean settings (Esterhuizen et al., Reference Esterhuizen, Groenewald, Strydom and Hugo2008; Braghieri et al., Reference Braghieri, Pacelli, De Rosa, Girolami, De Palo and Napolitano2011). Current farming systems must balance agro-ecological services and enhancement of biodiversity while reducing inputs and controlling output of greenhouse gases to be truly multifunctional. Thus, grassland-based systems provide many benefits that must be considered in the balance of the cost equation for production efficiency (Boval and Dixon, Reference Boval and Dixon2012; O’Mara, Reference O’Mara2012).
Despite an array of studies conducted in various grazing conditions, it is not yet possible to easily determine the diet consumed by animals under various grazing conditions and the resulting performance in order to promote efficient new management strategies. Feeding is the main determinant of animal performance, because it interacts with the health and adaptive capacities of grazing animals. As a result, additional knowledge is needed to better quantify feed efficiency and its components in the pasture, as well as to promote efficient management strategies.
Therefore, we performed a fine-grained quantitative analysis of the literature by considering only experiments that were conducted in the pasture and quantified results for digestible nutrient intake. This meta-analysis considered various tropical conditions with different cattle breeds and management strategies to quantify achievable nutrient intake levels in grasslands and the implications for animal performance.
Material and methods
Literature review and dataset construction
This meta-analysis focused on growing cattle in grazing trials offering C4 grasses on all continents under various tropical conditions between −37 and 37° latitude. The literature research was performed using the INRA library’s ‘Web of Knowledge’, ‘Science Direct’, ‘EDP Sciences’ and ‘Cambridge Journals’ search engines. The resulting reference lists of publications were screened for further study. Only publications containing ADG and digestible intake characteristics (intake levels and/or diet digestibility) were selected for the subsequent construction of the database.
For each retained publication, a specific study code was assigned and the following characteristics were recorded in the database: site (latitude, longitude), season (dry or rainy), livestock (breed, gender, age, BW) and management strategies (continuous or rotational grazing, herded or tethered, stocking rate (SR) or herbage allowance). For the climate data, the average annual temperature and rainfall were reported when provided or otherwise extrapolated from the UNFAO data (http://www.fao.org/nr/climpag/globgrids/KC_classification_en.asp) based on the Köppen–Geiger climate classification (Peel et al., Reference Peel, Finlayson and McMahon2007). This classification was also used to specify climatic conditions for every publication (tropical and humid, sub-tropical and humid, semi-arid, warm and arid conditions). The breeds involved in the studies were classified into the following three groups to facilitate the analysis, according to the classification by Felius et al. (Reference Felius, Koolmees and Theunissen2011): Meat breed (i.e. Hereford), Mixed breeds (i.e. the Bos taurus Zebu and Brahman Shorthorn) and Zebu breeds (i.e. Creole breeds, Azawak, Borono and Zebu). In addition to a specific study code (identifying each publication), other codes were used to identify variation factors that were tested in the studies, which were mainly related to management strategies, to more precisely analyze their effects. Notably, we analyzed the impact of qualitative factors such as the season, continuous or rotational grazing and in a herd or with a tether, or quantitative indicators of management such as the SR or herbage mass.
For each publication, we only integrated experiments and treatments for which there was at least one value for ADG, dry matter intake (DMI) and dry matter digestibility (DMD) or digestible DMI (DDMI). The final database comprised 17 publications (n pub=17), 41 experiments (n exp=41) and 140 treatments (n=140).
The ADG was expressed in g per kg BW to account for between-breed differences in initial body mass. DDMI values were taken from the publications if available or calculated by multiplying DMI by diet DMD. Approximately half of the papers expressed intake, digestibility and/or forage and diet characteristics in terms of organic matter (OM). These data were expressed as % of dry matter or by using OM content when cited in the publication. Alternately, they were expressed using the average value for OM in the whole database (i.e. 90.4%, s.d.=1.95, n=41). In order to assess how well cattle utilized their ration at pasture, the global feed conversion efficiency (FCE) was calculated as ADG/g DMI, as well as its two components, simply calculated by the following equation:
 $${\rm FCE=ADG/DMI=(ADG/DDMI){\times}(DDMI/DMI)}{\rm .}$$
In this equation, the metabolic FCE is calculated by dividing ADG by DDMI and the digestive FCE or digestibility is calculated by dividing DDMI by DMI.
Forages were described as precisely as possible: species, height, biomass, NDF and CP, among others, were evaluated when available. Energy supplement data were also included in the database if available, as well as the amounts of DM offered and ingested. We also specified and classified the measurement methods for diet digestibility (in vitro DMD on extrusa samples or DMD from fecal analyses) and intake levels (based on markers, total collection of feces or other methods).
Statistical analyses
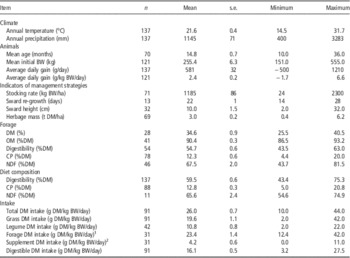
Descriptive statistics were calculated for each variable (mean, r.m.s.e., range; Table 1) and treated in the meta-analysis according to the guidelines described by Sauvant et al. (Reference Sauvant, Schmidely, Daudin and St-Pierre2008), as described below. Relationships between dependent variables (ADG g/kg BW) and explanatory variables (X j ) were studied with variance–covariance analyses using the GLM procedure (Minitab 16). Thus, global variations – that is, across and intra-experimental variations – were split. Given the fairly low number of studies and that the experimental conditions were specific to each study (including the method used for DMD and DMI measurements) and not randomly distributed, the experimental effect was treated as a fixed effect. In addition, we wanted to interpret the inter-experimental heterogeneity, which precluded the use of a random effect. In some cases, factors were nested into the ‘publication code’ as in d’Alexis et al. (Reference d’Alexis, Sauvant and Boval2013). The statistical model was as follows:
 $${ Y_{ijk}}=\mu { {\plus}}\alpha {_{ i}{\plus}}\beta {_{ 1j}X_{j}{\plus}}\beta {_{2j}X_{j}}^{{\rm 2}} {{\plus}e_{ijk},}$$
where μ is the overall intercept, α i the effect of the experimental group (possibly nested in ‘publication code’) in the intercept, β 1j and β 2j the linear and quadratic terms (when significant) for the explanatory variables X j . The term e ijk is the random error term of the model. Interactions between α i and X j were tested when relevant. R 2 and specific R 2 were calculated for each model. Specific R 2 was calculated as the ratio of the sum of squared deviations of the explanatory variable for the same sum plus the sum of the squared deviations of the error.
Descriptive statistics of various data on animals, resources and environment extracted from the various publications analyzed in this meta-analysisFootnote 1

DM=dry matter; OM=organic matter.
1 Chacon et al. (Reference Chacon, Stobbs and Dale1978), Romero and Siebert (Reference Romero and Siebert1980), Boval et al. (Reference Boval, Peyraud and Xande1996), Petty et al. (Reference Petty, Poppi and Triglone1998), Ramos et al. (Reference Ramos, Mendoza, Aranda, Garcia-Bojalil, Barcena and Alanis1998), Cabrera et al. (Reference Cabrera, Mendoza, Aranda, Garcia-Bojalil, Barcena and Ramos2000), Sprinkle et al. (Reference Sprinkle, Holloway, Warrington, Ellis, Stuth, Forbes and Greene2000), Ackerman et al. (Reference Ackerman, Purvis, Horn, Paisley, Reuter and Bodine2001), Aranda et al. (Reference Aranda, Mendoza, Garcia-Bojalil and Castrejon2001), Ayantunde et al. (Reference Ayantunde, Fernandez-Rivera, Hiernaux, Keulen, Udo and Chanono2001), Boval et al. (Reference Boval, Cruz, Ledet, Coppry, Borel and Archimède2002), Bodine and Purvis (Reference Bodine and Purvis2003), Gomez-Vazquez et al. (Reference Gomez-Vazquez, Perez, Mendoza, Aranda and Hernandez2003), Alonso et al. (Reference Alonso, Maquivar, Galina, Mendoza, Guzmán, Estrada, Villareal and Molina2008), Ayantunde et al. (Reference Ayantunde, Fernández-Rivera, Hiernaux and Tabo2008), Dixon and Coates (Reference Dixon and Coates2008), Pereira et al. (Reference Pereira, Tarre, Macedo, de Paula Rezende, Alves, Urquiaga and Boddey2009).
2 Only papers offering supplemented diets, with or without a control level.
The quality of fit for each relationship was examined by studying the normality of the residuals of the model. Outliers were identified based on the normalized residuals (less than −3 or greater than +3) and removed from the analyses (e.g. three outliers were removed for ADG).
The initial step of the analysis considered the contextual influences of the studies and the management strategies. As the calculation of reliable within-experiment responses requires a minimum variation for each explanatory variable within an experimental group (Sauvant et al., Reference Sauvant, Schmidely, Daudin and St-Pierre2008), only those studies reporting ADG values were considered. If several ADG values were related to a particular level of X j (i.e. one SR or one herbage allowance level), one mean ADG value was reported. The second step of the analysis considered the whole dataset to describe the relationship between ADG and DDMI (in g DM/kg BW/day), when stated, with the experimental group.
Results
Description of the dataset and the meta-design
The distribution of data varied throughout the publications, and the ADG values were more or less combined with the DMI measurements or with the various management strategies. Therefore, to maximize the precision of the factor effects, we used various subsets of data: ADG and DDMI values, information on the distribution of concentrates, herbage allowance values or herbage mass values and ADG and SR values. The variables retrieved from all the publications selected according to our criteria are presented in Table 1.
Performance achieved in diverse climatic conditions and with different breeds of cattle
The available data were first split into groups according to the breed and the climatic zone in each trial (Table 2). The lowest ADG estimates were associated with warm arid climate in Zebu breeds (0.55 g/kg BW, representing 132 g ADG/day) based on data sourced from two publications, whereas the highest ADG performance was found in semi-arid climate in mixed breeds (3.36 g/kg BW, representing 735 g ADG/day). However, these values were not significantly different when compared with the inter-publication variability (nested model).
Average daily gain values (ADG values g/kg BW) for different breeds (meat, mixed and zebu) and climatic zones taken into account in the publications considered under this meta-analysis

Meat breed: Hereford.
Mixed breeds: Zebu–Bos taurus or Brahman–Shorthorn.
Zebu breeds: Creole, Azawak, Borono and Zebu.
Beyond these global variations due to climate zones and breeds, the season was also identified as a determinant of the observed differences in ADG. Across the complete set of publications considered, ADG was higher during the rainy season by 1.09 g/kg BW (n=137, n exp=17, r.m.s.e.=1.14, R 2=0.62, R 2specific=0.03, <0.001) compared with the dry season. When considering only studies that evaluated the effect of seasons, ADG was similar as previously described – that is, 1.09 g/kg BW higher in the rainy season compared with the dry season (n=86, n exp=11, r.m.s.e.=1.09, R 2=0.71, R 2specific=0.19, P=0.0001). However, evaluation of the residual variation resulting from this analysis demonstrated that only one publication (Petty et al., Reference Petty, Poppi and Triglone1998) found an opposite influence of the season on ADG. Excluding the two atypical treatments of this experiment led to a larger seasonal effect (1.38 g/kg BW during the rainy season, n=76, n exp=10, r.m.s.e.=1.07, R 2=0.75, R 2specific=0.28, P=0.0001).
Effect of management strategies on performance
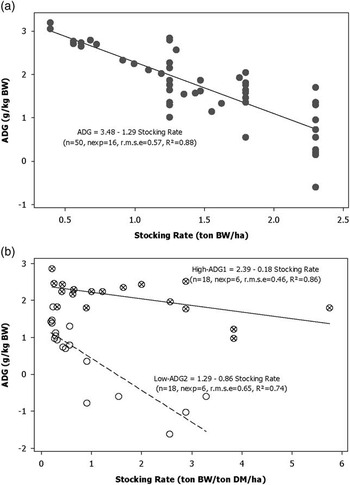
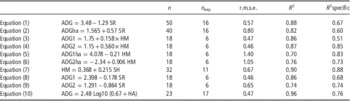
The most widely studied strategy in the analyzed set of publications was variation in SR. Considering the nine publications that documented SR (ton BW/ha), we found that the intra-publication ADG decreased significantly by 1.19 g/kg BW per additional ton of BW/ha (n=74, n exp=9, r.m.s.e.=1.07, R 2=0.49, R 2specific=0.03, P<0.0001). Considering only the five publications that actually tested SR variation, the ADG decreased along with SR, although the relationship between ADG and SR was much more precise than that previously cited above (Figure 1a, equation (1), Table 3). In comparison with the previous equation, the ADG calculated per hectare (ADGha) considering up to 2 tons SR per ha (greater values exhibited a variability that was too large due to one paper, that is Chacon et al., Reference Chacon, Stobbs and Dale1978) increased by an average of 0.57 per unit SR (BW ton/ha, equation (2), Table 3).
Average daily gain (ADG) as a function of the stocking rate expressed (a) in ton BW/ha and (b) per ton BW/ton DM/ha, calculated for two different average ADG (high ADG of 2.09±1.09 g/kg BW/day and low ADG of 0.46±1.06 g/kg BW/day).

Various equations (1) to (10) relating mainly performance and average daily gain (ADG, g/kg BW) to other key parameters related to management strategies, such as stocking rate (SR, ton BW/ha), herbage mass (HM, ton DM/ha), sward height (SH, cm) and herbage allowance (HA, kg DM/kg BW)

ADGha: ADG expressed per ha (g/kg BW/ha).
ADG1: ADG (g/kg BW) for high-ADG animals, on average of 2.09 g/kg BW/day.
ADG2: ADG (g/kg BW) for low-ADG animals, on average of 0.46 g/kg BW/day.
ADG1ha: ADG (g/kg BW/ha) for high-ADG animals, on average of 2.09 g/kg BW/day.
ADG2ha: ADG (g/kg BW/ha) for low-ADG animals, on average of 0.46 g/kg BW/day.
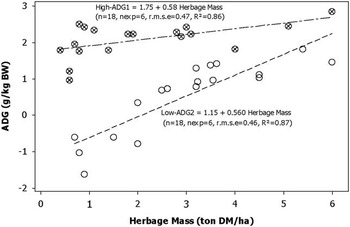
For the same set of experiments, ADG evolved with the herbage mass (ton DM/ha, Figure 2) along two different slopes according to the average intra-experimental level of ADG. An initial group (ADG1) with high-ADG animals (on average of 2.09 g/kg BW/day±1.09), exhibited an increase of ~0.158 g/kg BW per additional ton DM/ha (equation (3), Table 3). The second group (ADG2) consisting of low-ADG animals (on average of 0.46 g/kg BW/day±1.06) displayed a larger impact of herbage mass on ADG (equation (4), Table 3). The ADG per ha for these two groups (ADG1ha and ADG2ha) revealed no variation per additional ton of DM/ha for the first group, and an increase of 0.90 kg BW/ha for the second group (equations (5) and (6), Table 3). Weight gain also correlated well with grass height, which in turn correlated well with herbage mass (equation (7), Table 3). Consequently, SR expressed per ton BW per ton DM/ha affected ADG (Figure 1b) to a lesser extent than SR expressed per ton BW/ha (i.e. Figure 1a). The ADG1 presented a decrease by 0.18 g per additional ton BW/ton DM/ha (equation (8), Table 3), whereas ADG2 decreased by 0.86 g/additional ton of BW/ton DM/ha (equation (9), Table 3) but remained less than the results presented in Figure 2 (equation (1)).
Average daily gain (ADG) (g/kg BW) as a function of the herbage mass expressed in ton DM/ha. ADG1: High ADG of 2.09 g/kg BW/day; ADG2: Low ADG of 0.46 g/kg BW/day.

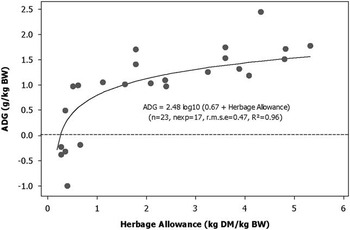
The SR expressed as ton BW per ton DM/ha was equivalent to the herbage allowance, as kg DM per kg BW, and we developed a relationship between ADG and herbage allowance based on the data from a study (Figure 3, equation (10), Table 3) reported by Chacon et al. (Reference Chacon, Stobbs and Dale1978).
Average daily gain (ADG) (g/kg BW) as a function of the herbage allowance (kg DM/kg BW).

Intra-publicational effect of rotational grazing or continuous grazing was never evaluated. After considering the experiments at similar SR, ADG was not significantly different between continuous v. rotational grazing (n=140, P=0.256), averaging 2.33±1.73 g/kg BW for continuous grazing and 2.72±0.72 g/kg BW for rotational grazing.
The effect of grass v. legume on ADG could not be assessed for the full database because it was only assessed in two papers (Romero and Siebert, Reference Romero and Siebert1980; Pereira et al., Reference Pereira, Tarre, Macedo, de Paula Rezende, Alves, Urquiaga and Boddey2009), showing that ADG was not significantly affected by the type of forage (average of 3.49±1.51 for a grass–legume mix v. 2.03±1.77 g/kg BW for grass alone; P<0.005).
Achievable nutrient intake on grasslands and impact on growth of cattle
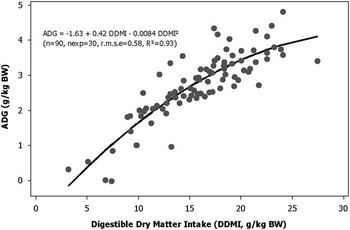
ADG response to energy intake: intra-experimental performance based on 90 treatments followed a curvilinear relationship with DDMI (g/kg BW), which is the major driver of nutrient input (equation (11), Table 4 and Figure 4). For a low DDMI value – for example, 10 g/kg BW – the marginal response of ADG increase (i.e. the slope) was ~0.25 g of BW per additional g of DDMI. This value decreased to a minimum of 0 for the maximum observed DDMI supplied – that is, ~25 g DDMI (Figure 4). Using this approach, we did not consider the four significantly higher DDMI values derived from a single article (Gomez-Vazquez et al., Reference Gomez-Vazquez, Perez, Mendoza, Aranda and Hernandez2003). The interactions between the calculated intra-experimental slopes and adult BW and breed were only significant for adult BW. This general relationship was not significantly affected by the season or SR.
Average daily gain (ADG) (g/kg BW) response to the level of digestible dry matter intake (DDMI, g/kg BW).

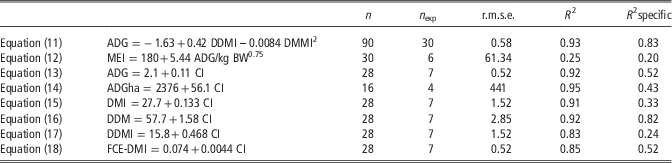
Equations (11) to (18) related to performance and average daily gain (ADG, g/kg BW), metabolizable energy intake (MEI, kcal/kg BW0.75), DM intake (DMI, g/kg BW), DM digestibility (DMD, %), digestible DM intake (DDMI, g/kg BW), metabolic feed efficiency (FCE-DMI, g BW/g DDMI) and concentrate intake (CI, g DM/kg BW)

Estimation of energy requirements: the available data on diet digestibility for the treatments were pooled into 30 coded experiments to calculate the metabolizable energy intake (MEI), by assuming MEI (kcal/kg BW0.75)=6.86+4.02 DOMI g/kg BW0.75 (n=974, R 2=0.99, r.m.s.e.=10.8) according to a regression obtained for a large dataset of various types of ruminants with calorimetric devices (Sauvant et al., unpublished results). The inter-experimental regression relating MEI to ADG for 29 experiments is reported in Table 4 (equation (12)). This equation shows that the mean maintenance requirement for cattle in the database was 180±23 kcal ME/kg BW0.75, whereas the growth requirement was 5.44±1.8 kcal ME/kg of ADG.
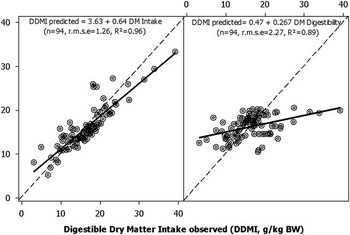
Dietary determinants of ADG: as DDMI is the product of DMI and DMD, these two variables were independently related to ADG to highlight which one had the most influence. ADG and DDMI were better predicted by intake estimates (Figure 5) than by diet digestibility. Furthermore, DMI was not significantly related to DMD (r=0.068, P=0.56).
Digestible dry matter intake (DMMI, g/kg BW) observed in the literature as a function of that predicted based on the dry matter intake (DMI, g/kg BW, left) or the dry matter digestibility (DMD, %, right).

Responses to concentrate supply: considering the subset of experiments in which the concentrate ingested (CI) was a factor, ADG was significantly increased by concentrate intake (CI), regardless of whether it was expressed in g/kg BW or in g BW/ha (equations (13) and (14), Table 4).
Furthermore, total DMI increased by 1.24 g/kg BW with each increase in CI of 1 g/kg BW (equation (15), Table 4). DDM was also significantly improved by CI (equation (16), Table 4), and consequently DDMI/kg BW was improved by CI (equation (17), Table 4).
These results were in part due to the significant decrease of forage intake by CI (FI, g DM/kg BW). The mean substitution rate was dFI/dCI=0.76±0.14. As an outcome, FI per ha was significantly decreased by concentrate intake (by −0.67±0.28 kg FI/ha per g of CI and per kg BW).
Variations in FCE
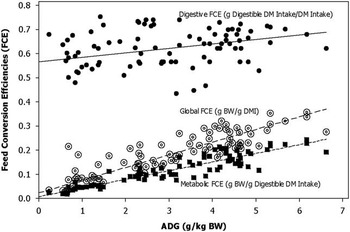
The global FCE (0.11±0.07 g ADG/g DDMI, n=90) was enhanced by the level of ADG (Figure 6) and was split into its two component indexes – that is, digestive FCE (0.62±0.08) and metabolic FCE (0.17±0.11 g ADG/g DMI). As shown in Figure 6, global FCE was much less linked to digestibility (r global=0.55 and r intra=0.48) than to metabolic efficiency (r global=0.96 and r intra-experiment =0.99). This metabolic FCE was also enhanced by CI (equation (18), Table 4). In contrast, global FCE was not improved by CI (P=0.24). Moreover, based on this dataset, there was no significant relationship between CI and factors such as SR and herbage mass.
Evolution of the feed conversion efficiency (FCE), being global (g ADG/g of DM intake, DMI), metabolic (g ADG/g of digestible DMI) or digestive (g digestible DMI/g DMI), depending on the average daily gain (ADG) (g/kg BW).

Discussion
This study is the first meta-analysis to synthesize data on cattle performance in tropical climates. Due to the unbalanced dataset presenting broad variability of treatments while lacking some data, the main regressions presented were calculated using different subsets of data, leading to a focus on intra-experimental studies. Moreover, it was not possible to study the interactions between some major factors such as the breeds and climatic zones. In addition, some relationships were strongly dependent on the consideration in the analysis of particular papers. This limitation resulted from the heterogeneity of factors studied in publications on grazing cattle.
By using keywords such as DMI, DDMI and DMD associated with ADG values, our process was highly selective, allowing us to assess a number of essential relationships such as those between nutrient inputs and performance – that is, ADG. As a result, the performance analyzed appeared highly variable, in some cases reaching over 1.2 kg BW/day (Table 1). Performance levels are partly dependent on contextual factors that are conditioned by both climate and breed potential in different regions. In fact, the “mixed” breeds appeared to demonstrate superior performance in subtropical and semi-arid climates. However, we were not able to further explain these results. In any case, the differences in performance related to climate and breeds remained low compared with the inter-publication variability, further demonstrating the strong influence exerted by the local context. Thus, the season emerged as a significant factor affecting animal performance in the local context. Considering cattle with an average BW of 500 kg, according to the two relationships we provided, ADG could increase by 9% to 38% during humid compared with dry seasons. This effect might be explained by the increase in herbage production and availability during the rainy compared with the dry season. Beyond the season, there can also be broad performance variability linked to nutrient inputs when using the kind of grassland management strategies described below.
Nutrient input at pasture, the major determinant of ADG
Our data demonstrated how nutrients available for grazing animals – that is, DDMI calculated from the DMI and DMD data available in our database ranging from 3.2 to 39.2 g/kg BW/day – were good predictors of ADG when considered alone (n exp=30 and r.m.s.e.=0.58 g/kg BW, i.e., a coefficient of variation of ~24%). This highlights the importance of quantifying both DMI and DMD in in situ conditions in order to precisely explain animal performance. Considering several experiments for tropical contexts or even for other temperate contexts, this curvilinear response of grazing animals has never been reported previously, despite remaining consistent with other relationships published by Coleman and Moore (Reference Coleman and Moore2003) that were not retained in our dataset. The curvilinearity is in fact due to the relatively older age of heavier animals compounded by a carcass weight that likely contains a richer lipid composition compared with lighter animals.
To support our approach, we used DDMI to calculate the energy input in terms of metabolizable energy as described by Salah et al. (Reference Salah, Sauvant and Archimède2014). In addition, the intercept, which corresponds to a null ADG, was equal to 180 Kcal/kg BW0.75, which is an estimate of the maintenance requirements for grazing livestock. This value was 20% and 27.6% higher than those reported in two studies on tropical cattle under in-house conditions (Calegare et al., Reference Calegare, Alencar, Packer and Lanna2007; Salah et al., Reference Salah, Sauvant and Archimède2014). Those studies reported maintenance requirements for energy of 150 and 141 kcal/kg BW0.75, respectively. The elevated value determined in our study, likely resulted from grazing and physical movements, which increased energy requirements estimated as 20.6 to 22.4 kcal/BW0.75 per day, being about 20% higher compared with in-house conditions (Aharoni et al. Reference Aharoni, Henkin, Ezra, Dolev, Shabtay, Orlov, Yehuda and Brosh2009; Kaufmann et al., Reference Kaufmann, Munger, Rerat, Junghans, Gors, Metges and Dohme-Meier2011). The growth energy requirement estimated herein – that is, 5.44±1.8 Kcal/g ADG – was similar to the 5.78 and 5.74 kcal ME/kg ADG reported by Salah et al. (Reference Salah, Sauvant and Archimède2014) and Calegare et al. (Reference Calegare, Alencar, Packer and Lanna2007), respectively. These results suggest that our estimations are consistent with recent recommendations for feeding cattle under tropical conditions, while highlighting the additional energy input required during grazing.
Considering the main parameters studied in many publications, we also highlighted that intake was the major determinant of ADG at pasture (Figure 5). This was an important finding as most studies on animal performance focus on measurements of digestibility, primarily because they are conducted under controlled conditions in stalls or feedlots where digestibility and intake are strongly related (Bruinenberg et al., Reference Bruinenberg, Valk, Korevaar and Struik2002). However, some studies have already reported that intake is a major determinant, since long time (Coleman and Moore, Reference Coleman and Moore2003). According to Milford and Minson (Reference Milford and Minson1965), Lippke (Reference Lippke1980) and Boval et al. (Reference Boval, Fanchone, Archimede and Gibb2007), the digestible DMI of tropical grasses and animal gain correlated more with the intake of DM than with its digestibility. More recently, considering a wide range of forage mass or allowance, a high proportion of variation in ADG (60% to 90%) was explained by the forage quantity and its relationships with animal performance, whereas several measures of forage nutritive value were not significant (Garay et al., Reference Garay, Sollenberger, McDonald, Ruegsegger, Kalmbacher and Mislevy2004; Sollenberger and Vanzant, Reference Sollenberger and Vanzant2011). The difficulties involved in measuring intake of grass under grazing conditions, as recently reviewed by Cottle et al. (Reference Cottle2013), might explain these contradictory results, as very few studies have been conducted under real grazing conditions. The published studies utilizing pasture conditions have typically focused on short-term ingestive behavior and intake rate alone and have rarely combined these factor with more integrative parameters on a daily scale that would demonstrate a real link between nutrient inputs and performance (Gregorini et al., Reference Gregorini, Gunter and Beck2008; Kondo, Reference Kondo2011). Our meta-analysis showed that assessment of the amount of DM consumed via big bites provided more robust results than increasing the quality of grass offered under grazing conditions, as previously reported by Sollenberger and Vanzant (Reference Sollenberger and Vanzant2011).
In the study set analyzed, concentrate supplementation to increase nutrient input at pasture was mainly based on maize, soybean and urea. Concentrate intake had a positive effect on ADG per animal or per ha, with a maximum of ~3.5 g/kg BW of ADG, consistent with values published by other authors investigating tropical contexts (Leng, Reference Leng1990; Poppi and McLennan, Reference Poppi and McLennan1995; Dixon and Egan, Reference Dixon and Egan2000). More recently, a meta-analysis including studies comparing feeding in stalls and at pasture (Agastin et al., Reference Agastin, Sauvant, Naves and Boval2014) showed that CI is related to ADG (slope of 0.13), which is very similar to the slope calculated in the present study from a different set of published data. The concentrate intake effect on DDMI was also measured, and the calculated substitution rate (i.e. 0.76±0.14) was consistent with other reported values, even under temperate conditions (Agabriel, Reference Agabriel2007). These results demonstrated that supplementation under grazing conditions might be a practical strategy to mitigate the seasonal variations of feeding and improve performance at pasture. Thus, as in crop-livestock systems, cereal, crop residues and other by-products may prove useful as supplements in developing economies (Archimède et al., Reference Archimède, Eugène, Marie Magdeleine, Boval, Martin, Morgavi, Lecomte and Doreau2011), as they have little alternative value and are often available on a seasonal basis (Devendra and Leng, Reference Devendra and Leng2011).
Our results confirmed that FCE depended mainly on performance level (ADG/kg BW), as our datasets allowed FCE to be divided into its two components: digestive and metabolic. Metabolic conversion (g ADG/g DMI, Figure 5) more than digestive conversion was the main determinant of the global conversion efficiency due to diluted maintenance of energy requirements. The ranking between these two components was effectively the outcome of the metabolic efficiency values close to 0 when ADG was 0 while digestibility remained at 0.5 to 6 (Figure 5). The mean value (~0.11 g±0.07 g ADG/g DMI) indicated a feed conversion ratio by 9 kg DM per kg of ADG and a feed requirement of 18 kg DM per kg of carcass, considering a global carcass weight of 50%. This value was fairly high compared with those provided for more intensive cereal-feed production. Indeed, Godfray et al. (Reference Godfray, Beddington, Crute, Haddad, Lawrence, Muir, Pretty, Robinson, Thomas and Toulmin2010) stated that the required feed for cattle to produce 1 kg of beef was 8 kg cereal. Moreover, after deducting the feed inputs from ‘crop residues’ and ‘non-arable forage’, the conversion of ‘feeds from arable land’ to meat was ~3/1 for ruminants (Wilkinson, Reference Wilkinson2011). As a result, cattle can be kept in pastures unsuitable for arable crops without competing with other human activities. This finding is of major importance due to the consensus that increasing yields on existing agricultural land without resorting to further expansion is a key component of food security (Wirsenius et al., Reference Wirsenius, Azar and Berndes2010).
Influence of management strategies on ADG
Optimal animal management at pasture is essential to increase nutrient input and feed efficiency per unit area of land. The effect of SR on ADG has been extensively reported in studies that we have considered in our database, provided they reported intake measurements under grazing and tropical conditions. Based on the literature, it was difficult to reliably assess other management strategies, and therefore increase visibility to further enhance animal performances in tropical grasslands. Thus, in addition to the SR impact, we only recorded a tendency to increase ADG by using a mixture of grass and legumes rather than grass alone. Although this trend was not significant, it was consistent with the results of published studies that specifically addressed these strategies (Dixon and Coates, Reference Dixon and Coates2008; Boval and Dixon, Reference Boval and Dixon2012).
The SR is a key parameter establishing the relationships between animals and total land area in the grazing system and was generally expressed as the number of animals per ha (Allen et al., Reference Allen, Batello, Berretta, Hodgson, Kothmann, Li, McIvor, Milne, Morris, Peeters and Sanderson2011). The expression of SR is of limited value for comparisons across studies, whereas the expression as kg BW per ha has the advantage of being more closely linked to the quantity of biomass potentially removed by the animal (Sollenberger et al., Reference Sollenberger, Moore, Allen and Pedreira2005; Allen et al., Reference Allen, Batello, Berretta, Hodgson, Kothmann, Li, McIvor, Milne, Morris, Peeters and Sanderson2011). For instance, it has been shown that the SR expressed as kg BW per ha is a valuable factor for gauging the positive effect of mixing cattle and small ruminants (d’Alexis et al., Reference d’Alexis, Sauvant and Boval2013).
From our database, SR expressed as kg BW per ha had a negative effect on the individual ADG (by 1.3 g/kg BW) but a positive effect on BWG/ha (by+0.57 per additional ton/ha), as previously reported by Coleman and Forbes (Reference Coleman and Forbes1998). Nevertheless, additional data are needed to evaluate the influence of high SRs (>2 tons BW/ha), because the responses observed in this range of SR vary strongly according to the experimental conditions. In addition, in this range, it would be particularly useful to focus on indexes of overgrazing, durability and ecological impact (Vetter, Reference Vetter2005).
In our database, estimates of grass mass enabled us to further express SR per kg BW and per ton DM, permitting the assessment of an actual SR that considered the true biomass available per ha. In this way (Figure 2b), the effect of SR on ADG was lower (with smaller slopes) compared with the expression of SR that considered only the land area. Beyond the importance of SR, its expression should be carefully considered in management implementation strategies. The SR expressed as kg BW per ton of DM is better suited for forecasting the instantaneous animal-to-forage relationship and appropriate grazing pressure, within a given context and without any deleterious use of the grassland (Allen et al., Reference Allen, Batello, Berretta, Hodgson, Kothmann, Li, McIvor, Milne, Morris, Peeters and Sanderson2011). The inverse of this expression of SR represents, in fact, the herbage allowance per unit of animal (kg forage per kg BW). In addition, the evolution of ADG with the herbage allowance highlighted here provides a good explanation of the variations in forage intake by grazing ruminants, as calculated previously (Sollenberger and Vanzant, Reference Sollenberger and Vanzant2011; Boval and Dixon, Reference Boval and Dixon2012).
With a greater focus on the herbage–animal relationships, the characteristics of the herbage mass may impact ADG in various ways. As demonstrated in the present study, the evolution of ADG with the herbage mass was lesser in some experiments when the ADG was already high (Figure 2) but increased substantially when the ADG was lower initially. This discrepancy was mainly due to the study by Chacon et al. (Reference Chacon, Stobbs and Dale1978), who observed that for equivalent herbage masses (during summer and autumn in 1974) grazing cattle were unable to satisfy their requirements in the same way. For 3 consecutive years, the large seasonal variations in grazing conditions resulted in changes in the spatial distribution of the dry matter within the sward profile, and greatly influenced the growth of the steers. In fact, the low-ADG animals, on some sward profile, took bites that were too small in size, and therefore they required more grazing time to compensate. Consequently, the change in herbage mass or SR (Figure 1b) had more effect on the evolution of their low ADG than for the high-ADG animals. Therefore, in addition to the herbage mass per ha, the inclusion of additional characteristics of the herbage – some physical others chemical – may modify how the SR is conceived and managed.
Conclusions
This meta-analysis of ~41 experiments increases knowledge of feed efficiency by shedding new light on many important parameters that affect feeding growing cattle and their performance in tropical grasslands. This meta-analysis (i) provides a better quantification in various real grazing situations of characteristics of diet and performance, while allowing an estimation of energy requirements for grazing animals, (ii) identifies relationships between digestibility, metabolizable energy consumption and performance, which are essential to effectively manage pastures and (iii) describes general data about some management levers such as complementation and SR, in order to better consider their implementation.
These results based on published data provide promising prospects for the rational improvement of cattle feeding and performance in tropical natural grasslands.
Acknowledgements
The authors wish to express their gratitude to Dr Michel Naves for his expertise for cattle production in the Tropics and his contribution to the coding of the studies.