1. Introduction
The impact of European immigration on the human capital formation and subsequent development path in the New World is an important topic in growth economics as well as in economic history. Glaeser et al. (Reference Glaeser, Porta, Lopez-De-Silanes and Shleifer2004) acknowledged that the human capital brought by European settlers to some former colonies was the main driver of future development. Migrants’ human capital affected economic growth both directly (by increasing productivity) as well as through its effect on the quality of institutions. According to this perspective, the United States, Canada or the River Plate, also called «settler colonies», attracted more and better skilled European settlers during colonial times than «non-settler colonies» such as, for instance, the Andes or the West Indies. The higher human capital levels in the first set of colonies allowed them to develop «good institutions», such as courts, property rights and other constraints on the executive, that are favourable for investments. The latter failed to attract educated European migrants and developed extractive institutions, which promoted inequality and in turn hampered long-term developmentFootnote 1 .
Another perspective that highlights the historical roots of economic development — most prominently held by Acemoglu et al. (Reference Acemoglu, Johnson and Robinson2001, Reference Acemoglu, Johnson and Robinson2002) — is that the institutions implemented by colonists are at the genesis of human capital formation and economic development. In areas where Europeans settled, mostly because the geographic and climatic conditions were appropriate, they set up European-like «inclusive institutions», promoting public investment in schooling and thereby contributing to human capital formation. At the other extreme, colonists set in place economic institutions that allowed them to extract the resources of the colonies, such as forms of labour coercion and exclusion of the indigenous population from political participation and education. Furthermore, the latter colonies that became dominated by a wealthy class of large landowners, may not only have invested less in schooling of the massesFootnote 2 , but also have attracted the less skilled immigrants, and thereby further hampered long-run human capital formation and economic growth (as held by Abramitzky and Braggion Reference Abramitzky and Braggion2006). These studies highlight the importance of the human capital of migrants for the economic development of receiving nations. By analyzing the patterns and skills of European transatlantic migration to Cuba, the present paper contributes to our understanding of Latin America’s path-dependent human capital and institutional formation process.
Most country case studies have found a positive contribution of European immigrants to human capital formation in New World destination countries. Sánchez Alonso (Reference Sánchez Alonso2007), her focus being on the River Plate, argues that 19th century immigrants displayed higher literacy levels than natives, and thus European immigration contributed to raise human capital levels. Stolz et al. (Reference Stolz, Baten and Botelho2013) find that European immigration helped raise numeracy levels in Brazil. Those provinces that displayed higher immigration rates also entered a steeper path of human capital accumulation. The human capital embodied by migrants probably not only raised the average skill level directly and was passed on to second and third migrant generations, but also spilled over to the native Brazilian population, which may have benefitted from the creation of schools and hospitals by Europeans. In a similar vein, Droller (Reference Droller2014) finds that counties in the Argentinean Pampa that received more European immigrants in the late 19th century entered a steeper GDP growth path and display higher levels of education even today. On the other hand, migrants may also have chosen different destinations depending on their embodied human capital. Abramitzky and Braggion (Reference Abramitzky and Braggion2006) measure and compare the human capital of 17th and 18th century English migrants to what later became the United States and to the West Indies, and find that the mainland attracted the better skilled immigrants (from the same origin country). They argue that opportunities to acquire land and be successful as a skilled or ambitious immigrant were much better in the United States, and thus, no well-informed and capable European would choose the West Indies over the mainland.
Clearly, migrants are usually not a random sample of the population at home and mass emigrations can also have consequences for sending nationsFootnote 3 . Long-distance migrants have often been claimed to be more ambitious and entrepreneurial than non-migrants, because it involves costs and energy to leave everything behind and adapt in a new destination country (Chiswick Reference Chiswick1999). Moreover, literacy could be necessary to reach information on foreign labour markets. Wegge (Reference Wegge2002) finds, for the 19th century German province of Hesse-Cassel, that those who belonged to the relatively skilled occupational group of artisans were more prone to emigrate than the lower skilled farmers or wage labourers, meaning that Germany lost human capital to the United States. Artisans could afford the passage costs more easily than wage labourers and faced lower transaction costs in converting their wealth into a portable form than farmers. Sánchez Alonso (Reference Sánchez Alonso2000) holds that migrants to the former Spanish colonies from 1870 to 1930, mostly born in Italy or Spain, originated from the provinces with the highest literacy rates in both countries. Also, compared with potential emigrants of the same province, those who actually left to Latin America were more literate than those who stayed behindFootnote 4 . On the other hand, Mokyr (Reference Mokyr1983) finds that numeracy among Irish emigrants who fled to the United States during and, more so, after the Great Famine was lower than among the Irish population based on their age-heaping behaviour. However, O’Gráda and O’Rourke (Reference O’gráda and O’rourke1997, p. 12) hold that these Irish emigrants were not the poorest of the poor because most of them relied on their own funding to finance migration. And thus, «the receiving countries were not getting the paupers». Also using education-based proxies, Abramitzky et al. (Reference Abramitzky, Boustan and Eriksson2012) find a negative selection of Norwegian migrants to the United States in the period 1850-1914.
This paper contributes to the above streams of literature by exploring the case of 19th century migrants to Cuba. Almost the entirety of Europeans residing in the Caribbean island came from the metropolitan country (Cuba remained a Spanish colony until 1898). But, in view of the high regional differences in human capital within Spain, what did their regional origin distribution look like? How did these migrants perform in terms of education relative to the population that stayed behind, and relative to Cubans? I analyse both the skill selectivity of migrants with respect to the population at home and their human capital contribution to the receiving nation. This makes it possible to draw a better picture of the motivations and consequences of this mass migration. Historical population censuses of Spain and Cuba carried out in the 19th century are used as sources for the human capital analysisFootnote 5 . The measure of human capital used here is «numeracy» — or the ability to deal with numbers — as captured by the age heaping technique, now widely used in early human capital studies (A’Hearn et al. Reference A’hearn, Baten and Crayen2010; Juif and Baten Reference Juif and Baten2013, etc.). Numeracy is mainly determined by education, either at home or through formal schooling, and has been shown to be highly correlated with other human capital measures such as literacy or years of schooling.
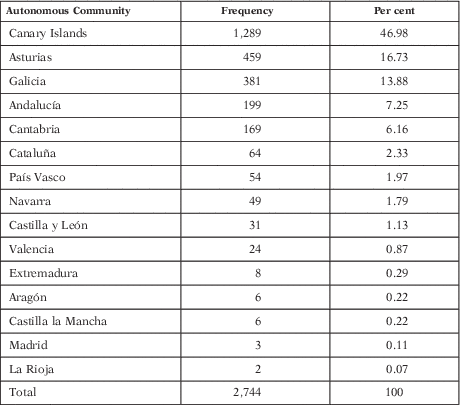
The first finding of this study concerns the distribution of migrants’ regions of origin within Spain: almost half of the migrants born between 1810 and 1859 were from the province of the Canary IslandsFootnote 6 . The rest of free migrants were originally from the Spanish autonomous communities of Asturias, Galicia, Andalusia and Cantabria (in that order). And thus, the mainland Spanish migrants came predominantly from regions with higher than average numeracy (and literacy) levels. This is in line with up-to-date findings of a positive selectivity of Spanish migrants to Latin America in the later 19th century (see Sánchez Alonso Reference Sánchez Alonso1995, Reference Sánchez Alonso2000). However, the other half of Spaniards in Cuba originated from the region with the lowest income and skill levels, the Canarian Archipelago. A second finding is that these migrants belonged to the least educated section of the population at home, one of the few studied cases of negative selection. Third, also compared with the native population in Cuba, these immigrants performed worse in terms of human capital. Building on these findings, the paper will try to provide an explanation for the strong and persistent migration ties between the Canary Islands and Cuba.
The most important «push factor» driving the mass exodus of Canary Islanders involves the harsh crises that hit the agricultural export sector of the ArchipelagoFootnote 7 in the 19th century, affecting especially the poorer and less educated section of the population who worked as farmhands. Many of the wage labourers that became unemployed left for Cuba in search of employment opportunities. On the «pull» side, the Caribbean plantation economy that traditionally relied on coercive labour favoured the influx of a cheap, low-skilled workforce. The system of indentured servitude allowed large landowners to replace the slaves in their sugar estates during the abolition of slavery by cheap white labour, coming largely from the Canary IslandsFootnote 8 .
The paper is structured as follows. Section 2 describes the methodology applied to measure human capital. Section 3 presents the sources and data. Section 4 depicts the main results and Section 5 offers an historical overview of the patterns of 19th century transatlantic migration from Spain, in particular the Canary Islands. Section 6 concludes.
2. The Method
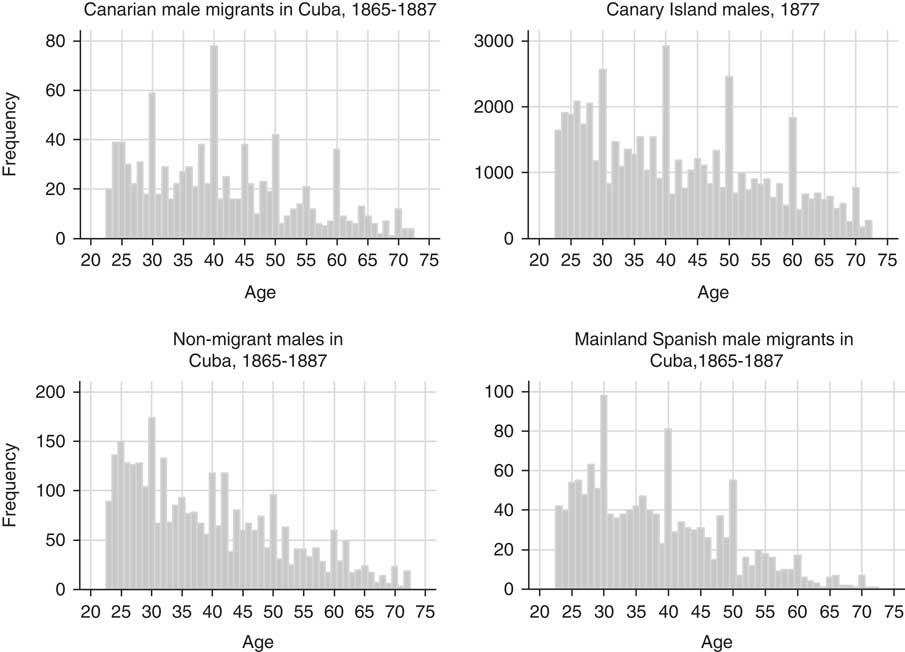
The method used to measure human capital in this study is the age heaping technique, which allows us to analyse and compare skill levels by using population lists that include age statements. Age heaping measures an important component of human capital, which is numeracy, or the ability to deal with numbers. It makes use of the phenomenon given in historical times — and in developing countries even today — that the poorly educated people tend to round their age, generally on multiples of five, when they are asked to state it for census enumerations or other records. This derives uneven age distributions such as those pictured in Figure 1.
AGE DISTRIBUTION IN VARIOUS SUBSAMPLES OF INTEREST
Sources: Cuban censuses of 1865-1887 (Twrdek Reference Twrdek2011) and Spanish census of 1877 (www.ine.es/inebaseweb).

Age heaping is most commonly measured by the Whipple index, which displays the ratio between the preferred ages and the restFootnote 9 . This index measures the proportion of people who state an age ending in five or zero, assuming that each terminal digit should appear with the same frequency in the «true» age distribution (or the degree to which the distribution of age statements approaches an equal distribution). Results range from 0 to 500, where a value of 500 indicates an age distribution with ages ending only on multiples of five and a value of 100 means that there is no heaping pattern on multiples of five, in which case exactly 20 per cent of the population reported an age ending in a multiple of five:
 $${\rm Wh}=\left( {{{({\rm Age}25{\plus}{\rm Age}30{\plus}{\rm Age}35{\plus} \cdots {\plus}{\rm Age}70)} \over {1/5{\times}{\rm Age}23{\plus}{\rm Age}24{\plus}{\rm Age}25{\plus} \cdots {\plus}{\rm Age}72}}} \right){\times}100$$
Only the age range of 23-72 is included, as younger persons can usually guess their age more accurately or the household head could have reported it for them. The older ages are excluded because of selective mortality bias and the tendency of the older generation to exaggerate their age.
For an easier interpretation, A’Hearn et al. (Reference A’hearn, Baten and Crayen2010) suggested an alternative, the ABCC indexFootnote 10 . This is a simple linear transformation of the Whipple index and yields an estimate of the share of individuals who correctly report their age, ranging from 0 to 100, where number 0 means extreme age heaping and 100 no age heaping:
 $${\rm ABCC}=\left( {1{\minus}{{({\rm Wh}{\minus}100)} \over {400}}} \right){\times}100\,if\,{\rm Wh}\geq 100\,else\,{\rm ABCC}=100$$
The share of persons able to report an exact age has been shown to be highly correlated with other measures of human capital, such as literacy and schooling, across countries and individuals and over time (Mokyr Reference Mokyr1983; A’Hearn et al. Reference A’hearn, Baten and Crayen2010)Footnote 11 . The ABCC time trends reported in the figures of this paper depict the heaping of the population born in a particular decade, which is calculated by subtracting the middle of a 10-year age group from the census year.
3. Data Sources
3.1. Description of the Sources
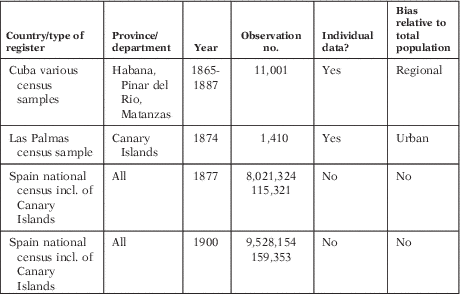
A newly compiled data set allows me to assess the skill selectivity of Canary Islanders and of peninsular Spanish emigrants, as well as to compare their skill levels to those of the native population in Cuba. The sources used are historical population censuses from the Canary Islands and the Spanish peninsula, as well as census lists from Cuba. Table 1 displays a summary of the sources. The sample of Cuban padrones Footnote 12 of 1865-1887 was compiled from the original census documents kept at the national archive of Cuba in La Habana (Twrdek Reference Twrdek2011)Footnote 13 . This source contains individual data including name, gender, age, birthplace, occupation and place of residence. It comprises 11,001 adult individuals (aged 23-72), of whom 42 per cent are foreign born (62 per cent of them in Europe). Of European migrants, 52 per cent are mainland Spanish, 46 per cent are Canary Islanders and 2 per cent originate from another European country.
DESCRIPTIVE STATISTICS OF THE SOURCES (INCLUDES INDIVIDUALS AGED 23-72)

Sources: See text.
A sample of an 1874 census list of individuals residing in the city of Las Palmas was collected in the Provincial Archive of Las Palmas, which includes similar information on an individual level. Moreover, I use the summary reports of the complete Spanish national censuses of 1877 and 1900, downloaded from the website of the national statistics office (www.ine.es). The analysis of this source is based on the published age tabulations (the individual records are not available). These tabulations depict the sum of individuals by age per province and gender.
3.2. Representativeness of the Census Samples of Cuba and Las Palmas
The representativeness of the Cuban census sample of 1865-1887 for Cuba’s whole population was carefully assessed by cross-checking it with the report of a fairly accurate national population census carried out in 1899 by the U.S. authorities under the short period of U.S. rule (Report on the Census of Cuba Reference Beine, Docquier and Rapoport1899)Footnote 14 .
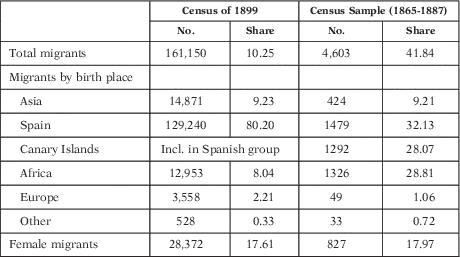
The sample includes all ethnic groups and relevant migrant origins (see Table 2). It comprises 6,398 individuals born in Cuba and 4,603 of migrant originFootnote 15 . Among the migrants, 9 per cent were AsiansFootnote 16 , 60 per cent were born in Spain (half of them in the Canary Islands), 29 per cent in AfricaFootnote 17 and only 2 per cent came from the rest of Europe or other places. Compared with the migrants’ origin distribution in 1899, Africans are slightly overrepresented and Spaniards are underrepresented in the 1865-1887 census sample, but in general the origin of migrants’ distribution is quite accurate. It is also plausible that, given that the slave trade was in decline (and slavery was definitively abolished in 1886), the amount of African-born migrants decreased substantially between 1865 and 1899. Some Spanish immigrants may also have left Cuba after its independence. Only 18 per cent of migrants are female, which is exactly the share of foreign-born women in the census of 1899.
REPRESENTATIVENESS OF CUBAN CENSUS SAMPLE (1865-1887) CROSS-CHECKED WITH CUBAN CENSUS OF 1899

Sources: Report on the census of Cuba, 1899 (http://digital.tcl.sc.edu/) and Cuban censuses of 1865-1887 (Twrdek Reference Twrdek2011).
However, the sample comprises only the western part of the island, the historical provinces of Pinar del Rio, La Habana and MatanzasFootnote 18 . These provinces, the most densely populated ones, accounted for 50 per cent of the population according to the census of 1899. The fact that this part of the island was densely populated and urbanised, as well as being the residence place of most of the island’s elite who also owned the sugar industry (Report on the Census of Cuba Reference Beine, Docquier and Rapoport1899 and Zeuske Reference Zeuske2002), may bias the human capital upwards. The census of 1899 indicates that literacy rates — a commonly used human capital measure — in the historical provinces of La Habana, Pinar del Rio and Matanzas are 53.1 per cent, 18.9 per cent and 34.8 per cent, respectively, altogether 4 per cent above the national average of 36 per centFootnote 19 . It should thus be taken into account that the educational level of those included in the Cuban sample might be slightly higher than the total national average.
The 1974 census of Las Palmas de Gran Canaria only includes the population of the city and its surroundings, and thus is subject to an urban bias. However, the numeracy level was counter-checked with that of the Canary Islands province within the national census of 1877 (which includes only aggregate numbers by age) and turned out to be slightly lower (by three ABCC points).
4. Main Results
4.1. Regional Origin and Skill Selectivity of Spanish Migrants
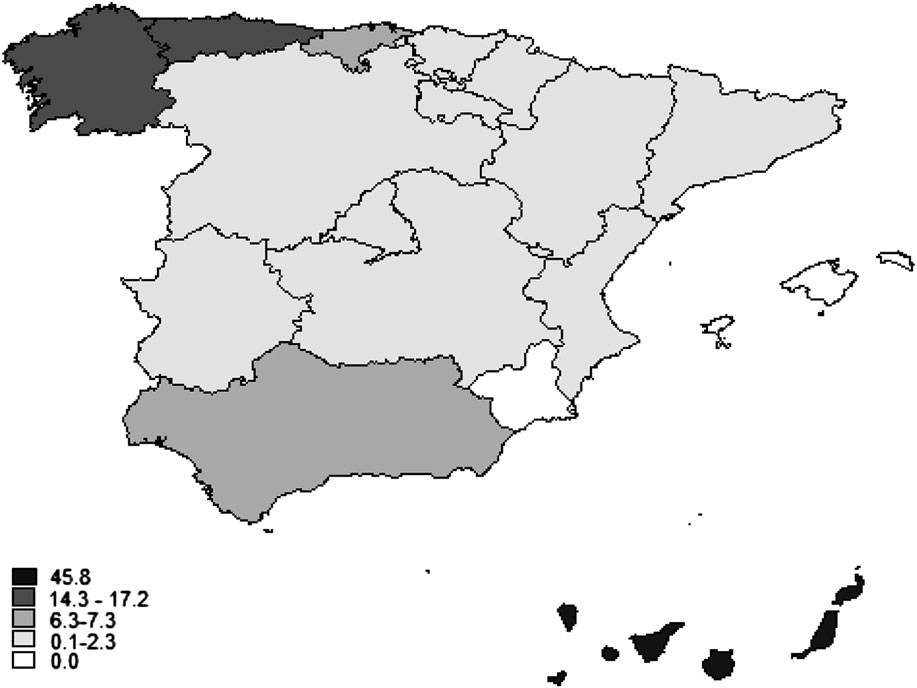
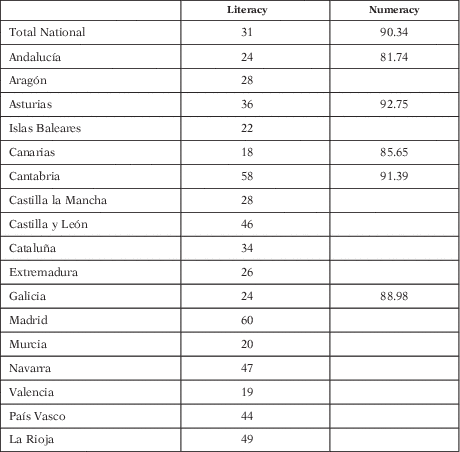
Spanish migrants in Cuba clearly came from only a few regions in Spain: 91 per cent were born in five autonomous communities. These are concentrated in the northwestern part and the south of the Peninsula, as well as the Canary Islands. Figure 2 shows the distribution of Spanish residents included in the Cuban sample by autonomous community of birth. While 45.8 per cent of Spanish migrants were born in the Canary Islands, the three northwestern autonomous communities together — Galicia, Cantabria and Asturias — account for 37.8 per cent and Andalusia for 7.3 per cent of the Spanish migrants. And thus, leaving aside the Canary Islands, the majority of migrants originate from the (northwestern) area of Spain, a region which performs relatively well in terms of literacy and numeracyFootnote 20 .
PERCENTAGE OF SPANISH MIGRANTS IN CUBA BY BIRTH REGION
Sources: Cuban censuses of 1865-1887 (Twrdek Reference Twrdek2011).

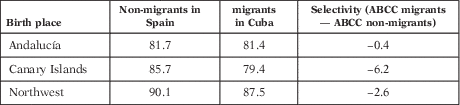
We can also have a closer look at the selectivity of migrants with regard to the non-migrant population of the origin region in Spain with the help of the age heaping techniqueFootnote 21 . The skill selectivity of migrants from the five best represented Spanish autonomous communities is roughly assessed by subtracting the ABCC of migrants from that of non-migrants from the same autonomous community of birth (see Table 3)Footnote 22 . Only very slightly negative skill selectivity is found for migrants from Andalusia as well as the northwestern provinces. Migrants from the Canary Islands are however rather clearly negatively selected.
ABCC OF MIGRANTS, NON-MIGRANTS AND SELECTIVITY

Sources: Cuban censuses of 1865-1887 (Twrdek Reference Twrdek2011) and Spanish census of 1877 (www.ine.es/inebaseweb).
The findings on mainland Spaniards in Cuba are in line with state of the art research on Spanish migration to Latin America in the 19th century. This migration has been claimed to be income and literacy constrained, like most transatlantic migrations (Chiswick Reference Chiswick1999; Hatton and Williamson Reference Hatton and Williamson2002, Reference Hatton and Williamson2008). Sánchez Alonso (Reference Sánchez Alonso2000) argues that in Spanish provinces with higher literacy and income, people had better access to information on foreign labour markets and were more likely to be able to finance the moveFootnote 23 . Therefore, the northern provinces with higher human capital levels display higher emigration ratesFootnote 24 and even within those provinces, the better skilled were possibly more prone to leave for the Americas.
This paper does not challenge this finding for migrants from the Spanish peninsula. However, the Canary Islands was the single province that supplied the largest number of migrants to Cuba (and the province with the highest total emigration rates of Spain) throughout the 19th century although its population was relatively illiterate, innumerate and poor. This is a puzzle I will attempt to solve in the following chapters.
4.2. The Skill Selectivity of Canary Island Migrants
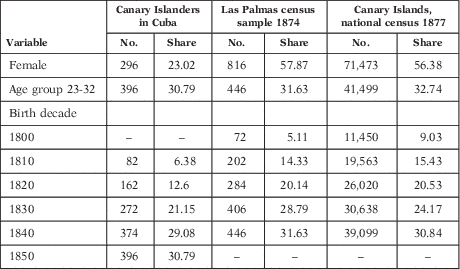
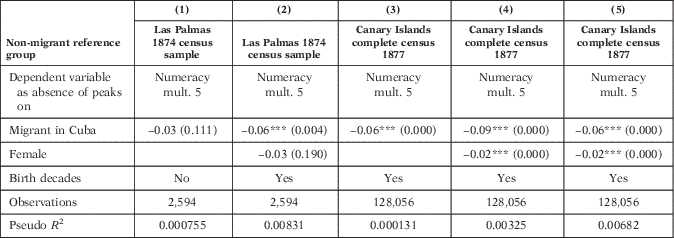
In order to assess the skill selectivity of Canary Island migrants more carefully, a number of robustness checks are performed. Logistic regressions were run to control for the demographic characteristics that may influence numerical skills and also to check whether the results hold for other types of heaping. Table 4 portrays the summary statistics of the explanatory variables and Table 5 shows the regression results.
SUMMARY STATISTICS OF EXPLANATORY VARIABLES BY SAMPLE

Sources: Cuban censuses of 1865-1887 (Twrdek Reference Twrdek2011), Las Palmas census of 1874 (provincial archive of Las Palmas), Spanish census of 1877 (www.ine.es/inebaseweb).
SELECTIVITY OF CANARIAN MIGRANTS TO CUBA IN LOGISTIC REGRESSIONS

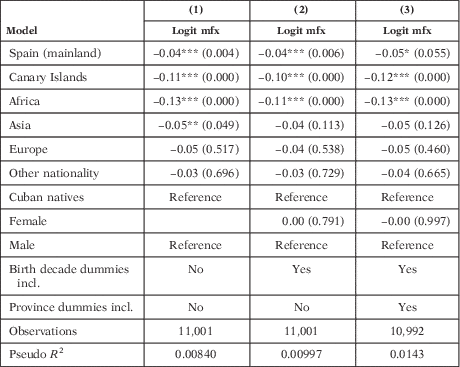
Notes: Reference category is a non-migrant male, born between 1830 and 1839, residing (and born, in Models 1-2) in the Canary Islands. The dependent variable is numeracy, reflecting the absence of heaping on multiples of five in Models 1-4 and on multiples of ten in Model 5. Robust P-values in parentheses: ***P<0.01, **P<0.05, *P<0.10.
Sources: Cuban censuses of 1865-1887 (Twrdek Reference Twrdek2011), Las Palmas census of 1874 (provincial archive of Las Palmas), Spanish census of 1877 (www.ine.es/inebaseweb).
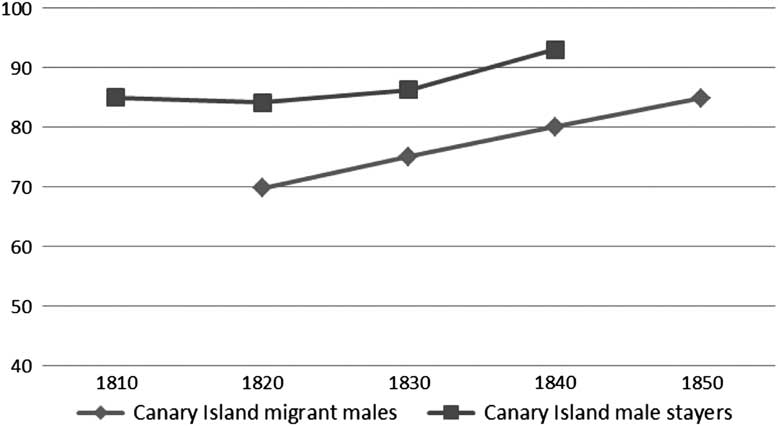
The sample used for the regression analysis includes the (native) residents of the Canary Islands as well as the Canary Islanders included in the Cuban census sample of 1865-1887. Models 1 and 2 in Table 5 use the sample of the Las Palmas census from 1874, available on an individual level, to account for the non-migrant population of the Canary Islands. Models 3-5 use the age structure of the Canary Island population derived from the 1877 census report instead (the individual observations were imputed based on the published age tabulations, available by gender). The dependent dummy variable «numeracy» is coded as 0 when the age stated was a multiple of five and as 1 if not. As a robustness check, Model 5 uses a dependent variable that reflects the absence of heaping on multiples of ten only (and the coefficient for «migrant in Cuba» remains significant, though slightly less negative). A logistic regression model is used because it fits best for a dichotomous dependent variableFootnote 25 . It is necessary to control for gender by including the variable «female», since migrants were mostly males and the educational bias in favour of men was considerable at the time. Dummy variables for the decades of birth are also included, in order to control for birth cohort and age effects (younger people tended to heap less)Footnote 26 . Table 5 portrays the marginal effects at a representative value, because they are more informative than the actual coefficients (Cameron and Trivedi Reference Cameron and Trivedi2010). They can be interpreted as percentage changes. The coefficients of the explanatory dummy variable of interest, «migrant in Cuba», are negative and highly significant in all specifications (except the first, which does not include any controls). In order to interpret them correctly, one has to keep in mind that a multiple of five is not always a rounded age, because 20 per cent of all individuals were really 25, 30, 35…70 if we assume a uniform distribution of ages. Thus, migrants would be 11.25 per cent less numerate than non-migrants (according to Model 4)Footnote 27 . The negative skill selectivity of Canary Island male migrants by decade of birth is also projected in Appendix Figure A1.
4.3. Numeracy of Migrants Compared to Natives
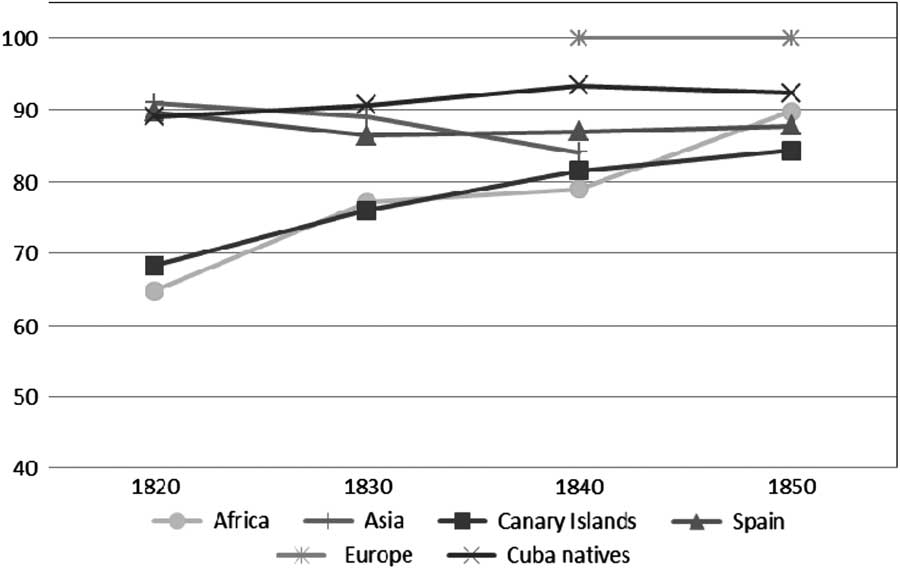
In order to assess whether Spanish and especially Canary Island migrants contributed to raising human capital levels in Cuba, their numeracy levels were compared with those of Cuban natives. Figure 3 displays ABCC levels of all migrant groups as well as non-migrants in Cuba per decade of birth (calculated from the ages reported in the census sample). It shows that Canary migrants perform worse in terms of numerical skills than Cuban non-migrants (by around ten ABCC points). They can be found on an ABCC level comparable to that of those born in Africa. The latter group is expected to be composed of former slavesFootnote 28 and thus hardly having received any education, except for the few who had managerial tasks in the plantations and needed at least basic numerical skills. The mainland Spanish immigrants could have been expected to be more numerate than Cubans, since at least some of them had occupied positions in the public colonial administration and in trade. However, their ABCC levels were no higher than natives’Footnote 29 . The European group comprises migrants from several western European countries that had already reached total numeracy (ABCC=100). However, this group only accounts for 2 per cent of European immigrants and around 1 per cent of the total foreign population. A logistic regression in the Appendix (Table A3) confirms these findings and shows that the results are highly significant.
ABCC INDEX BY BIRTH DECADES OF MIGRANTS IN CUBA AND CUBAN NATIVES
Sources: Cuban censuses of 1865-1887 (Twrdek Reference Twrdek2011).

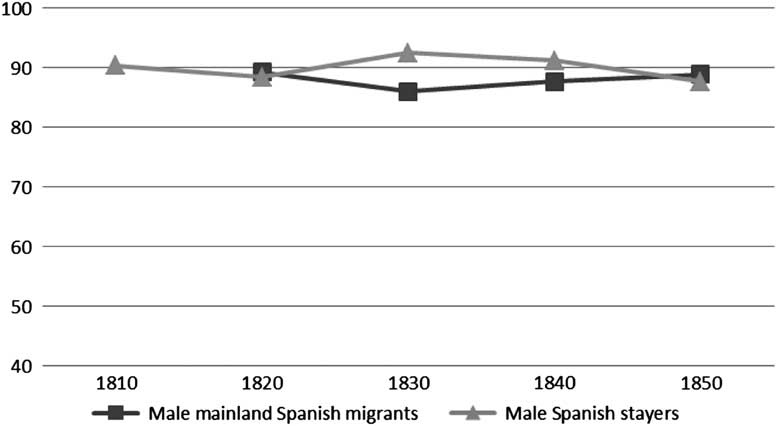
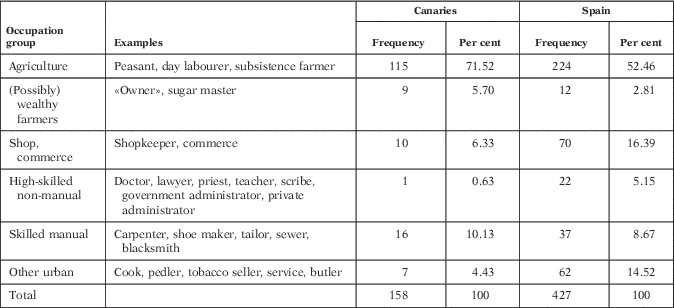
The numeracy advantage of peninsular Spanish relative to Canary Islanders in Cuba is, first of all, a consequence of the lower educational levels among the population of the Canary Islands compared with that of the mainland. In addition, however, unlike Canary Islanders, Spanish migrants in Cuba are not significantly negatively selected in terms of skills from the sending country population (see Table 3 and Appendix Figure A2). The result is consistent with the literature pointing out that the Spanish population in Cuba was predominantly urban and included merchants or civil servants who had held important posts in the administration (Scott Reference Scott2000), whereas Canary Islanders were mostly a rural population. The Cuban census data also shed light on the occupations of some of the immigrants of Canary and Spanish origin (the occupation was only stated for 158 Canarians and 427 Spanish immigrants). Appendix Table A4 displays the occupation groups of both Canary Islanders and mainland Spanish, evidencing that while more than 70 per cent of the Islanders were engaged in an occupation related to farming, the corresponding figure for other Spanish was only 52 per cent. While a considerable share of the Spanish was categorised into «commercial activities» (16 per cent), only 6 per cent of Canarians were. Moreover, Canary Islanders are barely represented in the skilled non-manual occupations group.
Cuba seems to have failed to attract highly skilled European immigrants in high numbers like other colonies, including the United States, Argentina or Brazil, did in the age of mass migration. Instead, 70 per cent of migrants originate from Africa, Asia and the Canary Islands and are significantly less numerate than the Cuban native population. Mainland Spanish are less innumerate but probably still do not contribute to raising average ABCC levelsFootnote 30 . The other Europeans, who had reached complete numeracy in the 19th century, only account for 2 per cent of immigrants.
5. Explaining Mass Migration to Cuba
5.1. The Push Factors
Why did Canary Islanders leave? The push factors play a crucial role in explaining this mass emigration across the Atlantic and in determining the selection of the migrantsFootnote 31 . The dry climate and frequent droughts made the Archipelago particularly vulnerable to agricultural crises. Most of those who left fled the islands due to unemployment during the frequent crises that hit the agricultural export sector in the 19th century. An important precondition was probably a rapid natural population growth resulting from the low mortality and a delayed decline in fertility, generating high «surpluses» of young adults who found no placement in the rural economy and could not be absorbed by an industrial sector (Hernández García Reference Hernández García1977; Hatton and Williamson Reference Hatton and Williamson2008). Wages were relatively low in the Archipelago — possibly due to the low human capital and the high supply of labour — and imported goods were pricy, making emigration the more attractive. Other causes include the long migratory tradition and pull-side factors such as the propaganda of recruiters from America as well as the myth of the indiano who makes a fortune in the AntillesFootnote 32 .
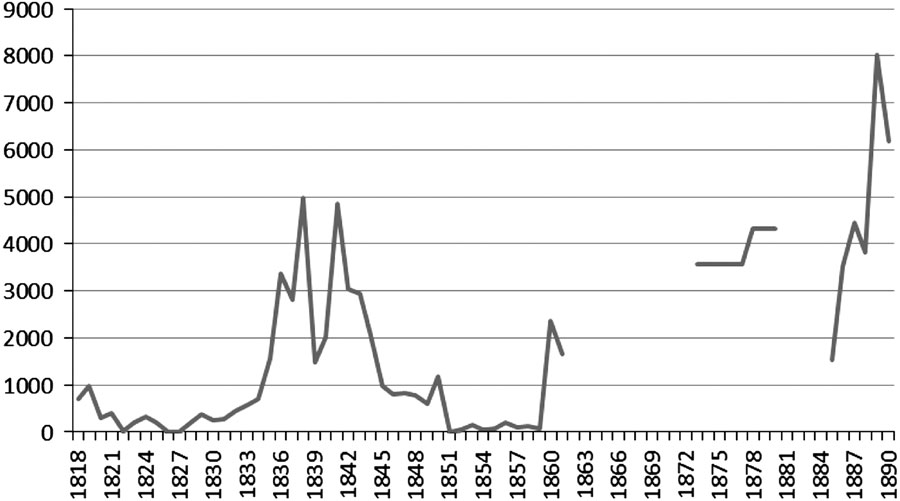
That emigration from the Canary Islands was driven by economic distress at home is evident since emigration numbers correlate with the occurrence of agricultural crises. The quantification of total emigration in the 19th century is not unproblematic, due to the lack or loss of official documents on emigration and the difficulty to capture illegal emigration. Not being accounted for in the statistics, illegal emigration, which especially concerned young men fleeing military service, made up around 20 per cent of 19th century Spanish emigration (Sánchez Alonso Reference Sánchez Alonso2000). Moreover, the national official statistics on emigration, which exist from 1882 onFootnote 33 , have the disadvantage that they recorded all passenger movements to America, including militaries, civil servants, etc. However, estimations by historians such as Macías Hernández (Reference Macías Hernández1992), Hernández García (Reference Hernández García1977) and Yáñez Gallardo (Reference Yáñez Gallardo1994) yield approximate numbers for different periods, which are assembled in Figure 4.
TOTAL EMIGRATION FROM THE CANARY ISLANDS TO AMERICA (ABSOLUTE NUMBERS)
Sources: Yáñez Gallardo (Reference Yáñez Gallardo1994, pp. 17-18, 242-243); for 1850-1859, Hernández García (Reference Hernández García1977, p. 159).

In the first two decades of the 19th century the Archipelago experienced a period of «bonanza» resulting mainly from the exportation of wine. The relatively good economic situation as well as the independence crises in the Spanish colonies in America (except Cuba and Puerto Rico), which lasted in some regions until 1830, restrained emigration. Moreover, in the 1820s, piracy around the coasts of the Canary Islands seriously hampered ship trafficFootnote 34 . However, from 1830 on, nothing stopped Canary Islanders from leaving to the New World. The export sector, traditionally based on trade with non-Castilian regions, especially England, Holland and Latin America, had been seriously damaged. England abolished the ban on trade with France after the Napoleonic wars and replaced wine imports from the Canaries with French products. Moreover, the independence wars in America had ended Spain’s trade relations with the New World, except with Cuba and Puerto Rico. When the crisis in viticulture coincided with the relatively calm situation in Latin America after the wars of independence, emigration boomed. Between 1835 and 1850, up to 50,000 people of a total population of 235,000Footnote 35 left the Canary Islands legally for Cuba, Uruguay and Venezuela; a mean of 13 per thousand residents per year. From the 1850s to 1887 there was a short recovery of the economy thanks to the liberalisation of international trade for the Canary Islands introduced in 1852, which also made a boom of cochinealFootnote 36 exports possible. Despite a descent in emigration relative to the resident population, the national emigration statistics for 1860 and 1861 elaborated by Yáñez Gallardo (Reference Yáñez Gallardo1994), show that the Canary Islands had by far the highest emigration rates of Spain, with figures of 10 and 7 per thousand residents in each year, followed only by Madrid with 5.3 and 8.1 emigrants per thousand residents, respectively. The first Cuban independence war, which lasted 10 years (1868-1878), could have restrained Canarian outmigration, but it coincided with the gradual abolishment of slavery in Cuba, and the resulting increased demand for cheap free labour was satisfied by the Canary Islands. Emigration reached its peak levels in the 1880s — a mean of 18 per thousand residents per year — coinciding with a price crash of cochineal when natural ink was substituted by artificial ink produced elsewhere (Macías Hernández Reference Macías Hernández1992, p. 134). Also in that decade, the Canary Islands was the Spanish province with highest emigration rates. The last of the independence wars in Cuba (1895-1898) put an end to the vast emigration flows of Canary Islanders until the oil boom in Venezuela induced another wave of mass departures in the mid-20th century.
5.2. The Strong Ties to Cuba
More than 80 per cent of emigrants from the Canary Islands throughout the 19th century went to Cuba. Free transatlantic migration has mostly been explained by real wage advantages in the New World (Hatton and Williamson Reference Hatton and Williamson2002, Reference Hatton and Williamson2008), but the wage advantage alone — which was more pronounced in the United States and Argentina — fails to explain the choice of destination of most Canary Islanders. The reason is that a number of factors considerably reduced the monetary and non-monetary costs of migrating to Cuba making it possible to circumvent the poverty (and literacy) constraints on the move. Linguistic, colonialFootnote 37 and cultural ties facilitated access to information on foreign labour markets and reduced the costs of adapting in Cuba. Geographical proximity to the Caribbean also substantially cheapened the passage fare relative to other New World economies. More importantly, migration chains were very strong and had a long tradition. Migrant networks facilitated the move by providing knowledge on the employment opportunities, even making it possible to sidestep the need to be literate. Relatives and friends, having emigrated earlier, also sent remittances and sometimes even paid directly for the passage costs for family reunifications. However, the key «pull»-side factor of attraction was the increased demand for free labour in the Caribbean sugar plantation economy due to the gradual abolition of slavery. To attract Canary Islanders, a system of indentured servitude was set in place, within which the employer paid for the passage costs. This system allowed the migrant to move without the need to have any initial wealth to pay the costs of transportFootnote 38 .
Before the 1830s, Canary Island migrants mainly settled as «colonists» in the Caribbean as well as in other Spanish colonies such as Uruguay, Louisiana or Florida, to protect frontier regions from foreign occupation. This sort of migration was incentivised by the Crown. In Cuba, Canary Island families arriving in the 18th century founded a number of settlements, including Matanzas, Santiago de las Vegas and Guantanamo. Even at this early stage, Canarian families mainly populated the rural regions. A considerable share of the rural community in Cuba, the so-called guajiros, was of Canarian origin. They were usually subsistence farmers, cattle holders or dedicated to the cultivation of tobacco on their own farmsFootnote 39 . The tobacco growers made a significant economic contribution when tobacco was still one of the most important export crops, before the specialisation on sugar, which was grown in large plantations and relied on slave labour.
With the boom of the sugar industry in the 19th century and coinciding with the gradual substitution of African slaves by white labour, Canarian immigration accelerated, but at the same time descended the social ladder. After the slave uprising that led to the independence of Haiti (1791-1804), Cuba’s first competitor in the sugar market had disappeared while international demand for sugar increased. Cuba competed with Jamaica, the Dominican Republic and Puerto Rico, but soon became the leading exporter on the world market. To boost production, plantation owners intensified the importation of African slaves, increasing the black slave population from 64,590 in 1792 to 436,495 at its peak in 1841 (Report on the Census of Cuba Reference Beine, Docquier and Rapoport1899). At the same time, however, Britain was putting pressure on Spain to end the slave trade. Spain was pushed to sign a treaty abolishing the slave trade to its colonies Cuba, Santo Domingo and Puerto Rico in 1817. Interestingly, Great Britain was asked in the project of the treaty to compensate Spain with 1.5 million pounds sterling of which one million was entitled to the transfer of free farmers from the Canary Islands to Cuba. The treaty documents that the only alternative to slavery was Canarian agricultural labour (Paz and Hernández Reference Paz and Hernández1992, p. 27). However, Cuban plantation owners managed to lobby in Spain for a relaxation of the ban on the slave trade and for the protection of the institution of slavery for a few more decadesFootnote 40 .
Nevertheless, the costs of slavery started to increase notably and plantation owners began to consider the employment of wage labour. Prices for slaves on the illegal market were rising and slaves increasingly disregarded their work or destroyed tools and machinery as a form of rebellion. Moreover, the fear of another slave revolt like Haiti’s had spread the will to «whiten» the populationFootnote 41 . Finally, the Spanish government imposed harsh punishments for those involved in the illegal trade of slaves from 1845 on. The termination of the official protection of slave traders and the increasing rejection of slavery on the part of the Cuban population lead to a relatively fast decrease in the slave population after the 1840s. Relative to the total population, the share of African slaves descended from 43.5 per cent in 1841 to 26.5 per cent in 1861 (Cuban Census Report 1899).The rising demand for free labour, especially after the 10 Years War, culminated in the definitive abolition of slavery in 1886.
In order to substitute slaves by free wage labour, sugar plantation owners in Cuba were interested in large influxes of white immigration directed to the rural sector to combat labour scarcity and reduce wagesFootnote 42 . However, they faced some hurdles on the part of the motherland, because Spanish emigration policy was «halfhearted at best» (Sánchez Alonso Reference Sánchez Alonso2000, p. 732). Spanish intellectuals and politicians of the time deeply regretted their country’s loss of population, the «most important wealth of a nation», particularly in the case of those emigrating to evade military service (Sánchez Alonso Reference Sánchez Alonso2000, p. 732). Moreover, the Spanish Crown possibly feared that a larger white population in Cuba could encourage the struggle for independence in one of its last remaining colonies (Paz and Hernández Reference Paz and Hernández1992). Therefore, although Cuban plantation owners and some Canarian politicians insisted on the advantages of Canarian migration to Cuba, the Spanish government was reluctant to promote emigration and did not subsidise ship passages until the end of the 19th century and did so only for a short time.
And thus, agricultural labourers from the Archipelago were mostly recruited through the system of indentured servitude (contratas). Within this system, passage costs were paid to recruiters on arrival by the Cuban employers and, in compensation, immigrants were bound to work for a determined number of years (usually 4-6) for their employer. The cost of the passage, as well as that of the expedition of passports, was deducted on a monthly basis from the workers’ salary. In this way 125,000 Asians, the so-called «coolies», also arrived in Cuba to work on sugar estates between 1847 and 1874 (Scott Reference Scott2000, p. 29). Within Europe, the Spanish province of the Canary Islands, with a large poor and illiterate population, was almost the only provider of cheap white labour for the plantations. Attempts to place indentured servitude contracts in other Spanish provinces largely failed.
In sum, the average Canary Island migrant in Cuba was a rural wage labourer. Crises in the agricultural export sector of the Canary Islands had probably pushed the most vulnerable section of the population to seek employment outside the Archipelago. They satisfied the growing demand for white unskilled labour on the sugar estates in Cuba. The system of indenture and long-existent migration chains reduced the costs associated with long-distance migration and allowed the poorer section of the population of the Canary Islands to afford the move.
5.3. Social and Economic Characteristics of Canarian Migrants
As mentioned earlier, Canary Islanders largely arrived with indentured servitude contracts to work as farmhands in the plantationsFootnote 43 . The conditions for indentured servants, starting with the voyage from the Canary Islands to America, were quite poor and relatively slave-like. Canary Islanders and slaves (as well as free black people) worked side by side in the fields, especially on sugar estates. However, social strata at the time were strictly defined — persons of Asian or African origin were still below the isleño Footnote 44 — and depending on their origin, labourers were eventually assigned slightly different tasks. The typical conception of the Canary Islander is illustrated by the statement of Mr. Beal, the manager of a sugar planting farmFootnote 45 : «For stowing cane on the cars, ploughing, ditching, road repairing and railroad work, Canary Islanders and Spaniards are preferable. They are more used to this work, are more constant and have less vices. For cane cutting, carting, planting and cultivating, native labour — especially negro labour — is preferable, because, being experts, the work progresses more rapidly…» and «I employ a considerable number of Asians [during crops], but many of these are opium smokers and much debilitated and we calculate on 60 per cent only being at work, while 40 per cent are resting in their barracon» (see Appendix of the Report on the Census of Cuba Reference Beine, Docquier and Rapoport1899).
The Canarian historiographer Julio Hernández García holds that throughout the 19th century the misery and illiteracy of the Canary Islanders was exploited by Cubans. The working conditions of Canarian immigrants who replaced African slaves were not significantly different from those of slaves. Contract labourers had to agree on such conditions as «to content themselves with the stipulated salary, even if they knew it was lower than that earned by native free and slave day labourers (since the difference is covered by other advantages stipulated in this contract)», they were not allowed to marry without the consent of their employer for the duration of the contract and the labourers’ children up to the age of 18 were bound to work in the plantations during the period of the contract. Canarian entrepreneurs made profits with the transportation of wage labour to the Antilles, probably compensating for the losses in the agricultural export sector, and seem to have promoted emigration to Cuba by all means. Not only the «Canarian Association of Benevolence and Agricultural Protection»Footnote 46 , which was created in 1872 to protect Canary Islanders from abusive contracts, but also the authorities in the Antilles, denounced the abuses committed in the «importation» of Canary Islanders. Agents were accused of abusing the credibility of simple farmers or braceros in the Canary Islands by convincing them to sell all their property to finance a passage to America or proposing contracts «that reduced them to the condition of slaves upon arrival in the Antilles» (Paz and Hernández Reference Paz and Hernández1992, p. 100). Other than in the case of Irish migrants to the United States during the Great Famine (O’Gráda and O’Rourke Reference O’gráda and O’rourke1997), it is possible that Cuba did also «receive the paupers» from the Canary Islands. In fact, contemporary witnesses in the mid 19th century complained that many immigrants from the Archipelago became mendicants, because even those who were poor and not suited to work in the plantations made their way across the Atlantic (Paz and Hernández Reference Paz and Hernández1992, pp. 66-67). There is of course also evidence of Canary Islanders who, particularly from the end of the 19th century and until the early 20th century, became landowners and even part of the commercial bourgeoisie (Bosa et al. Reference Bosa, Sánchez, Déniz and Prats2006). They were however a small minority.
There is little doubt that Canary Islanders and Spaniards in Cuba belonged to different social classesFootnote 47 . The literature and census evidence points out that Spanish mainland settlers in Cuba were usually «merchants, shopkeepers or government employees»Footnote 48 (Scott Reference Scott2000, p. 7), whereas Canary Islanders were mostly engaged in agriculture. This difference is not only a natural result of the Canary Islands being one of the poorest and most rural provinces of Spain, but it is intensified by the fact that those who left the Canary Island were negatively self-selected from the population of origin, whereas the mainland Spanish were not. The historians Manuel de Paz and Manuel Hernández (Reference Paz and Hernández1992) claimed that the Canarian was marginalised by the mainland Spanish living in Cuba due to his rural condition. «Isleño was equivalent to ignorant, uncivilized, ogre…». By Cubans, on the other hand, they were even sometimes considered as criollos, although not born in Cuba, but however coming from another Spanish «territory», which was overly neglected by Spain (Paz and Hernández Reference Paz and Hernández1992, p. 23). One could even go as far as to hypothesise that this enmity led Canary Islanders to fight on the side of the Cubans against the Spanish metropolis during the wars of independence. Historical documentation shows that Canary Islanders fought both on the side of Spain as well as on the Cuban sideFootnote 49 . Although the Canarian press in Cuba propagated the idea that the Canary Islanders were faithful to the Spanish motherland and fought on its side, the Canarian newspapers edited in Venezuela, most prominently El Guanche, encouraged Canary Islanders to fight for the independence of Cuba and at the same time strived for the separation of the Canary Islands from Spain. Notwithstanding the scarce hard-fact evidence, the importance of Canary Islanders for the independence of Cuba is portrayed in an article that José Martí, Cuban intellectual and the most famous libertador, dedicated to the Canary Islanders who fought side by side with the CubansFootnote 50 .
6. Conclusions
This paper has shown empirically that the Canary Islands was the region of Spain that supplied most 19th century migrants to Cuba, that these migrants were negatively selected and that they were, on average, less numerate than Cuban natives. The crises that hit the agricultural export sector in the Archipelago, as well as the increased demand for low-skilled labour in the booming plantation economy of Cuba, reinforced already existing migration ties. The system of indentured servitude contracts facilitated the move of the poorest section of the Canarian population, thereby fostering the negative selection of migrants.
Cuba, thus, did not share the experience of other New World destination countries that benefitted from the human capital brought by European immigrants in the age of mass migration (Sánchez Alonso Reference Sánchez Alonso2007; Stolz, Baten and Botelho Reference Stolz, Baten and Botelho2013). Argentina, for example, had introduced the policy of promoting well educated immigrants as a measure of development and overtook the Caribbean island in terms of educational levels in the early 20th century (Manzel et al. Reference Manzel, Baten and Stolz2012). In the vein of Glaeser et al. (Reference Glaeser, Porta, Lopez-De-Silanes and Shleifer2004), the fact that Cuba attracted lower skilled immigrants with respect to other New World nations could contribute to explain its relatively poor growth trajectory.
Moreover, the system of indenture can be viewed as an inequality promoting institutions with negative consequences for long-term development. The literature has pointed out that in highly unequal plantation economies that relied heavily on coerced labour until the late 19th century, the landowning elite hampered the implementation of growth-promoting institutions. For instance, landowners who had the financial and social backing to influence public spending policies opposed a system of mass education which would require redistributive taxes in favour of the poor. The children of the rich could afford private education and rural elites and sought to keep the prevailing pool of cheap low-skilled labour for their estates (Engerman and Sokoloff Reference Engerman and Sokoloff1997, Reference Engerman and Sokoloff2002; Frankema Reference Frankema2009; Wegenast Reference Wegenast2009, Reference Wegenast2010). The system of indentured servitude was an institution promoted by landowners in Cuba that probably hampered the human capital formation and industrialisation process. It made it possible to keep wages low and labour conditions poor in a continuation of slavery; thereby avoiding, for instance, the necessity to enter a high mechanisation process in agriculture and become, eventually, a knowledge-based economy. At the least, the system of imported bound labour contributed to the perpetuation of economic and social inequality in the Caribbean.
Appendix
ABCC INDEX OF CANARIAN MALE MIGRANTS IN CUBA AND CANARY ISLAND MALE STAYERS
Sources: Cuban censuses 1865-1887 (Twrdek Reference Twrdek2011) and Spanish Census of 1877 (www.ine.es/inebaseweb).

ABCC INDEX OF MAINLAND SPANISH MALE MIGRANTS IN CUBA AND SPANISH MALE STAYERS
Sources: Estadísticas Históricas de España Siglo XIX-XX (Carreras and Tafunell Reference Carreras and Tafunell2005) for literacy and census of 1877 (www.ine.es/inebaseweb) for numeracy.

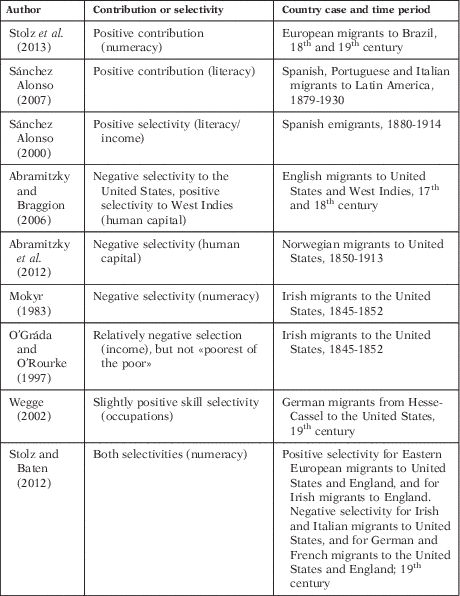
LITERATURE OVERVIEW ON HISTORICAL MIGRANT SELECTIVITY FROM SENDING COUNTRY POPULATION AND HUMAN CAPITAL CONTRIBUTION TO RECEIVING COUNTRIES (EMPIRICAL STUDIES)

LITERACY AND NUMERACY RATES IN SPANISH AUTONOMOUS COMMUNITIES (1877)

NUMERACY OF CANARY ISLANDERS AND OTHER MIGRANT GROUPS RELATIVE TO THE NATIVE POPULATION IN CUBA

OCCUPATIONS OF CANARY ISLAND AND SPANISH MIGRANT MALES IN CUBA

DISTRIBUTION OF SPANISH MIGRANTS IN CUBA BY AUTONOMOUS COMMUNITY OF BIRTH