Introduction
Research on metasurfaces as a means of controlling electromagnetic waves has been extensively conducted, particularly for applications in antennas [Reference Arnmanee1] and electromagnetic absorbers [Reference Mishra, Nazeer, Baghel, Joy and Singh2]. These structures have evolved as a technology for thinning and miniaturizing wavelength-dependent electromagnetic control materials, which is essential for electromagnetic interference suppression and antenna performance enhancement. Furthermore, metasurfaces offer effective approaches for realizing electrically compact antennas and achieving high gain. In recent years, methods for actively controlling electromagnetic waves by combining metasurfaces with active circuit elements – referred to as reconfigurable intelligent surfaces (RIS) – have attracted significant attention [Reference Sibille3, Reference Kumar, Mishra and Harish4]. RIS technology provides a cost-effective and lightweight alternative for electronic beam steering of antennas and is regarded as a promising direction in electromagnetic wave manipulation. Fundamentally, RIS is composed of a periodic arrangement of metallic patches (metasurfaces) integrated with electronically controllable active components, allowing control of reflection and transmission phase at the unit-cell level. As a result, there is a growing demand for metasurfaces that enable dynamic control of electromagnetic behavior via electrical signals. The fundamental mechanisms for wave manipulation include reflection, transmission, and absorption. In general, these mechanisms are reciprocal, meaning that electromagnetic characteristics remain unchanged with respect to the direction of propagation across the same planar structure [Reference Omar, Shen and Huang5]. However, there is a growing demand for nonreciprocal behavior, in which different responses are exhibited depending on the direction of incidence at the same frequency. Such functionality is highly desirable for interference mitigation and spatial filtering. Recent studies have proposed nonreciprocal surfaces using amplifier–antenna combinations [Reference Taravati, Khan, Gupta, Achouri and Caloz6] or through the use of magnetically biased materials [Reference Yang, Qin, Long, Yan, Yang, Li, Li, Hu, Deng, Du and Bi7], indicating a promising research direction. Our group has been investigating a simple structure that achieves nonreciprocity by combining ferrite materials with metallic patches [Reference Takahagi and Tennant8], and we have demonstrated a structure that exhibits high transmission with substantial isolation. However, characteristics such as frequency response and isolation level are inherently fixed by the physical properties of the ferrite and the electromagnetic characteristics of the metallic patch, thus limiting external control capabilities. While electromagnetic coils can be used to modulate the magnetic bias field applied to ferrites [Reference Takahagi and Tennant9], practical implementation is hindered by power consumption and thermal management issues. To address this, we propose an electrically controllable method for nonreciprocal behavior by loading PIN diodes onto the metallic patch array. This paper introduces a dual control approach for activating nonreciprocity using PIN diodes – one method for phase control and another for direct modulation of nonreciprocity. We present the design methodology and experimental validation of these approaches based on fundamental operating principles. The proposed nonreciprocal metasurface retains a static magnetic bias for ferrite activation, while adding electrical tunability through PIN-diode control, enabling compatibility with microwave wireless systems such as adaptive isolation surfaces, reconfigurable interference-suppression layers, and tunable electromagnetic shielding. These application scenarios motivate the development of the controllable nonreciprocal mechanisms presented in this work. A preliminary version of this work was presented at EuCAP 2025, focusing on active phase control through simulation and experiment [Reference Takahagi and Tennant10]. In this extended version, we add transmission-line analysis to clarify the operating principle and enhance the design. Moreover, we introduce a new ON–OFF control scheme, further advancing the versatility of nonreciprocal metasurface design.
Principle of nonreciprocal metasurfaces
Electromagnetic characteristics of ferrite
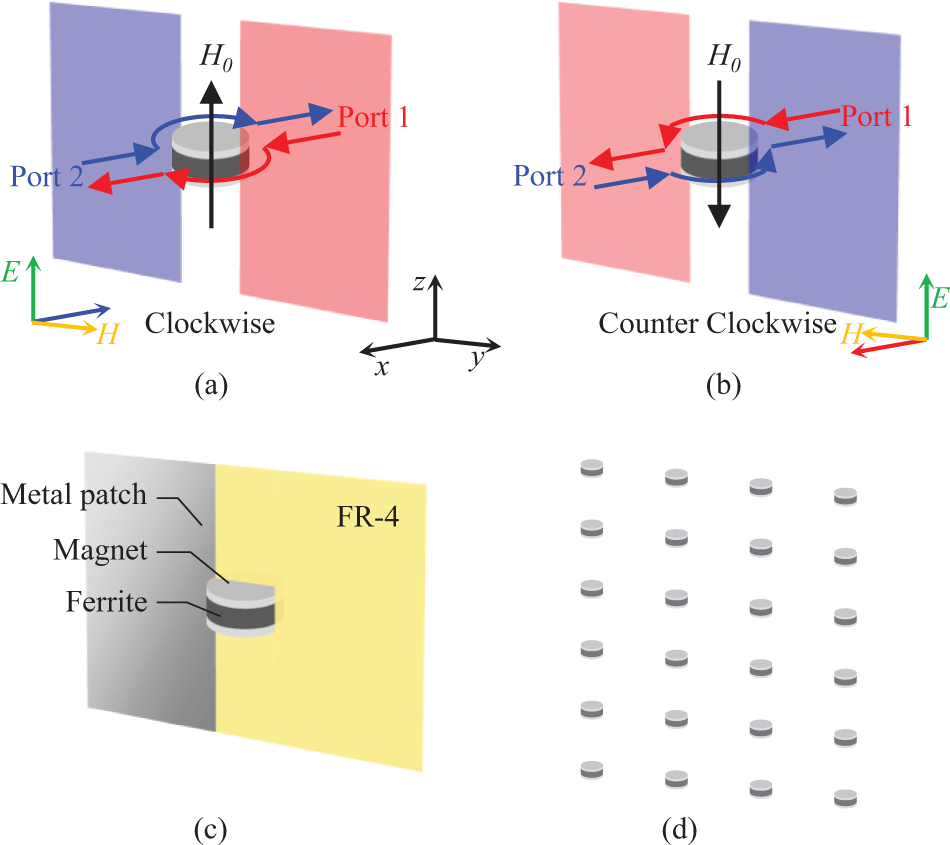
The key element of the proposed nonreciprocal metasurface is a thin cylindrical ferrite material, referred to here as a ferrite disk. Ferrite disks are commonly used in waveguide-type circulators and isolators and are known to exhibit rotational propagation characteristics when a static magnetic field is applied. As illustrated in Fig. 1(a) and (b), when a magnetic bias is applied parallel to the height (z-axis) of a ferrite cylinder, the material exhibits clockwise or counterclockwise rotational propagation behavior depending on the magnetic field direction, for incoming electromagnetic waves polarized in the same direction (in this case, vertically polarized waves). Typically, the magnetic field is provided by permanent magnets placed above and below the ferrite disk, allowing the direction of the bias field to be controlled by flipping the magnets. When the magnetic field is fixed to produce clockwise propagation within the center of the metasurface unit cell, an incident wave arriving from the direction of the blue arrow in Fig. 1(a) propagates through the blue-shaded region on the left. Conversely, a wave incident from the direction of the red arrow propagates through the red-shaded region on the right. Reversing the magnetic field results in the mirrored configuration shown in Fig. 1(b). A simplified model of a passive nonreciprocal unit cell is shown in Fig. 1(c). It consists of metallic lines or patches on a dielectric substrate. In this configuration, the blue region in Fig. 1(a) corresponds to the metal line, while the red region represents a void or gap within the substrate. The ferrite’s rotational propagation occurs only within a frequency band determined by its material parameters and diameter; outside this range, wave behavior is dominated by the patterned metal and gaps. Therefore, for practical metasurface design using patterned metal, it is desirable to implement only one of the two structures per unit cell. When a cylindrical ferrite is employed in circulators or isolators, nonreciprocity is typically achieved by utilizing anisotropic permeability to equalize the phase velocities of right-handed and left-handed circularly polarized waves. This makes it possible to select the desired output port based on the rotation angle of the wave [Reference Pozar11]. The optimum ferrite radius R for rotational propagation at a given frequency is given by equation (1) [Reference Linkhart12]:
 \begin{equation}R = \frac{{1.84\lambda }}{{2\pi \sqrt {\mu \varepsilon } }},\end{equation}
Unit cell structure of the proposed nonreciprocal metasurface and operation principle of the ferrite disk.

Figure 1 Long description
A ferrite disk with a magnetic field labeled H subscript 0, oriented vertically, causing clockwise propagation. Port 1 is on the right and Port 2 is on the left, with arrows indicating the direction of wave propagation. The blue region represents Port 2 and the red region represents Port 1. The image B depicts a similar setup with counterclockwise propagation, where Port 1 is on the left and Port 2 is on the right. The magnetic field H subscript 0 is again oriented vertically. The image C illustrates a simplified model of a passive nonreciprocal unit cell, showing a metal patch, magnet and ferrite on a substrate labeled FR-4. The image D displays an array of ferrite disks arranged in a grid pattern. The diagrams include axes labeled x, y and z and vectors labeled E and H, indicating electric and magnetic fields respectively.
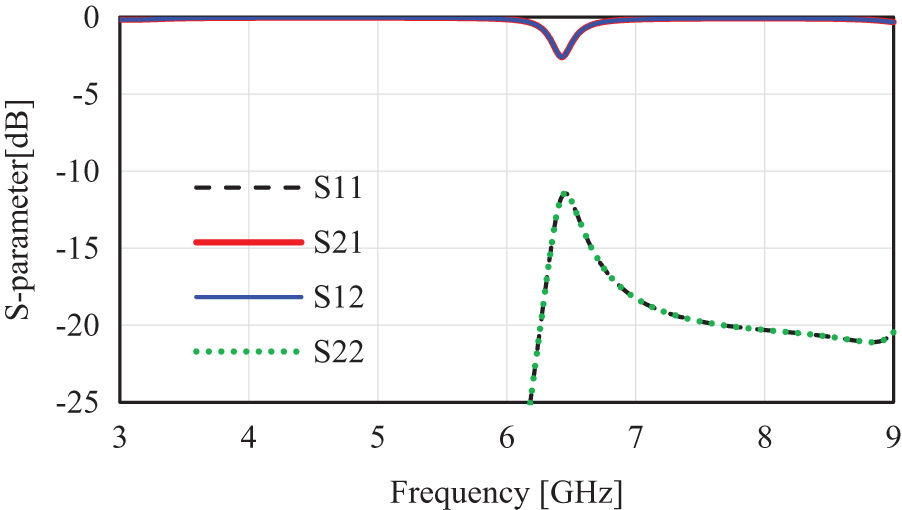
where µ is the effective permeability, Ꜫ is the permittivity, and λ is a wavelength of operating frequency band. To realize rotational propagation for plane waves, the array response must be optimized through full-wave electromagnetic simulation based on this ferrite radius. In this study, CST Studio Suite (F-solver) is used for the electromagnetic simulation. The structure analyzed consists of an infinite array of ferrite disks placed on a plane, as shown in Fig. 1(d). At frequencies supporting rotational propagation, the incident wave penetrates the ferrite and experiences slight absorption, whereas outside this band the ferrite disks have little effect, particularly for sparse arrays. Therefore, simulations neglecting inter-element spacing yield qualitatively similar results. In this study, we focus on the 6 GHz band as the operating frequency, and we adopt ferrite materials with the following specifications based on prior experimental validation [Reference Takahagi and Tennant8]: diameter 7.5 mm, relative permittivity of 15, relative permeability of 1.1, saturation magnetization of 1600 Gauss, and an applied bias field of 650 Gauss. The simulation result in Fig. 2 confirms slight absorption around 6.5 GHz, near the center of the targeted band. Because this ferrite-only array does not include patterned metal, it exhibits rotational propagation but remains reciprocal. Henceforth, we assume the bias magnetic field is oriented upward, resulting in clockwise propagation for all models discussed.
Simulated S-parameters of a ferrite disk array using full-wave analysis.

Design of active control
For the activation of nonreciprocal metasurfaces, two approaches are considered: (a) controlling the phase response of nonreciprocal transmission, and (b) switching the presence or absence of nonreciprocal behavior using an ON–OFF control scheme. The first approach, phase control, aims to realize a nonreciprocal transmission similar to the passive case, where one direction is always blocked and the other always transmits, as shown in Fig. 3(a). In this configuration, the blocked direction (Port 1) corresponds to propagation through the gap side, which is opposite to the metallic patch. This ensures that the signal is suppressed regardless of the ON or OFF state of the PIN diode. On the other hand, for the transmitting direction (Port 2), the wave propagates through the metallic patch side. In this case, a PIN diode is embedded on the patch, and the goal is to achieve phase variation depending on the diode’s switching state. This enables dynamic phase control while maintaining the inherent nonreciprocity. The second approach directly switches the nonreciprocity itself. As illustrated in Fig. 3(b), Port 1 remains suppressed as in the first method, whereas Port 2 is designed to transmit when the diode is OFF and to form a stopband when the diode is ON, allowing the overall behavior to toggle between nonreciprocal and reciprocal states.
Types of active nonreciprocity control: (a) phase control method, (b) ON–OFF switching of nonreciprocal behavior.

Figure 3 Long description
Two configurations for phase control method. On the left, the ON-state configuration has Port 2 with a PIN diode allowing transmission, while Port 1 is blocked. The arrow labeled phi subscript 1 indicates the direction of transmission through Port 2. On the right, the OFF-state configuration shows Port 2 still allowing transmission, but with a different phase indicated by phi subscript 2, while Port 1 remains blocked. The image B illustrates the ON-OFF switching method. On the left, the ON-state configuration allows transmission through Port 2, with Port 1 blocked. On the right, the OFF-state configuration shows Port 2 blocked, forming a stopband, while Port 1 remains blocked. Both images depict the use of a PIN diode embedded on the patch to control the transmission states.
In this paper, we verify the feasibility of both control strategies through electromagnetic simulations using CST Studio Suite and analytical design based on transmission-line theory. Experimental validation using minimum-sized metasurface arrays is also conducted, and the results are discussed in the following sections.
Phase control of nonreciprocity
Unit cell structure
As the first control approach, we investigate a method for modulating the transmission phase of an already established nonreciprocal response. The proposed active unit cell structure for phase control is illustrated in Fig. 4(a). The unit cell has a width w = 26 mm, a patch width of 12.9 mm, and a height p = 16.25 mm, which includes the rhombic patch height of 15.25 mm and a gap of 1 mm. The metallic patch is configured in a rhombus shape, with a PIN diode connected at the vertex. This geometry is selected for ease of impedance matching. The PIN diode used in this study is the BAP50-03, for which several literature reports [Reference Cerveny, Ford and Tennant13, Reference Leingthone and Hakem14] model its ON and OFF states as follows:
• ON state: A series R–L circuit with resistance R = 2.1 Ω and inductance L = 0.6 nH.
• OFF state: A series L–C circuit with the same L = 0.6 nH and capacitance C = 0.17 pF.
Phase control of nonreciprocal metasurface: (a) unit cell structure, (b) overall array layout, (c) assumed propagation structure for Port 2, (d) assumed propagation structure for Port 1.

Figure 4 Long description
The unit cell structure for phase control of a nonreciprocal metasurface is shown in image A. It includes a metal patch, PIN diode, magnet and ferrite, all mounted on an FR-4 substrate. The dimensions are labeled as width w, patch width w subscript p and height p. The overall array layout is shown in image B, consisting of multiple unit cells arranged in a grid pattern. Each unit cell features a rhombic metallic patch with a PIN diode at the vertex. The assumed propagation structure for Port 2 is shown in image C, with an arrow labeled Port 2 pointing to the left, indicating the direction of signal flow through the array of rhombic patches. The assumed propagation structure for Port 1 is shown in image D, with an arrow labeled Port 1 pointing to the right, indicating the direction of signal flow through vertical strips. The arrangement and labeling highlight the nonreciprocal nature of the metasurface, with distinct propagation paths for each port.
The ferrite element is placed at the center of each unit cell, and the overall metasurface array is shown in Fig. 4(b). For input from Port 2 (metallic-patch side), the wave propagates through the rhombic patch array and interacts with both the patch and PIN diode, making their electromagnetic properties dominant, as depicted in Fig. 4(c). In contrast, input from Port 1 primarily travels through the air-gap side, which effectively behaves as a continuous metallic strip surrounding the gap, as shown in Fig. 4(d). Consequently, the wave propagation in this direction can be interpreted as occurring along a simplified transmission line formed by the void region.
Transmission-line theory analysis
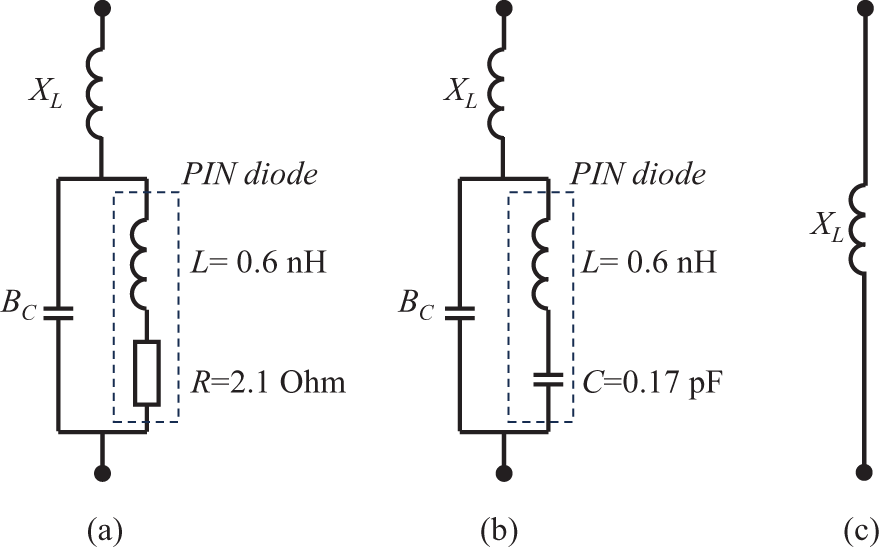
The equivalent circuits corresponding to each propagation configuration are shown in Fig. 5. Figure 5(a) and (b) represent the equivalent circuits when the PIN diode is in the OFF and ON states, respectively. The regions enclosed by dashed lines represent the equivalent models of the diode. In these circuits, the reactance XL represents the inductive component of propagation through the patch, while the susceptance BC corresponds to the capacitive coupling between adjacent patches. For a rhombic patch array, these parameters are derived by considering a 45-degree rotated square patch array, resulting in values approximately scaled by 1/ $\sqrt 2 $. The inductive and capacitive components of the square patch array can be calculated using equations (2) and (3) [Reference Marcuvitz15, Reference SureshKumar, Venkatesh, Salil and Subbarao16]:
 \begin{equation}\frac{{{X_L}}}{{{Z_0}}} = F\left( {{\text{w}},{w_p},\lambda ,\theta } \right) = \frac{{{\text{w }}cos\theta }}{\lambda }\left\{ {1n{ }\, csc\frac{{\pi {w_p}}}{{2w}} + G\left( {w{\text{,}}{w_p}{\text{,}}\lambda {\text{,}}\theta } \right)} \right\}\end{equation}
 \begin{align}& \frac{{{B_C}}}{{{Z_0}}} = 4F\left( {{\text{p}} - {\text{g}},{\text{p}},\lambda ,\theta } \right) = \frac{{\left( {{\text{p}} - {\text{g}}} \right){ }cos\theta }}{\lambda }\nonumber \\ & \qquad\qquad\qquad\qquad\qquad\left\{ {1n{ }\, csc\frac{{\pi p}}{{2\left( {p - g} \right)}} + G\left( {p - g{\text{,}}p{\text{,}}\lambda {\text{,}}\theta } \right)} \right\}\end{align}
Equivalent circuit models: (a) Port 2 with diode ON, (b) Port 2 with diode OFF, (c) Port 1 equivalent circuit.

where, w is the unit cell width, wp is the patch width, p is the cell height, and g is the gap between patches. The parameter G(w, wp, λ, θ) used in equations (2) and (3) is computed from equations (4) through (6):
 \begin{align}& G\left( {w,{w_p},\lambda ,\theta } \right) \nonumber \\ &= \frac{1}{2}\frac{{{{\left( {1 - {\beta ^2}} \right)}^2}\left[ {\left( {1 - \frac{{{\beta ^2}}}{4}} \right)\left( {{A_ + } + {A_ - }} \right) + 4{\beta ^2}{A_ + }{A_ - }} \right]}}{{\left( {1 - \frac{{{\beta ^2}}}{4}} \right) + {\beta ^2}\left( {1 + \frac{{{\beta ^2}}}{2} - \frac{{{\beta ^4}}}{8}} \right)\left( {{A_ + } + {A_ - }} \right) + 2{\beta ^6}{A_ + }{A_ - }}},\end{align}
 \begin{equation}{A_ \pm } = \frac{1}{{\sqrt {1 \pm \frac{{2{\text{w }}sin\theta }}{\lambda } - {{\left( {\frac{{{\text{w }}cos\theta }}{\lambda }} \right)}^2}} }} - 1\end{equation}
 \begin{equation}\beta = {\textit{sin}}\frac{{\pi {w_p}}}{{2w}}.\end{equation}
Using the calculated reactance and susceptance, the impedance Z is determined by
 \begin{equation}Z = j{X_L} + \frac{1}{{j{B_C}}}.\end{equation}
Then, based on the admittance Y, the reflection coefficient S 11 and transmission coefficient S 21 are calculated using equations (8) through (11):
 \begin{equation}Y = {Z^{ - 1}},\end{equation}
 \begin{equation}{\left| T \right|^2} = \frac{4}{{4 + {{\left| Y \right|}^2}}},\end{equation}
 \begin{equation}{S_{11}} = 10{\textit{log}}\left( {1 - {{\left| T \right|}^2}} \right),\end{equation}
 \begin{equation}{S_{21}} = 10log\left( {{{\left| T \right|}^2}} \right).\end{equation}
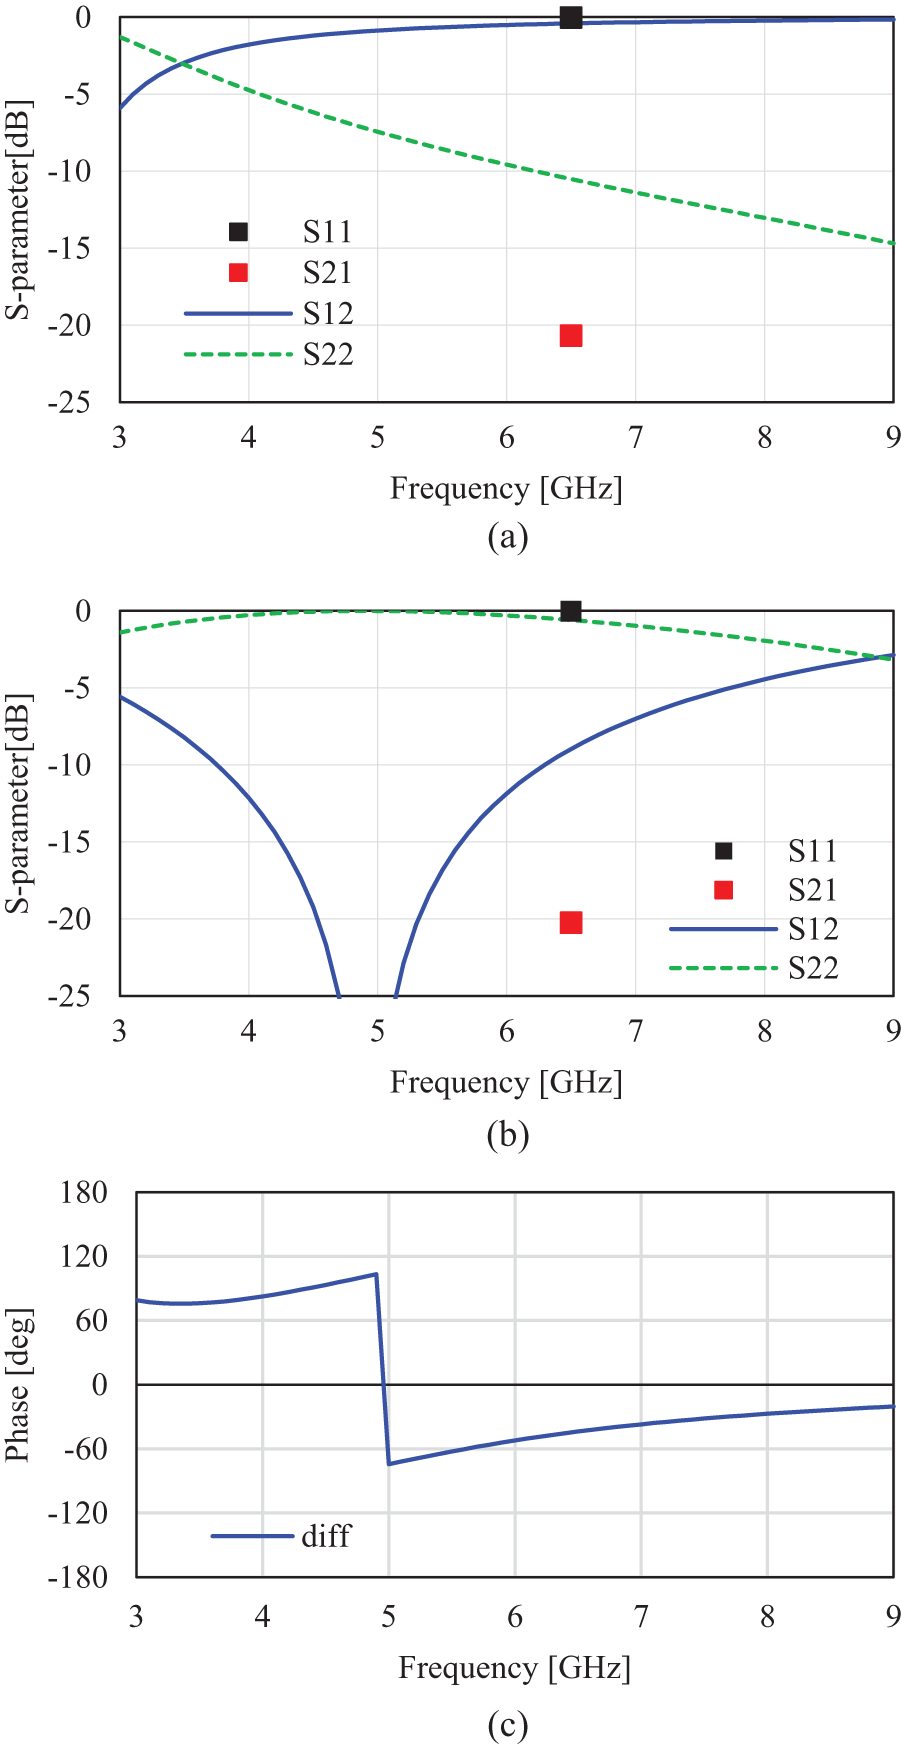
Note that transmission-line theory assumes reciprocity, and therefore the expressions for S 11 and S 21 are shown here for convenience. However, in the context of our design, the forward and reverse directions correspond to structurally distinct propagation paths as shown in Fig. 4(c) and (d). Thus, the values obtained are treated as S 12 and S 22, respectively, depending on the direction of analysis. For propagation from Port 1, the wave primarily passes through the air-gap side, which can be modeled as a purely reactive structure. Therefore, the corresponding equivalent circuit is shown in Fig. 5(c), and the impedance can be approximated using equation (2) alone. The results of the transmission-line analysis are shown in Fig. 6. Figure 6(a) presents the result for the diode ON state, while Fig. 6(b) shows the diode OFF state. The transmission phase difference between these states is plotted in Fig. 6(c). As described in Section 2, the ferrite’s rotational propagation characteristic operates primarily around 6.5 GHz within the 6 GHz band. Thus, for Port 1 – the blocked direction – the 6.5 GHz value is used as the representative response. As shown in Fig. 6(a), the ON-state circuit exhibits a high-pass filter characteristic similar to a metal strip line array. The simulation predicts a clear suppression of transmission from Port 1 at 6.5 GHz, representing the desired nonreciprocal behavior.
Transmission-line analysis results: (a) diode ON, (b) diode OFF, (c) phase difference of S12.

Figure 6 Long description
A line graph with the y-axis labeled, S-parameter decibel and the x-axis labeled, Frequency gigahertz. The x-axis runs from 3 to 9 with tick marks at 3, 4, 5, 6, 7, 8 and 9. The y-axis runs from 0 to minus 25 with tick marks at 0, minus 5, minus 10, minus 15, minus 20 and minus 25. A legend lists S11, S21, S12 and S22. S12 is a solid curve that starts near minus 6 at frequency 3, rises toward 0 by about frequency 5 and stays close to 0 through frequency 9. S22 is a dashed curve that starts near minus 1 at frequency 3 and decreases steadily to about minus 15 at frequency 9. A square marker for S11 is plotted near frequency about 6.6 at about 0. A square marker for S21 is plotted near frequency about 6.6 at about minus 21. The image B showing a line graph with the y-axis labeled, S-parameter decibel and the x-axis labeled, Frequency gigahertz. The x-axis runs from 3 to 9 with tick marks at 3, 4, 5, 6, 7, 8 and 9. The y-axis runs from 0 to minus 25 with tick marks at 0, minus 5, minus 10, minus 15, minus 20 and minus 25. A legend lists S11, S21, S12 and S22. S12 is a solid curve that starts near minus 6 at frequency 3, drops to a deep minimum near minus 25 around frequency 5, then rises to about minus 3 by frequency 9. S22 is a dashed curve that stays close to 0 across the range, with values near 0 around frequencies 4 to 6 and near minus 3 by frequency 9. A square marker for S11 is plotted near frequency about 6.6 at about 0. A square marker for S21 is plotted near frequency about 6.6 at about minus 20. The image C showing a line graph with the y-axis labeled, Phase degree and the x-axis labeled, Frequency gigahertz. The x-axis runs from 3 to 9 with tick marks at 3, 4, 5, 6, 7, 8 and 9. The y-axis runs from minus 180 to 180 with tick marks at minus 180, minus 120, minus 60, 0, 60, 120 and 180. A horizontal line is drawn at phase 0. A legend label reads, diff. The diff curve is near 70 to 90 from frequency 3 to just below 5, rises to about 110 just before frequency 5, then drops sharply to about minus 70 at about frequency 5. From frequency 5 to 9, the curve increases gradually from about minus 70 to about minus 20.
In contrast, as shown in Fig. 6(b), the OFF-state circuit exhibits a cutoff near 5 GHz, transitioning to transmission in the 6 GHz band. This configuration results in nonreciprocal isolation, with suppression occurring only for Port 1. Figure 6(c) indicates an S12 phase shift of approximately 40 degrees between ON and OFF states. Although the model does not include ferrite, the result confirms the feasibility of phase control.
Simulation results
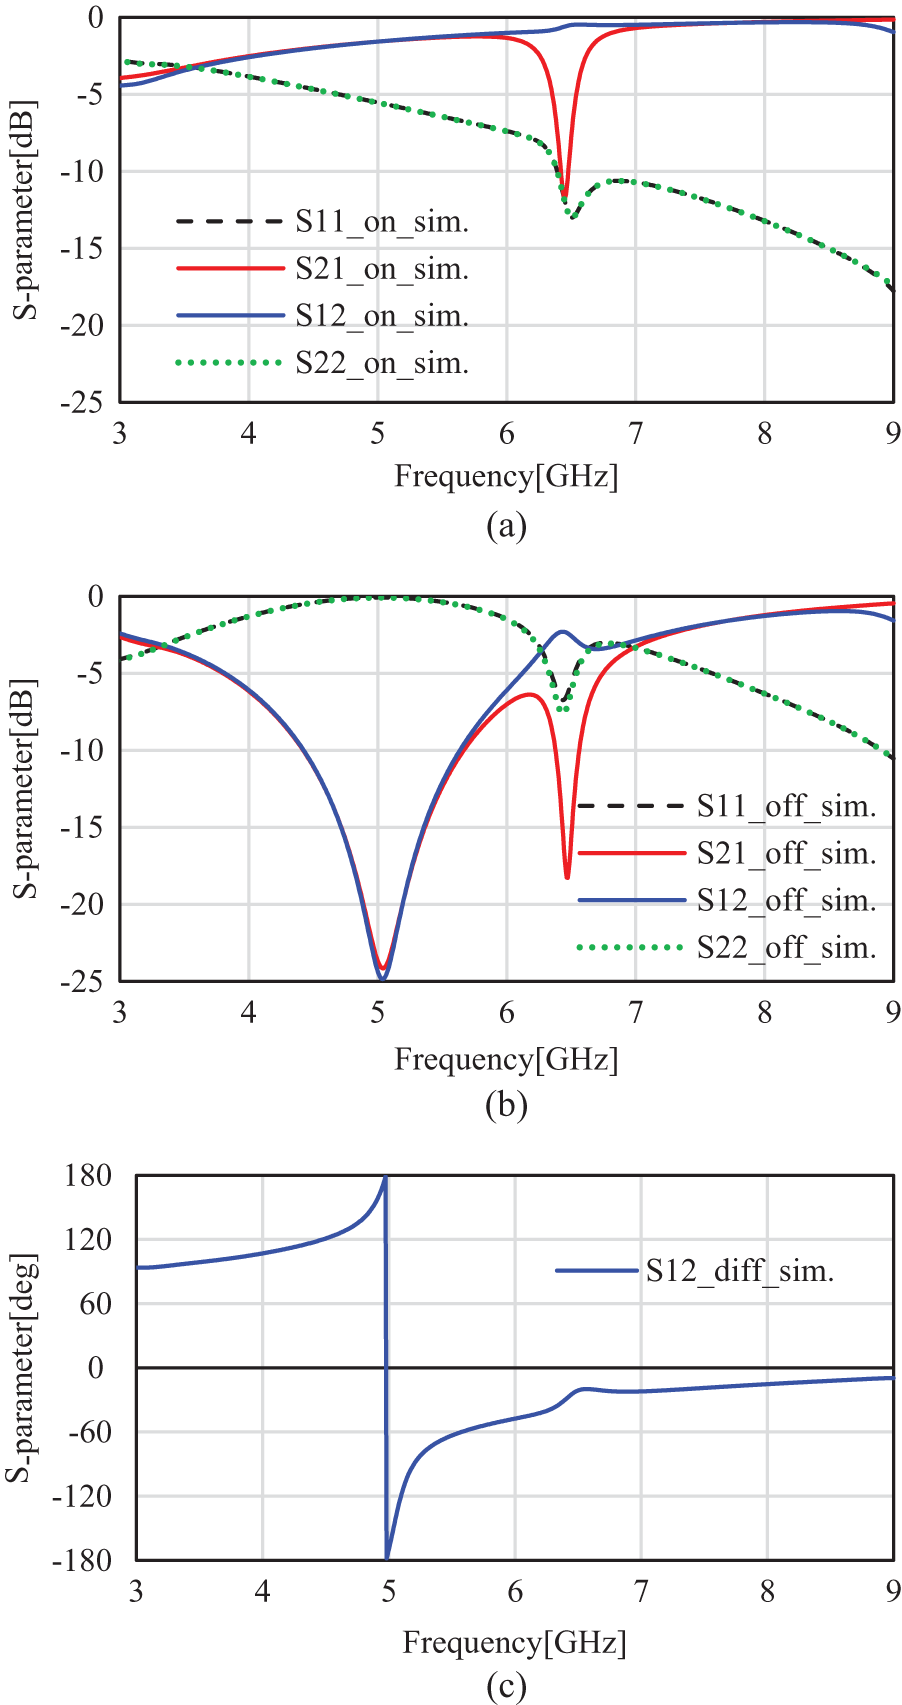
Electromagnetic simulations were conducted using the unit-cell analysis feature of the F-solver in CST Studio Suite, assuming an infinite periodic structure. The ferrite parameters used in the model are consistent with those described in Section 2, while the characteristics of the PIN diode were modeled using CST’s Schematic simulation environment. Figure 7(a) shows the result when the diode is in the ON state. A strong nonreciprocal behavior is observed near 6.5GHz, with a transmission level of – 0.6 dB and a rejection level exceeding – 11 dB. This behavior closely resembles that of previously reported passive-type nonreciprocal metasurfaces without PIN diodes [Reference Takahagi and Tennant8]. The reason for this is that, under the ON condition, the metallic structure behaves as a continuous conducting surface, producing behavior consistent with the high-pass filter characteristics predicted by the transmission-line theory in Fig. 6(a). In contrast, Fig. 7(b) shows the result when the diode is in the OFF state. At the same frequency (∼6.5 GHz), a transmission level of—2.3 dB and a rejection level better than – 17 dB were achieved, indicating strong nonreciprocal behavior. The slight reduction in transmission level compared to the ON case is attributed to the impedance shift caused by the diode’s OFF-state characteristics, which move the passband of the metallic patch structure toward higher frequencies. The stopband appears around 5 GHz, in good agreement with the result predicted by transmission-line analysis. However, when compared to Fig. 6(b), the simulation result reveals a reversal in transmission and reflection characteristics in the 6 GHz nonreciprocal band. This discrepancy arises because the CST simulation more accurately models the full 3D geometry, whereas the analytical model assumes a simplified strip line approximation. The phase difference in the transmission, shown in Fig. 7(c), also resembles the behavior in Fig. 6(c), exhibiting an approximate phase shift of 30 degrees. This is likely due to enhanced transmission through the ferrite, which affects the phase response. While a binary phase shift of 180 degrees is desirable for ideal phase control, the observed result demonstrates meaningful differentiation at this preliminary stage of design. Importantly, the simulation results confirm that even with the inclusion of PIN diodes in the metallic patches, the nonreciprocal operating frequency remains unchanged, and transmission continues to occur in the same direction, validating the effectiveness of the proposed design.
Full-wave simulation results: (a) transmission and isolation with diode ON, (b) transmission and isolation with diode OFF, (c) transmission phase difference (S 12) between ON and OFF states.

Figure 7 Long description
The line graph A has the y axis labeled, S parameter decibel, with tick labels 0, minus 5, minus 10, minus 15, minus 20, minus 25. The x axis is labeled, Frequency gigahertz, with tick labels 3, 4, 5, 6, 7, 8, 9. A legend lists four traces: S11 on sim shown as a dashed line, S21 on sim shown as a solid line, S12 on sim shown as a solid line and S22 on sim shown as a dotted line. The S21 on sim trace has a narrow notch centered between 6 and 7 gigahertz, reaching about minus 12 decibel and is near 0 decibel from about 7 to 9 gigahertz. The S12 on sim trace stays close to 0 decibel from about 6 to 9 gigahertz. The S22 on sim trace slopes downward from about minus 3 decibel near 3 gigahertz to about minus 18 decibel near 9 gigahertz, with a dip between 6 and 7 gigahertz reaching about minus 13 decibel. The S11 on sim trace is near the top of the plot and remains close to 0 decibel from about 6 to 9 gigahertz. The line graph B has the y axis labeled, S parameter decibel, with tick labels 0, minus 5, minus 10, minus 15, minus 20, minus 25. The x axis is labeled, Frequency gigahertz, with tick labels 3, 4, 5, 6, 7, 8, 9. A legend lists four traces: S11 off sim shown as a dashed line, S21 off sim shown as a solid line, S12 off sim shown as a solid line and S22 off sim shown as a dotted line. The S12 off sim trace has a deep notch at about 5 gigahertz reaching about minus 25 decibel, then rises toward about minus 3 decibel near 6.5 gigahertz and approaches near 0 decibel by about 9 gigahertz. The S21 off sim trace has a narrow notch between 6 and 7 gigahertz reaching about minus 18 decibel and is near 0 decibel by about 9 gigahertz. The S22 off sim trace is near 0 decibel around 5 gigahertz, then decreases after about 6.5 gigahertz to about minus 10 decibel near 9 gigahertz. The S11 off sim trace is shown near about minus 14 decibel around 7 gigahertz. The line graph C has the y axis labeled, S parameter degree, with tick labels 180, 120, 60, 0, minus 60, minus 120, minus 180. The x axis is labeled, Frequency gigahertz, with tick labels 3, 4, 5, 6, 7, 8, 9. A legend label reads, S12 diff sim. The plotted line rises from about 90 degrees near 3 gigahertz to 180 degrees at about 5 gigahertz, then drops vertically at about 5 gigahertz to about minus 180 degrees. After 5 gigahertz, the line increases from about minus 180 degrees to about minus 60 degrees by about 6 gigahertz, then stays near about minus 30 degrees around 6.5 gigahertz and approaches about 0 degrees by about 9 gigahertz.
Experimental results
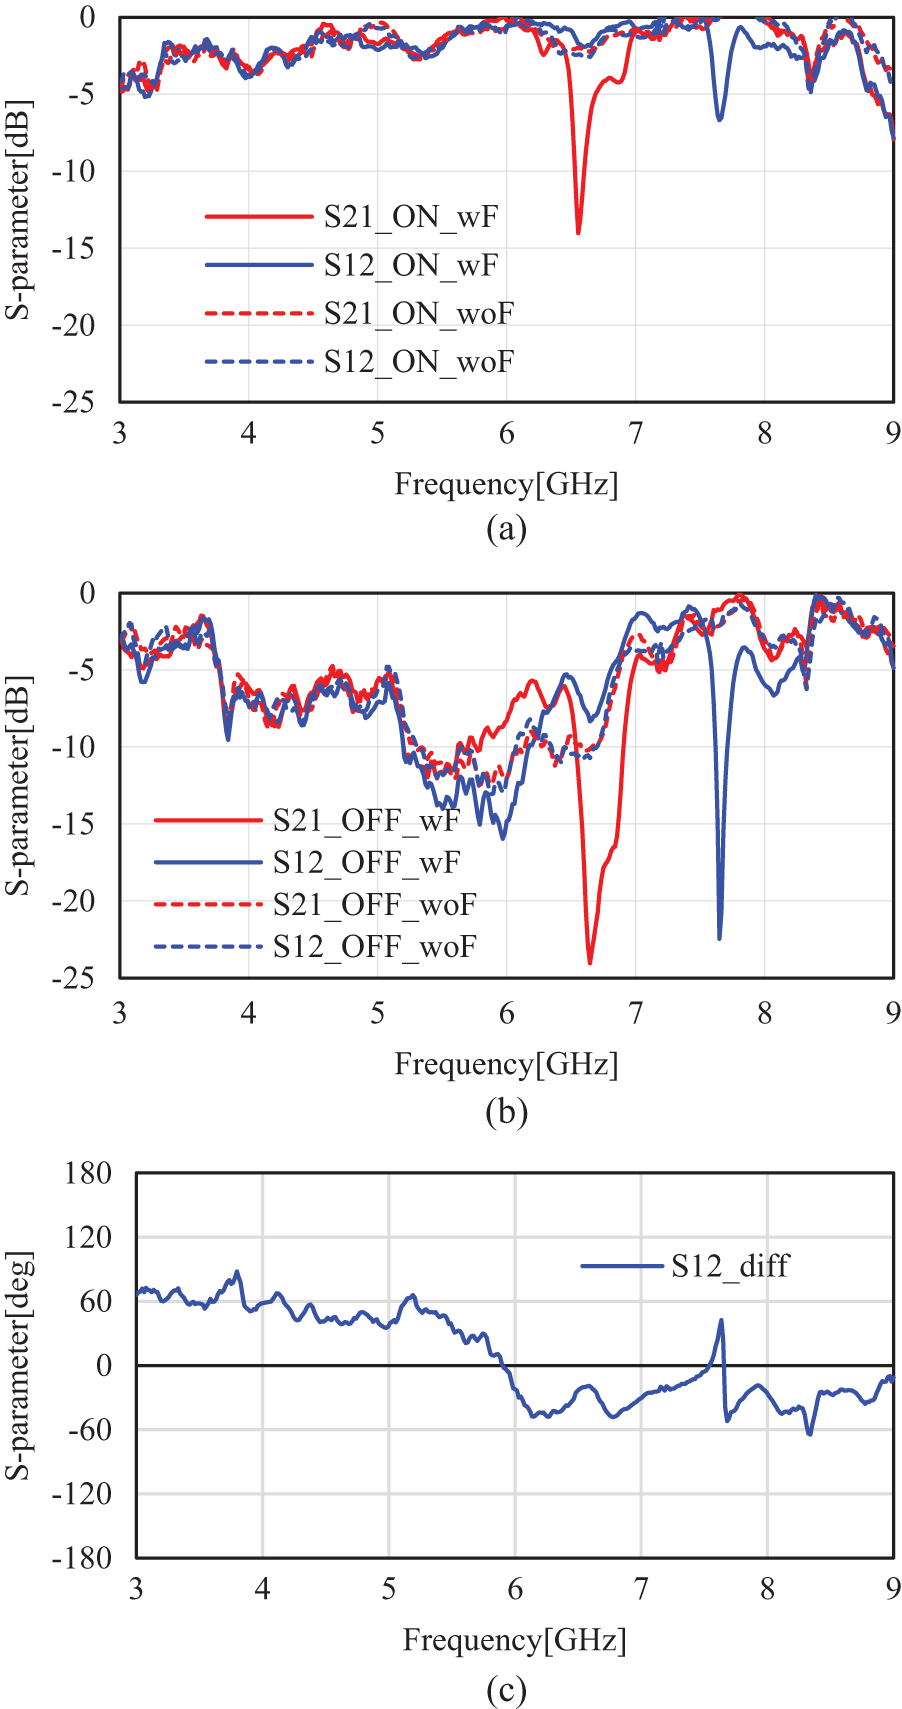
An experimental model of the phase-controllable nonreciprocal metasurface was fabricated using a 1.6 mm-thick FR4 substrate with copper foil patches and ferrite elements manufactured by Molex. The metasurface consisted of a 3 × 3 array, as shown in Fig. 8. DC bias for the PIN diodes was applied across the upper and lower sides of the patches, and in the ON state a voltage of 5 V and current of 10 mA were supplied to all three rows simultaneously. The fabricated sample was placed between a pair of horn antennas, and S-parameters were measured using a vector network analyzer (Agilent 8532B). To stabilize the field distribution while avoiding physical interference with the small 3 × 3 sample, a metal shielding plate with a center aperture was used. Figure 9(a) shows the ON-state result. A sharp nonreciprocal response appears near 6.6 GHz, with a transmission level of – 1.8 dB and isolation of – 14 dB, closely matching the simulation in Fig. 7(a). In the OFF state, shown in Fig. 9(b), a transmission level of – 7.2 dB and isolation of – 24 dB were observed, indicating a similar trend to Fig. 7(b) despite the reduced transmission magnitude. Two factors account for this reduction. First, the OFF-state bandpass frequency shifted upward, placing 6.5 GHz near the transition between the stopband and passband. Second, periodic ripple-like dips occurred in both states due to multi-path interference between the sample and the shielding plate. In both Fig. 9(a) and (b), results with and without ferrite loading are shown for comparison. Outside the ferrite’s operational band (around 6.5 GHz, Fig. 2), the ON-state transmission and OFF-state stopband near 5 GHz remain essentially unchanged, confirming that nonreciprocity can be added to an existing metasurface simply by loading ferrite without modifying the original structure. Additionally, reverse-direction nonreciprocal behavior was observed near 7.8 GHz. This can be attributed to the ferrite’s rotational propagation characteristics, which depend on the relationship between saturation magnetization and applied magnetic field. While the simulation assumes an ideal, uniform magnetic field, the experimental setup applies bias using finite-sized permanent magnets, which may introduce field nonuniformity or angular deviation, leading to reversed nonreciprocal behavior near the operating band. Regarding the phase shift, Fig. 9(c) shows a value of approximately 30°, consistent with the simulation in Fig. 7(c). Despite minor deviations, the overall experimental results validate the proposed concept and provide important insights for further improvement. The designed forward transmission level is approximately −3 dB (Fig. 6b), whereas Fig. 9(b) shows a lower measured value (around −8 dB) due to ripple and mismatch effects from the measurement fixture. Nevertheless, the overall nonreciprocal trend agrees with the simulation, and improved fixture conditions would yield transmission closer to the design value.
Fabricated prototype of the nonreciprocal metasurface used for transmission phase control experiment, (a) model (b) set-up.

Experimental results: (a) with and without ferrite in diode ON state, (b) with and without ferrite in diode OFF state, (c) measured transmission phase difference between ON and OFF states.

Figure 9 Long description
The line graph A has the y-axis labeled, S-parameter decibel, ranging from minus 25 to 0 and the x-axis labeled, Frequency gigahertz, ranging from 3 to 9. The legend lists four traces: S21 underscore ON underscore wF, S12 underscore ON underscore wF, S21 underscore ON underscore woF and S12 underscore ON underscore woF. All four traces vary between about minus 5 and 0 across most of 3 to 9 gigahertz. The S21 underscore ON underscore wF trace has a narrow deep dip near about 6.6 gigahertz reaching roughly minus 14 decibel. The S12 underscore ON underscore wF trace shows a narrower dip near about 7.7 to 7.8 gigahertz reaching roughly minus 7 decibel. Near 9 gigahertz, the traces drop to around minus 8 to minus 10 decibel. The line graph B has the y-axis labeled, S-parameter decibel, ranging from minus 25 to 0 and the x-axis labeled, Frequency gigahertz, ranging from 3 to 9. The legend lists four traces: S21 underscore OFF underscore wF, S12 underscore OFF underscore wF, S21 underscore OFF underscore woF and S12 underscore OFF underscore woF. From 3 to about 5.5 gigahertz, the traces fluctuate mostly between about minus 3 and minus 10 decibel, with a broader low region around 5.5 to 6.2 gigahertz where several traces reach about minus 12 to minus 16 decibel. The S21 underscore OFF underscore wF trace has a sharp deep notch near about 6.7 gigahertz reaching roughly minus 24 decibel. The S12 underscore OFF underscore wF trace has a sharp deep notch near about 7.7 to 7.8 gigahertz reaching roughly minus 23 decibel. From about 8 to 9 gigahertz, the traces rise toward about minus 2 to 0 decibel with small dips. The line graph C has the y-axis labeled, S-parameter degree, ranging from minus 180 to 180 and the x-axis labeled, Frequency gigahertz, ranging from 3 to 9. The legend shows one trace labeled, S12 underscore diff. The curve starts near about 60 degrees at 3 gigahertz, stays between about 40 and 80 degrees up to around 5.5 gigahertz, then drops through 0 near about 6 gigahertz to around minus 60 degrees near about 6.2 gigahertz. Between about 6.2 and 7.5 gigahertz it varies between about minus 60 and minus 20 degrees. Near about 7.7 gigahertz there is a narrow upward spike to about 40 degrees followed by a sharp drop back below 0. From about 8 to 9 gigahertz the curve stays mostly between about minus 80 and minus 20 degrees.
On–OFF control of nonreciprocity
Simulation-based design
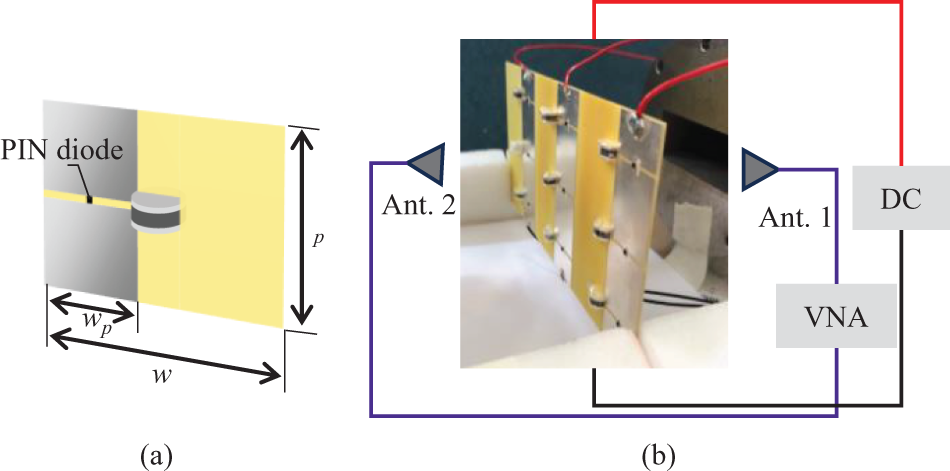
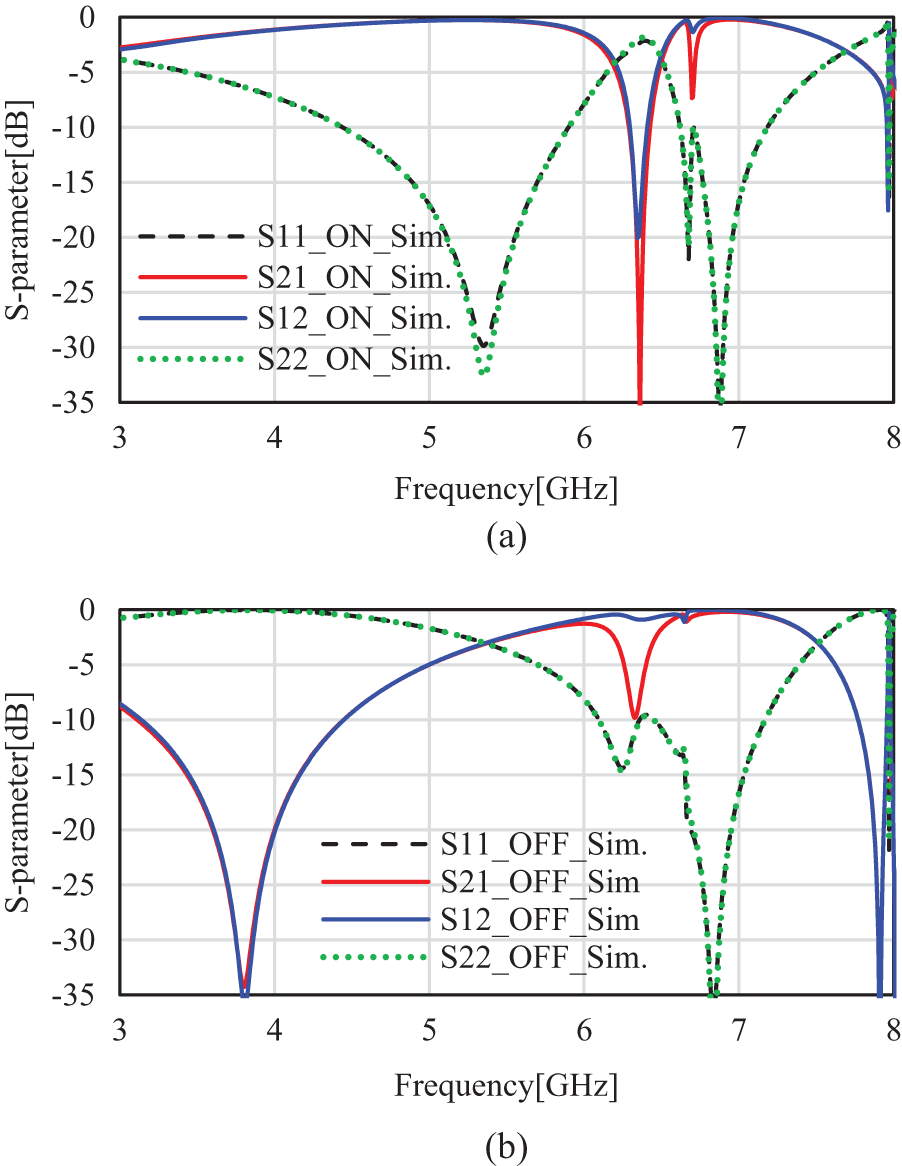
The second method for achieving active control of nonreciprocity – ON–OFF switching – is based on the configuration illustrated in Fig. 3(b), where the objective is to block the transmission path in the ON state. Specifically, the metasurface must behave as a band-pass structure in the OFF state, and transition to a band-stop structure in the ON state, thus disabling nonreciprocal transmission when the PIN diode is switched on. To realize this behavior, we optimized the unit cell geometry shown in Fig. 10(a). Through parameter sweeps using CST Studio Suite, the optimal dimensions were found to be: cell width w = 45 mm, patch width wp = 19 mm, and cell height p = 25 mm. The required 45-mm cell width, which produces the stopband near 6.5 GHz in the ON state, is comparable to the wavelength at that frequency. Consequently, this dimension approaches the limit of equivalent-circuit models such as (2) and (3), which assume electrically small structures. For this design, we therefore rely solely on full-wave simulation. The results are shown in Fig. 11. Figure 11(a) presents the ON-state response, where a sharp stopband appears around 6.5 GHz, indicating that both Port 1 and Port 2 are strongly suppressed, i.e., the nonreciprocal response is canceled. In contrast, the OFF-state result in Fig. 11(b) shows clear nonreciprocity, with Port 2 maintaining transmission while Port 1 remains suppressed as intended. The reduced isolation observed in Fig. 11(b) can be explained by the physical mechanism that produces nonreciprocity in this structure. Forward transmission is governed by the geometric patch width, whereas backward propagation is influenced by ferrite-induced rotation, which effectively increases the apparent patch width by the ferrite diameter. At the operating frequency, the patch width is already near the limit of validity for the transmission-line model, and the ferrite-augmented width results in weaker mismatch in the backward direction, thereby lowering the isolation. Although this design sacrifices some isolation, it was intentionally adopted to ensure bidirectional suppression in the ON state and nonreciprocal behavior in the OFF state. Further optimization may improve the isolation, but the present performance sufficiently verifies the ON–OFF control concept.
ON–OFF control metasurface model: (a) unit cell configuration, (b) fabricated prototype and measurement setup.

Figure 10 Long description
A unit cell schematic with a rectangular cell and a labeled PIN diode. Three dimension arrows are drawn: a horizontal arrow along the bottom labeled w, a shorter horizontal arrow near the lower left labeled wp and a vertical arrow on the right labeled p. The text, PIN diode, points to a small component on the left portion of the cell. A measurement connection diagram overlaid around a central photo of a fabricated prototype made of several upright rectangular boards. A triangular symbol labeled Ant dot 2 is connected by a line that runs to the lower part of the photo area and continues as a rectangular loop line toward the right side. On the right, a triangular symbol labeled Ant dot 1 connects by a line to a rectangular box labeled VNA. Above that, a rectangular box labeled DC connects by a line that runs upward and then across the top as a long line returning toward the left side. No numeric values or units are printed for w, wp, or p.
Simulation results: (a) ON-state response, (b) OFF-state response.

Figure 11 Long description
A line graph with the y-axis labeled, S-parameter dB and tick labels 0, minus 5, minus 10, minus 15, minus 20, minus 25, minus 30, minus 35. The x-axis is labeled, Frequency GHz, with tick labels 3, 4, 5, 6, 7, 8. A legend lists four traces: S11 ON Sim., S21 ON Sim., S12 ON Sim. and S22 ON Sim. The S21 ON Sim. trace has a narrow minimum at about 6.5 gigahertz reaching about minus 35 decibel and a smaller notch near about 6.7 gigahertz around minus 6 decibel. The S12 ON Sim. trace has a narrow minimum near about 6.5 gigahertz around minus 20 decibel and is near 0 decibel over much of the range outside that notch. The S22 ON Sim. trace forms a broad dip with a minimum near about 5.3 gigahertz around minus 30 decibel, then rises toward about minus 2 decibel near about 6.3 gigahertz, then shows multiple narrow dips between about 6.6 and 7.0 gigahertz, including a minimum near about 6.9 gigahertz reaching about minus 35 decibel. The S11 ON Sim. trace is shown in the legend. The image B showing a line graph with the y-axis labeled, S-parameter dB and tick labels 0, minus 5, minus 10, minus 15, minus 20, minus 25, minus 30, minus 35. The x-axis is labeled, Frequency GHz, with tick labels 3, 4, 5, 6, 7, 8. A legend lists four traces: S11 OFF Sim., S21 OFF Sim, S12 OFF Sim and S22 OFF Sim. The S12 OFF Sim trace has a deep minimum near about 3.9 gigahertz reaching about minus 35 decibel, then rises toward about 0 decibel by about 6.0 gigahertz and drops again near about 7.9 to 8.0 gigahertz to about minus 35 decibel. The S21 OFF Sim trace shows a notch near about 6.4 gigahertz reaching about minus 10 decibel and is near 0 decibel around about 7.0 gigahertz. The S22 OFF Sim trace stays near 0 decibel from about 3 to 5 gigahertz, dips to about minus 15 decibel near about 6.3 gigahertz, then reaches a deep minimum near about 6.9 gigahertz at about minus 35 decibel and rises toward 0 decibel by about 8 gigahertz. The S11 OFF Sim. trace is shown in the legend.
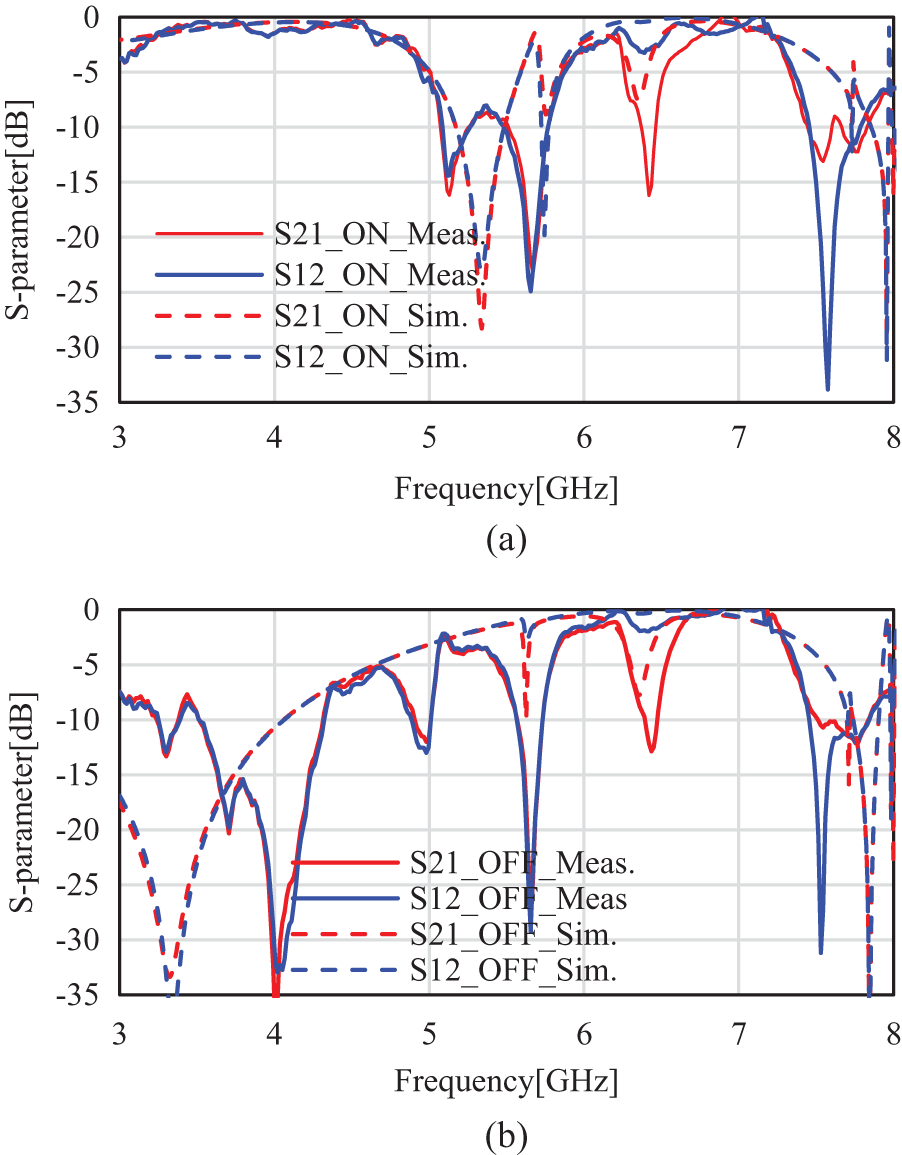
Experimental results and back-fitted simulation
The fabricated prototype for the ON–OFF controlled metasurface is shown in Fig. 10(b). The experimental setup follows the same configuration used for the phase-control measurements: a 3 × 3 array mounted within a metallic shielding plate to suppress edge diffraction and ensure stable measurement. The measured S-parameters are plotted as solid lines in Fig. 12. Figure 12(a) and (b) show the ON- and OFF-state results, respectively. In both states, nonreciprocal behavior appears near 6.5 GHz, although the ON-state stopband frequency shifts from the simulated value. This deviation likely arises from the square patch geometry, whose broader current distribution increases parasitic capacitance compared to the rhombic patch used in the phase-control design. To examine this effect, we performed back-fitted electromagnetic simulations by adjusting the substrate permittivity. The dashed curves in Fig. 12 represent these results. A permittivity increase of 1.3 yielded the best agreement, with the resonant dips and nonreciprocal features aligning closely with the measurements, particularly for the ON state in Fig. 12(a). Parasitic capacitance around the PIN-diode mounting may contribute to the deviation; however, variability in the dielectric constant of FR4 is considered the dominant factor, as such variations are widely reported [Reference Mumby and Yuan17], and the square-patch configuration is especially sensitive to them. These findings indicate that achieving sharp and repeatable stopband characteristics requires substrate materials with well-controlled permittivity.
Comparison of experimental results (solid lines) and back-fitted simulations (dashed lines): (a) ON state, (b) OFF state.

Figure 12 Long description
A line graph with four curves and a legend. The x-axis label is, Frequency in gigahertz, with tick labels 3, 4, 5, 6, 7 and 8. The y-axis label is, S parameter in decibel, with tick labels 0, minus 5, minus 10, minus 15, minus 20, minus 25, minus 30 and minus 35. The legend lists four series: S two one underscore on underscore meas, S one two underscore on underscore meas, S two one underscore on underscore sim and S one two underscore on underscore sim. All four curves stay near 0 decibel from about 3 to about 5 gigahertz, then show multiple dips between about 5 and 6 gigahertz. One curve reaches about minus 25 decibel near about 5.7 gigahertz. Another curve reaches about minus 30 decibel near about 5.4 gigahertz. Between about 6 and 7 gigahertz, the curves rise back toward 0 decibel with smaller dips. Near about 7.5 gigahertz, one curve drops to about minus 35 decibel, then rises again toward the right edge. The image B showing a line graph with four curves and a legend. The x-axis label is, Frequency in gigahertz, with tick labels 3, 4, 5, 6, 7 and 8. The y-axis label is, S parameter in decibel, with tick labels 0, minus 5, minus 10, minus 15, minus 20, minus 25, minus 30 and minus 35. The legend lists four series: S two one underscore off underscore meas, S one two underscore off underscore meas, S two one underscore off underscore sim and S one two underscore off underscore sim. From about 3 to 4.5 gigahertz, the curves include several dips, including a deep dip near about 4.0 gigahertz reaching about minus 35 decibel. Around about 5.6 gigahertz, one curve drops to about minus 30 decibel. From about 6 to 7 gigahertz, the curves are near 0 decibel with a dip near about 6.5 gigahertz reaching about minus 12 decibel on one curve. Near about 7.5 gigahertz, one curve drops to about minus 30 decibel and near about 7.9 to 8.0 gigahertz, a dashed curve drops to about minus 35 decibel.
The ON state was originally designed to exhibit a bidirectional stopband, suppressing both S₂₁ and S₁₂ at the operating frequency (Fig. 11a). However, in Fig. 12(a), a strong nonreciprocal response reappears near 6.5 GHz. This occurs because FR4 permittivity variations shift the stopband downward toward 5 GHz, preventing simultaneous suppression of both ports at 6.5 GHz. The difference between measured and simulated isolation levels mainly reflects limitations in the material model used to reproduce the prototype. Although the fabricated 3 × 3 sample shows periodic fluctuations caused by finite-array effects and edge interactions; the dominant behavior remains accurately captured by the periodic unit-cell model. In our previous passive ferrite–patch study [Reference Takahagi and Tennant8], infinite-periodic simulations and finite-array experiments showed close qualitative agreement with only minor edge-related deviations. Since the same electromagnetic mechanism governs the present design, unit-cell simulation provides a sufficient basis for interpreting the measured trends, even without a full-array model that includes all active components. For clarity, the design evolution is summarized here. The passive ferrite–patch structure inherently provides nonreciprocity around 6.5 GHz, achieving approximately −20 dB of isolation. Building on this baseline, two active schemes were developed. (i) In the phase-control mode, the PIN diode adjusts the effective series impedance while preserving the forward path, yielding about 30° of transmission-phase tuning with isolation above −10 dB. (ii) In the ON–OFF mode, widening the patch forms a bidirectional stopband when the diode is ON, while the OFF state retains nonreciprocity. Although FR4 permittivity variations shift the stopband in practice, both states display clear nonreciprocal behavior with isolation around −10 dB. These step-by-step modifications show how the design progresses from passive operation to two distinct active nonreciprocal mechanisms.
Comparison with previous nonreciprocal metasurfaces
Table 1 summarizes recent representative studies on active nonreciprocal metasurfaces. Compared to prior works using transistors or nonlinear materials [Reference Guo and Argyropoulos18], the proposed structure offers a simple and compact design by integrating ferrite and PIN diodes into a conventional patch array. It achieves dual-mode controllability with practical performance in the microwave band.
Comparison of active nonreciprocal metasurfaces

Table 1 Long description
Four columns compare This work with references 6, 7, and 18 across structure, activation method, frequency band, nonreciprocity level, control type, and simplicity. For structure, This work is ferrite and metal patch array; reference 6 is planar antenna and metasurface; reference 7 is magnetic metasurface; reference 18 is plasmonic and nonlinear layer. Activation method is PIN diode for This work, amplifier for reference 6, self biased ferrite for reference 7, and gain plus nonlinearity for reference 18. Frequency band is 6 GHz band for This work, approximately 5.9GHz for reference 6, approximately 15GHz for reference 7, and near IR for reference 18. Nonreciprocity level is circle with 11 to 24 dB for This work, double circle with 12 to 21 dB for reference 6, circle with 77 percent trans. for reference 7, and double circle with unity contrast for reference 18. Control type is double circle with 2 mode for This work, circle with on off for reference 6, triangle with passive for reference 7, and cross with intensity dep. for reference 18. Simplicity is double circle for This work, cross for reference 6, triangle for reference 7, and cross for reference 18.
Conclusion
In this study, we evaluated the feasibility of active phase control in a nonreciprocal metasurface previously reported by our group. Using PIN diode-based current control, we successfully achieved a transmission phase difference while maintaining nonreciprocal behavior at the same operating frequency. In addition, for ON–OFF control of nonreciprocity, the differences observed between the design and experimental results allowed us to identify key considerations for future design improvements. These findings have provided an important design direction toward the realization of phase-controllable nonreciprocal metasurfaces. Future challenges include improving the magnitude of phase shift and maintaining high transmission levels in the phase-control approach. For the ON–OFF control approach, it will be necessary to eliminate the effects of substrate manufacturing variability and to optimize the structure to be less sensitive to such variations. In addition to these device-level challenges, future work includes extending the dual-control concept to larger arrays and higher-frequency bands, reducing insertion loss through material and matching optimization, and exploring integration with practical wireless platforms such as adaptive isolation or reconfigurable shielding systems. Based on the insights gained from this study, we aim to further optimize the metasurface design in our future work.
Competing interests
The authors declare none.