





1 Introduction
Pulsed fiber lasers with compactness, flexibility, reliability and large pulse energy have become appropriate for numerous fields, ranging from industrial manufacturing[ Reference Lu, Jin, Xu, Wang and Yang 1 – Reference Dong, Zhang, Kou, Liu, Yan, Yang, Li, Zhang and Yang 3 ] and material processing[ Reference Lutey, Fortunato, Carmignato and Fiorini 4 – Reference Ravesio, Adrian, Versaci, Romoli, Bodoardo and Sustain 6 ] to scientific research[ Reference Wang, Yang, Han, Pang, Fan, Xu, He and Fang 7 , Reference Malik and Manna 8 ]. In the case of laser-induced breakdown spectroscopy (LIBS)[ Reference Ahmed, Iqbal and Baig 9 , Reference Ahmed and Baig 10 ], the pulsed laser serves as a critical component, whose parameters such as pulse energy and repetition rate directly influence the processes of material ablation, vaporization and ionization, thereby affecting the signal intensity of the plasma emission. In the realm of photoacoustic imaging (PAI)[ Reference Lin, Hu, Shi, Appleton, Maslov, Li, Zhang and Wang 11 , Reference Yang, Zhao, He, Su, Zhao, Tang, Hong, Li, Yang, Lin, Zhang, Zhang, Jiang and Li 12 ], high laser energy is the prerequisite for realizing ‘deep, high-definition and functional’ imaging of the human body. By resolving the physical bottleneck of optical scattering in tissue, these lasers have become the enabling technology for the clinical translation of advanced vascular imagers and breast cancer screening tools. Therefore, for a multitude of such applications, there is a compelling demand for all-fiber nanosecond laser systems delivering both high pulse energy and high peak power, ensuring superior advantages in terms of stability and flexibility.
However, the nonlinear effect and amplified spontaneous emission (ASE) limit the increase in the pulse energy of the pulse laser in all-fiber structures[ Reference Yin, Han, Shen and Zhu 13 – Reference Gao, Zhao, Fan, Ju, Zhang, Li, Gao and Li 15 ]. Studies have shown that optimizing pulse waveforms[ Reference Dinger, Grundmann, Hapke, Kallage, Rath and Ruppik 16 – Reference Liu, Chen, Zhang, Li, Shum, Wang and Cheng 18 ], elevating pre-amplifier energy[ Reference Zhang, Shen, Chen, Zheng, Yan and Gong 19 , Reference Zheng, Zhang, Cheng, Liu, Yan and Gong 20 ] and adopting a large-mode-area (LMA) fiber[ Reference Zheng, Gong, Zhang, Yan, Xiao and Liu 21 – Reference Wang, Lin, Zhang, Xing, Liao and Li 23 ] in the main amplifier stage collectively facilitate high-energy, high-peak-power pulse generation. In recent years, with the development of fiber fabrication technology and the evolution of passive fiber components, research results with respect to realizing a nanosecond high-average and peak-power laser have been published more frequently. Employing the master oscillator power amplifier (MOPA) system, Shen et al. [ Reference Shen, Zhang and Gong 22 ], with free-space pump architecture, obtained a pulsed laser with a peak power of 8 MW and a pulse energy of 100 mJ based on a 200-μm-core-diameter Yb-doped gain fiber, achieving a peak power that exceeded the fiber self-focusing threshold. By the means of spatial coupling and pulse pre-shape setting, Dinger et al. [ Reference Dinger, Grundmann, Hapke, Kallage, Rath and Ruppik 16 ] reported a 150 mJ high-energy pulse laser with a pulse width of 90 ns. In summary, the ultra-high nonlinearity threshold of extremely LMA ytterbium-doped fibers (YDFs) enables spatially coupled MOPA architectures to reach the hundred-millijoule level. Essentially, all of the above-mentioned systems were fundamentally dependent on spatial coupling for beam combination in the main amplifier stage, which required a complex optical layout and critical alignment, and could also compromise the stability and robustness of the laser structures. Subsequently, with advancements in fiber combiner and filtering technologies in fiber components, all-fiber-based, high-energy, high-peak-power laser systems have also been frequently reported. Li et al. [ Reference Li, Shi, Fu, Xue, Zou, Zheng, Liu, Wang and Wang 24 ] employed a 30/250 μm YDF as the gain medium in the main amplifier stage. By utilizing a bidirectional 976 nm pumping scheme, they effectively mitigated the issues of ASE accumulation and heat concentration inherent in unidirectional pumping, achieving a near-diffraction-limited output with an energy of 3 mJ. Cai et al. [ Reference Cai, Zhu, Shi, Li, Yan, Li and Xing 25 ] reported an all-fiber-based MOPA laser with a pulse energy of 51.2 mJ and an average power of 512 W by adopting a homemade 300-μm YDF. Ning et al. [ Reference Ning, Zou, Yu, Xu, Chen, Zuo, Han, Li, Zhang, He and Lin17 ] demonstrated an all-fiberized MOPA format with an average power of more than 1 kW, pulse energy of 10 mJ and peak power of 0.78 MW using pulse distortion and narrowing of 30 ns laser pulses as the seed signal. This study provided a detailed investigation into the influence of seed pulse width on the suppression of nonlinear effects in the main amplifier stage. Notably, under identical conditions, short pulses generate a relatively higher peak power density than long pulses, leading to more severe nonlinear effects in the pre-amplifiers. Consequently, it remains a challenge to realize a monolithic, all-fiber laser system that operates with short pulses and possesses highly integrated performance parameters.
In our previous work targeting the amplification of low-repetition-rate signals, we developed a novel approach termed pulse-picking amplification[ Reference Cheng, Xu, Chen, Shu, Dai, Xing, Li, Peng and Li 26 ]. Compared to the conventional synchronous pulse pumping scheme integrated with acousto-optic modulator (AOM) -based temporal filtering, the pulse-picking amplification architecture exhibits superior structural robustness, higher optical-to-optical conversion efficiency and outstanding ASE suppression capabilities. Consequently, it represents a more viable and scalable approach for achieving high-energy pulse amplification in all-fiber MOPA systems. Experimental results have demonstrated its effectiveness in suppressing both ASE and nonlinear effects. In this paper, we build upon our previously established amplification scheme and report, for the first time to our knowledge, that nanosecond (∼5 ns) pulses with high energy (81 mJ), high peak power (12.1 MW) and a rather low repetition rate of 10 Hz simultaneously were generated in a multistage all-fiber-based amplifier system seeded by an electric-pulse-driven laser diode (LD) that provided a bandwidth as broad as 10 nm. A multistage architecture was used to provide sufficient injection pulsed energy for saturation amplification of the final fiber amplifier stage. In the main amplifier, we introduced two intermediate amplification stages utilizing 100/400 μm fibers specifically for signal mode homogenization, which significantly elevated the stimulated Raman scattering (SRS) threshold, thereby enabling a substantial increase in the seed energy injected into the final amplification stage. Furthermore, a high-absorption 200/400 μm active fiber was employed in the final power amplifier. This design ensured high conversion efficiency while maximizing the nonlinear threshold.
2 Fiber design and pulse-picking amplification scheme
To realize high-energy amplification, a prerequisite is to evaluate the energy extraction capability of the amplifier. Energy cannot be extracted indefinitely from the gain medium; for a fiber of specific dimensions, the maximum energy storage and extractable energy are primarily constrained by ASE[
Reference Schmidt, Rothhardt, Röser, Linke, Schreiber, Rademaker, Limpert, Ermeneux, Yvernault, Salin and Tünnermann
27
,
Reference Singh, Lorenzen, Wang, Gaafar, Sinobad, Francis, Edelmann, Geiselmann, Herr, Garcia-Blanco and Kärtner
28
]. Since the ASE threshold is intrinsically correlated with fiber dimensions, the core-to-cladding ratio and the dopant structure, optimizing the physical geometry of the active fiber is essential for achieving high peak power or high pulse energy. Based on high-energy extraction models, the theoretical maximum pulse energy attainable for a given fiber geometry can be estimated. In nanosecond pulsed fiber lasers, the saturation energy (
${E}_{\mathrm{sat}}$
 ) serves as a critical parameter for quantifying energy storage capacity. It is defined by the following equation[
Reference Richardson, Nilsson and Clarkson
29
]:

where
$h$
 is the Planck constant,
${\upsilon}_{\mathrm{s}}$
 is the signal frequency,
${A}_{\mathrm{co}}$
 is the cross-sectional area of the doped region,
${\sigma}_{\mathrm{es}}$
 and
${\sigma}_{\mathrm{as}}$
 represent the emission and absorption cross-sections at the signal wavelength, respectively, and
${\varGamma}_{\mathrm{s}}$
 is the overlap factor between the signal mode and the active region.
As indicated by the equation, the saturation energy is governed by the doped area, the emission and absorption cross-sections and the signal overlap factor. While the cross-sections are intrinsic material properties and thus difficult to manipulate, the saturation energy can be effectively enhanced by either increasing the doped cross-sectional area or reducing the overlap factor. Consequently, LMA fibers with a low numerical aperture (NA) inherently exhibit higher saturation energies. From the perspective of advanced fiber design, adopting a concave refractive index profile or a confined doping structure can tailor the modal distribution to reduce the effective spatial overlap between the signal mode and the active region. By decoupling the mode-field expansion from the active dopant distribution, it is possible to significantly elevate the saturation energy. Consequently, increasing the mode-field area in such specialized LMA fibers serves not only to reduce peak power density for nonlinearity suppression but also as a fundamental requirement for delayed gain saturation and high-energy extraction. However, low-repetition-rate signal pulses are inherently prone to inducing the generation and accumulation of ASE within the system, owing to limiting factors such as their extremely low duty cycle and weak signal strength. The adoption of LMA fibers further exacerbates this parasitic ASE amplification. Consequently, realizing efficient energy amplification while simultaneously ensuring effective ASE suppression remains a critical challenge that must be addressed in low-repetition-rate regimes. In this section, we primarily focus on the structural design of the 100/400 μm fiber to investigate its impact on mode energy homogenization and mode-field area expansion. Furthermore, to address the issue of ASE generated during the amplification of low-repetition-rate pulses, we propose a pulse-picking amplification scheme based on the conventional synchronized pulsed pumping technique. This scheme is designed to further suppress the generation and amplification of ASE within the system.
2.1 Design of M-type active doped fiber
Nonlinear effects constitute a primary constraint on energy scaling in nanosecond pulsed fiber lasers. Most of these effects, notably stimulated Brillouin scattering (SBS) and SRS, can be effectively mitigated by reducing the optical power density, which can be attainable by enlarging the mode field diameter (MFD). A prevalent approach to increasing the MFD involves the use of low-NA fibers featuring a depressed central core region. The central refractive index dip in M-type fibers forces the optical energy, typically concentrated at the core’s center, to diffuse outward to the periphery. This mechanism reshapes the optical field distribution: it attenuates the central intensity spike while enhancing intensity in the previously weak peripheral regions, thereby achieving energy homogenization during signal transmission. To evaluate the homogenization capability of such M-type fibers, numerical simulations were conducted to analyze the fractional energy distribution of the fundamental mode (LP01) and higher-order modes (HOMs). The analysis focuses specifically on the expansion of the MFD and the proportion of energy confined within the central region.
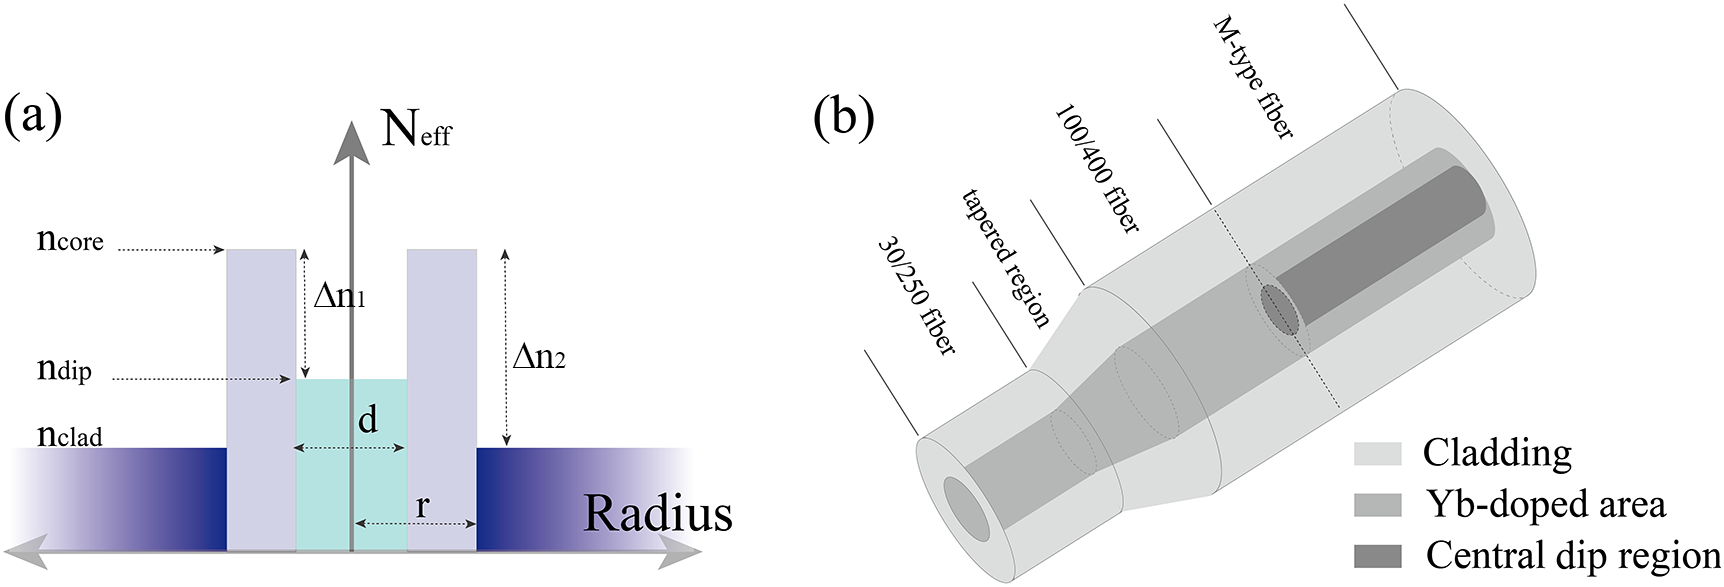
Figure 1(a) illustrates the refractive index profile and the cross-sectional geometry of the M-type fiber. Here,
${n}_{\mathrm{dip}}$
 ,
${n}_{\mathrm{core}}$
 and
${n}_{\mathrm{clad}}$
 denote the refractive indices of the central dip region, the fiber core and the silica cladding, respectively, satisfying the condition
${n}_{\mathrm{core}}$
 >
${n}_{\mathrm{dip}}$
 >
${n}_{\mathrm{clad}}$
 . The parameters d and r represent the diameter of the central dip and the radius of the fiber core, respectively. In addition,
$\triangle {n}_1$
 indicates the refractive index difference between the central dip and the core, while
$\triangle {n}_2$
 represents the index difference between the core and the cladding. The structural characteristics of the M-type fiber were numerically analyzed using the finite element method (FEM) within the COMSOL Multiphysics environment, incorporating a perfectly matched layer (PML) boundary condition.
Design of the M-type 100/400 μm fiber: (a) the refractive index profile of the M-type fiber; (b) beam propagation path.

Figure 1 Long description
Panel a is a line graph showing the refractive index profile. The vertical y-axis is labeled N sub e f f and the horizontal x-axis is labeled Radius. At the center is a light blue region with width d and refractive index n sub dip. Moving outward, there are two tall purple peaks with refractive index n sub core and width r. The difference between n sub core and n sub dip is delta n sub 1. The outermost layer is a dark blue region with refractive index n sub clad. The difference between n sub core and n sub clad is delta n sub 2.
Panel b is a three-dimensional diagram of the fiber propagation path. From the bottom-left to the top-right, the fiber transitions through four sections: 30/250 fiber, tapered region, 100/400 fiber, and M-type fiber. The cross-section reveals three concentric layers: an outermost light gray Cladding, a middle gray Y b-doped area, and a dark gray Central Dip Region at the core. The M-type fiber section shows the central dip region extending through the center of the Y b-doped area.
To investigate the modal energy distribution within the fiber during propagation, numerical analyses were conducted using the RSoft software suite, utilizing both the beam propagation method (BPM) and a specialized mode-solving algorithm. Figure 1(b) illustrates the beam propagation path within the laser system, which comprises a 30/205 μm fiber, a tapered transition region, a conventional step-index 100/400 μm fiber and an M-type 100/400 μm fiber. Specifically, the tapered region serves as a transition bridge for the fusion splice between the 30/250 μm fiber and the 100/400 μm fiber, effectively minimizing splice loss and mitigating beam quality degradation.
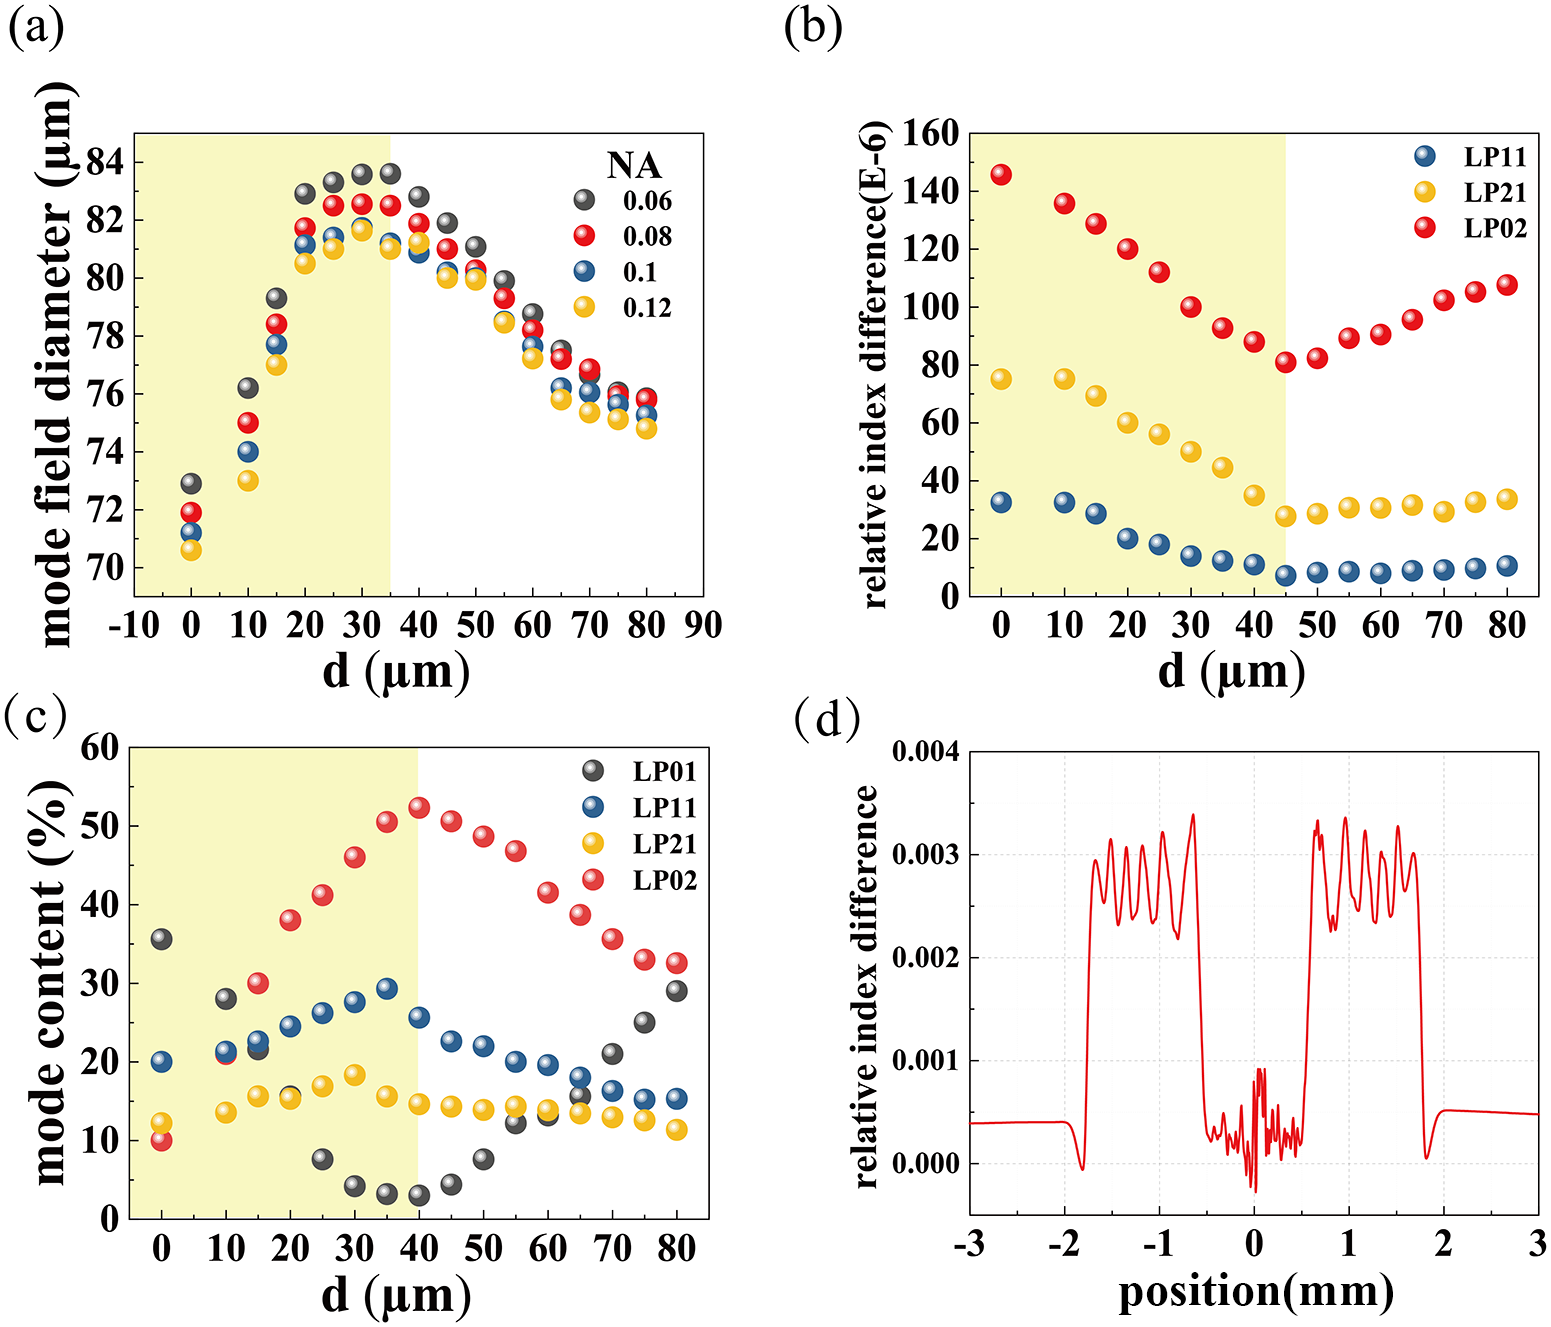
Figure 2(a) depicts the functional relationship between the fundamental mode-field diameter and the dip diameter for active fibers with varying NA, given a fixed
$\triangle {n}_1$
 of 0.0003. As observed, for active fibers with identical structural parameters, the MFD is substantially inversely proportional to the NA; that is, a higher NA corresponds to a smaller MFD. For a given NA, the case where d = 0 corresponds to a conventional step-index doped fiber. In this configuration, the fundamental MFD is minimized, resulting in the highest peak power density (power per unit area). With the expansion of the central dip diameter, the MFD exhibits a trend of initially increasing and subsequently decreasing. This indicates the existence of an optimal value for the dip diameter in M-type doped fibers that maximizes the MFD. Based on the proposed fiber architecture, we investigated the modulation of the effective refractive index difference between HOMs and the fundamental mode by the central dip diameter. As illustrated in Figure 2(b), it exhibits a non-monotonic evolution – initially decreasing and subsequently increasing – as d expands. Physically, as the effective indices of the HOMs and the fundamental mode converge and approach degeneracy, the phase mismatch between the modes is minimized, thereby satisfying the phase-matching condition. This significantly enhances the mode coupling coefficient, resulting in resonant energy transfer where power from the fundamental mode is efficiently coupled and leaked into parasitic HOMs.
(a) Variation of the effective mode-field diameter with the central dip diameter. (b) Variation of the effective refractive index difference between HOMs and the fundamental mode with the central dip diameter. (c) Variation of the mode energy distribution with the central dip diameter. (d) Refractive index profile of the optical fiber preform.

Figure 2 Long description
Panel a is a scatter plot of mode field diameter in micrometers versus d in micrometers. The x-axis ranges from negative 10 to 90. The y-axis ranges from 70 to 84. Four data series for N A values 0.06, 0.08, 0.1, and 0.12 show a sharp increase from d equals 0 to 30, peaking around 84 micrometers, followed by a gradual decline. Higher N A values correspond to lower mode field diameters.
Panel b is a scatter plot of relative index difference times 10 super negative 6 versus d. Three series L P 1 1, L P 2 1, and L P 0 2 show a downward trend until d equals 45, where they stabilize or slightly increase. L P 0 2 maintains the highest values, starting near 145.
Panel c is a scatter plot of mode content percentage versus d. It tracks four modes. L P 0 2 increases to a peak of approximately 52 percent at d equals 40 before declining. L P 0 1 shows a U-shaped curve, reaching its minimum near d equals 40. L P 1 1 and L P 2 1 show more stable, lower-percentage trends.
Panel d is a line graph of relative index difference versus Position in millimeters. The profile is symmetric around the 0 position. It features two high-intensity plateau regions with oscillating peaks between negative 1.8 and negative 0.5 millimeters and positive 0.5 and 1.8 millimeters. A sharp central dip with high-frequency noise is located at the 0 position.
To align with practical fiber specifications, the NA of the 30/250 μm fiber was set to 0.06, ensuring single-mode operation within this section. Both the conventional 100/400 μm fiber and the M-type doped fiber were assigned an NA of 0.1, with the refractive index difference
$\triangle {n}_1$
 for the M-type fiber maintained at 0.0003. The resulting modal energy distribution of the final laser output is presented in Figure 2(c). Analogous to the previously simulated trends regarding the effective mode area, the fundamental mode energy fraction in the system exhibits a trajectory of initially decreasing and subsequently increasing as the diameter of the central dip expands. In contrast to the conventional step-index fiber, where the fundamental mode content approaches about 40%, the fundamental mode fraction in the M-type fiber can drop to a minimum of 3%. This significant reduction indicates a substantial energy transfer from the fundamental mode to HOMs. Consequently, this mechanism effectively reduces the peak power density within the core while simultaneously homogenizing the mode-field energy of the laser output. In summary, the rational design of the M-type fiber’s geometry and refractive index profile serves as a pivotal strategy to spatially redistribute modal energy. By effectively mitigating local intensity hot spots and reducing the peak power density within the core, this approach not only homogenizes the beam profile but also significantly elevates the thresholds for nonlinear effects, thereby ensuring safer energy extraction. Guided by the aforementioned simulation results, we designed and fabricated the M-type 100/400 YDF. The refractive index profile of the corresponding preform is illustrated in Figure 2(d).
2.2 Pulse-picking amplification scheme
For low-repetition-rate signals, exemplified by a 10 Hz pulse train, the system remains in a signal-free ‘idle’ state for the vast majority of the duty cycle (~100 ms). Under a continuous-wave (CW) pumping scheme, the gain medium rapidly recovers to a high steady-state population inversion immediately after the signal pulse exits. During this prolonged 100 ms inter-pulse interval, this high inversion level persists, allowing ASE to be fully established and continuously amplified. To further suppress ASE and enhance the output energy of the laser system, synchronized pulsed pumping is commonly adopted for amplifying low-repetition-rate, low-energy signals. This technique involves modulating the pump source into a pulse sequence that is temporally synchronized with the signal pulses. The pump energy is precisely regulated by adjusting the pump pulse duration and peak power. By actively controlling the temporal evolution of population inversion within the gain medium, this scheme fundamentally optimizes the energy flow of the amplification process. Consequently, it serves as an effective technical solution to overcome critical bottlenecks in low-repetition-rate fiber amplifiers, including thermal management, ASE suppression and the mitigation of nonlinear effects.
However, even with the implementation of synchronized pulsed pumping, owing to the inherent emission limitations of the gain fiber, complete conversion of the upper-state population into a signal laser is practically unattainable. Consequently, a residual population inevitably remains in the excited state. These residual particles decay via spontaneous emission and contribute to ASE buildup, which parasitically consumes gain and hinders further signal energy scaling. To address this, we propose a novel pulse-picking amplification scheme based on the conventional synchronized pumping architecture. This method utilizes a high-repetition-rate seed synchronized with a low-repetition-rate pump train. In this configuration, only the specific seed pulse temporally aligned with the falling edge of the pump pulse undergoes effective amplification. The remaining seed pulses serve to deplete the residual upper-state population, thereby effectively suppressing the inception and subsequent amplification of ASE.
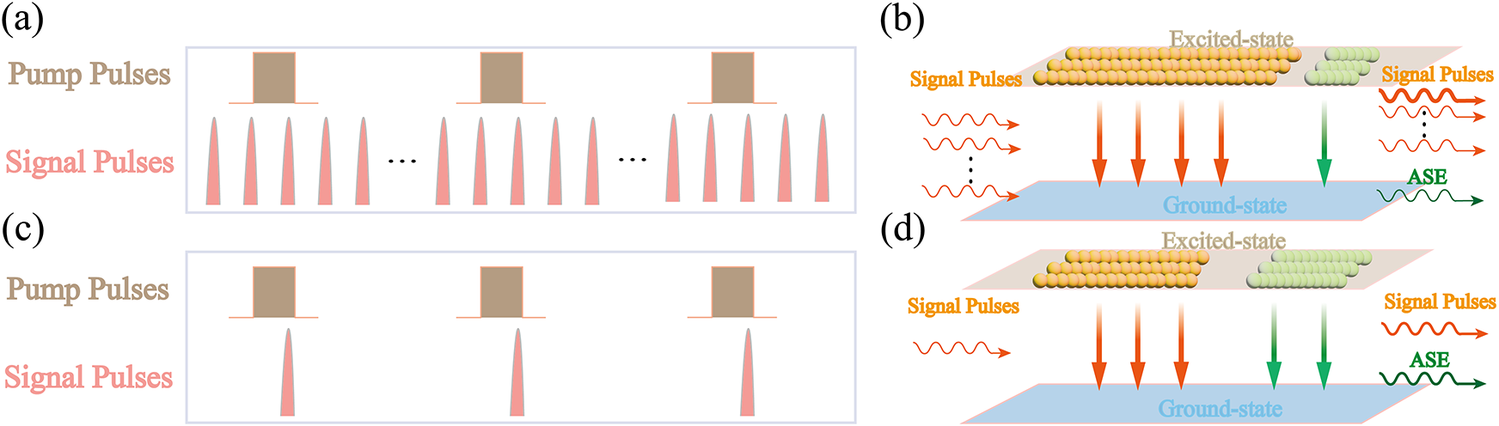
Figure 3 illustrates the temporal relationship between the signal and pump pulses during the amplification process. The pump pulses, typically generated via electrical modulation, exhibit a relatively regular rectangular profile. In contrast, the signal pulses evolve into a sharp, Gaussian-like profile due to pulse narrowing effects induced by gain saturation. As the pulse energy scales up, noticeable pulse narrowing and leading-edge steepening were observed. This deformation is a direct consequence of the energy-dependent gain saturation typical in nanosecond fiber amplifiers. Because the upper-state lifetime is substantially longer than the pulse duration, the leading edge extracts the majority of the stored energy and depletes the gain for the trailing edge, resulting in temporal compression of the pulse width. Figure 3(a) depicts the specific temporal dynamics of the pulse-picking amplification scheme. In this configuration, multiple seed pulses exist within the interval between two adjacent pump pulses. Figures 3(b) and 3(d) illustrate schematic diagrams of upper-state population transitions within a single cycle for the pulse-picking amplification scheme and the conventional pulsed pumping scheme, respectively. During the amplification process, under identical conditions of pump pulse peak power and duration, the total upper-level population excited by the pump remains essentially equivalent in both schemes. In the schematic, the yellow particles represent the upper-level population that undergoes stimulated emission to the ground state, thereby amplifying the signal. Conversely, the green particles denote the upper-level population that contributes to ASE. As clearly illustrated, upon the injection of the seed into the amplifier, the effective signal intensity in the pulse-picking scheme is relatively higher due to the high-repetition-rate pulse train. Consequently, a significantly larger fraction of the upper-level population is preferentially extracted and converted into signal energy, resulting in a substantially lower proportion of ASE. Furthermore, because a pulsed pumping scheme is employed, only the specific signal pulse temporally aligned with the falling edge of the pump pulse undergoes effective, high-energy amplification. The remaining unamplified sub-pulses serve exclusively as auxiliary gain extractors to continuously suppress the accumulation of ASE. In the pulse-picking amplification scheme, upon injection of the pump pulse into the gain medium, the upper-state population accumulates rapidly. Subsequently, a specific signal pulse aligned with the falling edge of the pump pulse is injected. This target pulse rapidly depletes the accumulated upper-state population, achieving efficient amplification. Regarding the residual upper-state population not fully extracted by the main pulse, a portion decays into ASE noise via spontaneous emission, while the remainder is consumed by the subsequent low-energy seed pulses. In contrast to the traditional pulsed pumping scheme shown in Figure 3(c), the final output repetition rate in the pulse-picking scheme is determined by the pump repetition rate. The remaining unamplified seed pulses within the system serve primarily to scavenge the residual population inversion, thereby competing with ASE for gain and suppressing its growth.
Schematic diagram of the time domain of pump pulses and seed pulses: (a) pulse-picking amplification; (c) synchronized pulsed pumping. Schematic diagram of upper-state population transitions: (b) pulse-picking amplification; (d) synchronized pulsed pumping.

Figure 3 Long description
The diagram consists of four panels labeled a through d.
Panel a shows the time domain for pulse-picking amplification. A top row of three brown rectangular Pump Pulses is spaced widely apart. Below them, a continuous train of many thin pink Signal Pulses is shown, with ellipses indicating a long sequence. Only one signal pulse aligns with each pump pulse.
Panel b illustrates the upper-state population for pulse-picking. Two horizontal planes represent Excited-state (top) and Ground-state (bottom). Multiple wavy red Signal Pulses enter from the left. On the excited-state plane, many orange spheres represent a high population, with a smaller group of green spheres to the right. Large red arrows point down to the ground-state, while a green arrow points to an A S E output on the right.
Panel c shows the time domain for synchronized pulsed pumping. Three brown rectangular Pump Pulses are shown on the top row. Below, only three pink Signal Pulses exist, each perfectly synchronized in time with a corresponding pump pulse.
Panel d illustrates the upper-state population for synchronized pumping. Similar to panel b, it shows Excited-state and Ground-state planes. A single wavy red Signal Pulse enters from the left. The excited-state plane contains fewer orange spheres and a larger group of green spheres compared to panel b. Red arrows point down to the ground-state, and two green arrows point to the A S E output, indicating higher A S E compared to the signal pulses.
Theoretically, throughout the subsequent amplification stages, the specific signal pulse aligned with the pump’s falling edge undergoes sustained and highly efficient amplification. Conversely, the remaining seed pulses experience significantly minimal gain. Although these residual pulses persist within the laser system, their energy intensity differs from that of the main pulse by several orders of magnitude, rendering them virtually undetectable.
3 Experimental setup
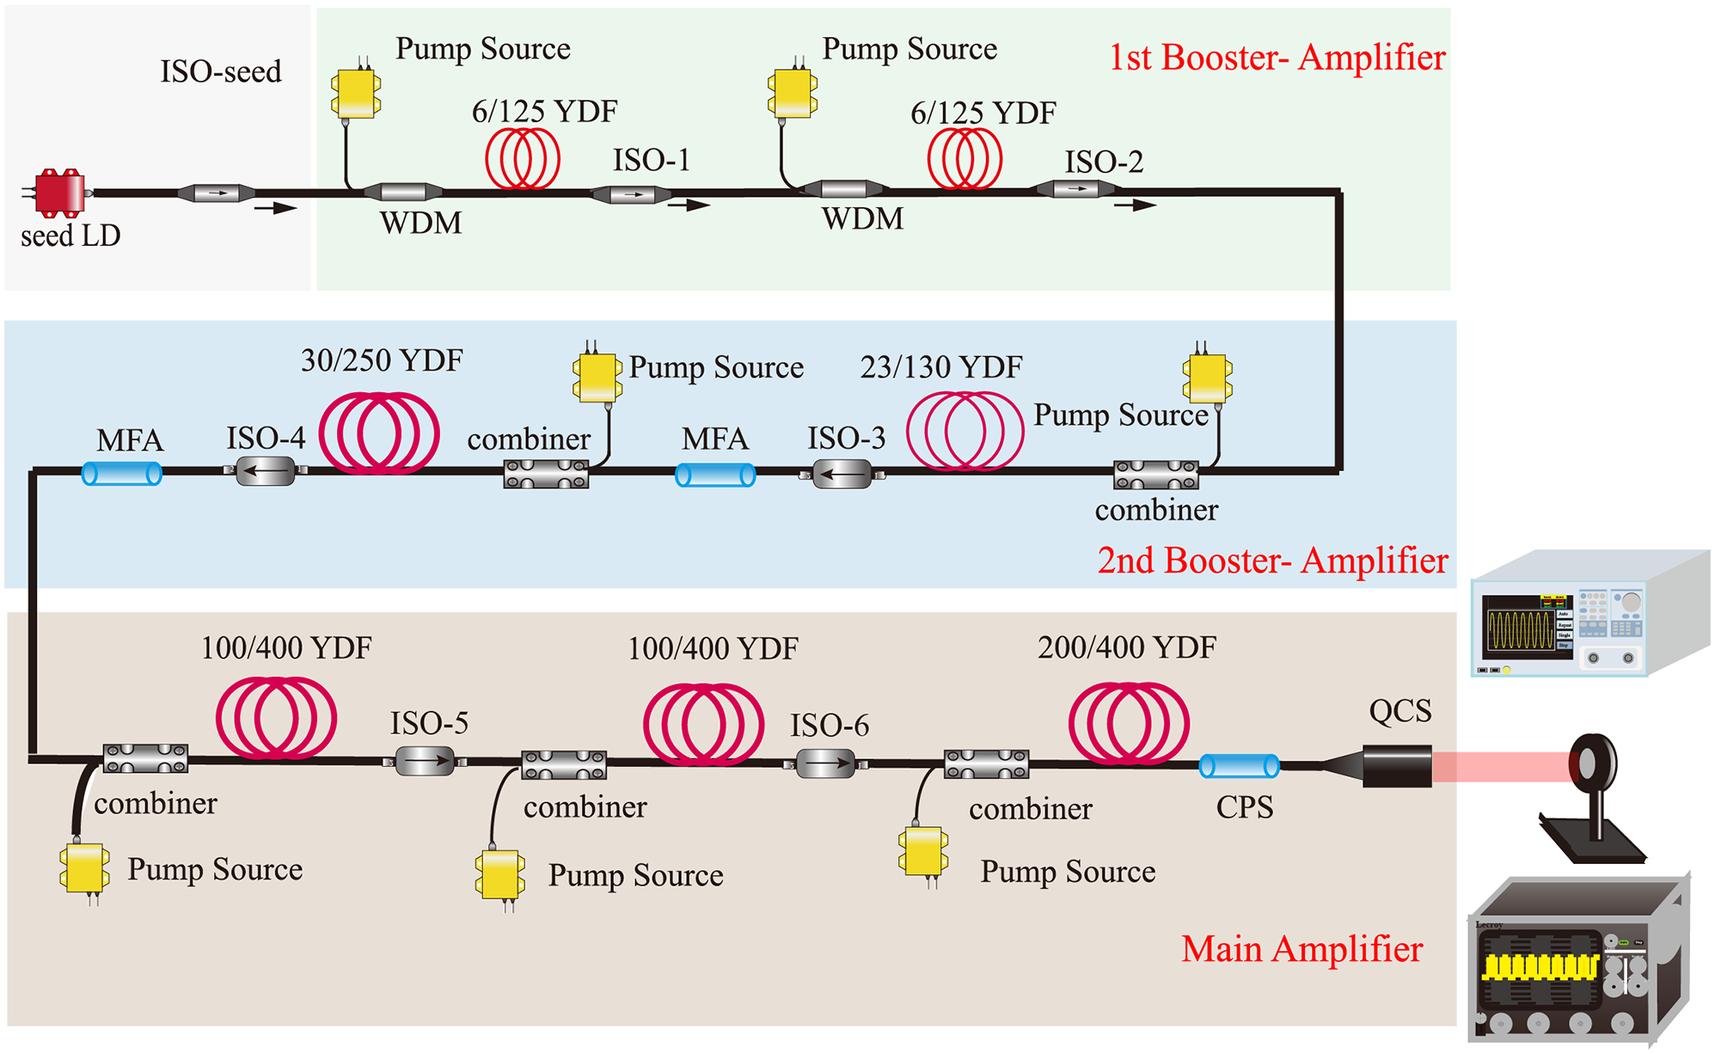
The experimental setup is shown in Figure 4. The amplification system adopted a MOPA structure, which consisted of an electric-pulse-driven LD and three primary amplification structures: the first booster amplifier consists of two single-mode fiber pre-amplifiers, the second booster amplifier comprised a 23-μm-core-diameter fiber pre-amplifier and a 30-μm-core-diameter fiber pre-amplifier, and the main amplifier incorporated two 100-μm-core-diameter M-type fiber pre-amplifiers and a 200-μm-core-diameter homemade double-clad fiber main amplifier.
Experimental setup of the high-pulse-energy fiber laser. WDM, wavelength division multiplexer; LD, laser diode; ISO-x, isolator and bandpass filter; YDF, Yb-doped fiber; MFA, mode-field adapter; CPS, cladding power stripper; QCS, quartz collimating system.

Figure 4 Long description
The schematic is organized into three horizontal colored zones representing the amplification stages.
1. Top Zone (Green): 1st Booster-Amplifier. The signal begins at a red seed L D on the far left, passing through an I S O-seed. It enters a sequence of two identical sub-units, each containing a yellow Pump Source connected to a W D M, followed by a red coiled 6/125 Y D F and an I S O-1 or I S O-2. Arrows indicate a rightward flow.
2. Middle Zone (Blue): 2nd Booster-Amplifier. The path turns downward and moves right-to-left. It consists of two sub-units. The first has a yellow Pump Source, a combiner, a red coiled 23/130 Y D F, an I S O-3, and a blue M F A. The second sub-unit follows with a Pump Source, combiner, 30/250 Y D F, I S O-4, and another blue M F A.
3. Bottom Zone (Tan): Main Amplifier. The path turns downward again and moves left-to-right. It features three sub-units. The first two include a Pump Source, combiner, 100/400 Y D F, and I S O-5 or I S O-6. The final sub-unit contains a Pump Source, combiner, and a 200/400 Y D F. The chain ends with a blue C P S and a black Q C S.
On the far right, the output beam passes through a circular lens. Two electronic monitoring devices with screens displaying waveforms are positioned at the top-right and bottom-right of the diagram.
The electric-pulse-driven LD served as the seed source, providing signal pulses with a center wavelength of 1064 nm. The peak power of the LD was about 300 mW, which produced 2.4 nJ energy in 8 ns width. The seed source allows for direct electronic modulation of the output pulse width. As is well-known, as the peak power of pulses is fixed, the energy only depends on the pulse width. Therefore, changing the repetition rate of the seed pulses does not affect its single-pulse energy. The LD output signal pulses with a rather high repetition rate of 1.3 kHz, with an interval of approximately 770 μs between two adjacent pulses. The signal pulses were firstly injected into the two single-mode gain fiber amplifiers for energy amplification. The first two stages employed identical 1.5 and 1 m 6/125 μm single-mode gain fiber separately. In each stage, a 976 nm single-mode pump with a peak power about 1 W was injected into the gain fiber through a wavelength division multiplexer (WDM) to amplify the signal pulses. After the amplification of single-mode amplifiers, signal pulses were launched into 2.3 m homemade multimode fiber with a 23-μm-diameter, 0.079 NA core and 130-μm-diameter, 0.46 NA cladding with an octagonal shape. The 976 nm pump light with 9 W peak power was injected into the 23/130 μm gain fiber through a cladding-pumped combiner for further amplification. After the third-stage amplifier, through a mode-field adapter (MFA), the signal pulses were injected into a homemade 1.8 m long multimode fiber with a 30-μm-diameter, 0.087 NA core and 250-μm-diameter, 0.46 NA cladding with an octagonal shape pumped by up to 27 W peak power at 976 nm. Subsequently, two 100 μm double-clad M-type fiber amplifier stages were implemented using 2 and 2.3 m of homemade 100/400 μm M-type YDF, respectively, pumped by a 100 W wavelength-stabilized LD at 976 nm. A 1.5-m-long homemade YDF was employed in the main amplifier, with a homemade high-absorption 200/400 μm fiber (core NA = 0.1, absorption coefficient of approximately 9.1 dB/m at 915 nm). The YDF of the final main amplifier was pumped by three 976 nm LDs with a maximum output peak power of 100 W via a (6 + 1) × 1 combiner. In the experiments, the length of the gain fiber in the main amplifier was preferred to suppress the SRS effects while ensuring sufficient absorption. A cladding power stripper (CPS) was utilized to dump the light in the cladding. Serving as the terminal output structure of the fiber laser, the quartz collimating system (QCS) expands the beam mode area to reduce the optical power density, thereby preventing catastrophic damage to the fiber facet. Furthermore, the QCS effectively mitigates ASE back-reflection. This prevents parasitic self-oscillation within the main amplification stage and effectively suppresses any further accumulation of ASE.
In this system, the MFAs were designed to reduce the welding mode loss and to minimize energy loss; the coupling efficiency of all the MFAs was greater than 98%. All isolators (ISOs) were integrated devices combining with an ISO and a bandpass filter. The filter featured a center wavelength of 1064 nm with a 10 nm passband bandwidth, while the ISO served to protect the system from damage caused by backward reflections from subsequent stages.
The seed pulse repetition rate was set to 1.3 kHz, while the pump pulses at all amplification stages operated at 10 Hz with a strict duration of 700 μs, ensuring that the targeted seed pulse is precisely synchronized with the falling edge of the pump pulse. Consequently, only the specific seed pulses corresponding to the 10 Hz frequency underwent effective amplification. Given the ultra-low repetition rate of the system, thermal accumulation was negligible. Therefore, the entire laser amplification system was simply mounted on a designed aluminum baseplate, eliminating the need for any active cooling measures such as water or forced-air cooling.
For the pulsed fiber MOPA system, the output energy, the pulse profile and the spectral evolution were the critical basis for characterizing its performance. Therefore, an energy meter (Ophir PE50-DIF-C) was applied to measure the pulse energy. A digital oscilloscope (RIGOL MSO8204) with a sampling rate of 10 GSa/s was adopted to study the pulse profile. Besides, an optical spectrum analyzer (Yokogawa AQ6374) was employed to analyze the spectral characteristics with a resolution of 0.5 nm. Notably, the straightforward ratio of pulse energy to pulse width for peak power is uniquely valid for an ideal rectangular pulse. In practice, the amplified pulse in our system deviates from the ideal rectangular form caused by gain saturation, and its calculated peak power is therefore determined by the pulse shape. Thus, the peak power mentioned in the subsequent parts of this paper was calculated according to the pulse shape to achieve the most accurate value.
4 Results and discussion
In the main amplification, the first two stages utilize M-type 100/400 μm fibers. These stages served a dual purpose: they further amplified the laser energy while, owing to the M-type fiber’s capability for mode-field expansion and mode mixing, effectively homogenized the modal energy distribution of the propagating signal. Typically, for multimode lasers, relying solely on the M 2 factor is insufficient for a comprehensive beam quality evaluation. Consequently, the beam steepness factor is introduced as a critical metric to assess the uniformity of the energy distribution. The beam steepness (Ω) is defined as the ratio of the difference between the effective area containing 10% of the peak energy (S 10%) and the effective area containing 90% of the peak energy (S 90%) to the effective area containing 10% of the peak energy. This relationship can be expressed as follows[ Reference Dickey and Lizotte 30 ]:

The value of this factor ranges from 0 to 1. A value approaching 0 indicates a highly uniform energy distribution, whereas a value closer to 1 implies a highly concentrated energy profile.
Furthermore, spatial uniformity is introduced as a vital metric to evaluate the intensity fluctuations within the central region of the homogenized beam. The spatial uniformity (
$U$
 ) is defined as the ratio of the difference between the maximum intensity (
${I}_{\mathrm{max}}$
 ) and the minimum intensity (
${I}_{\mathrm{min}}$
 ) to their sum, specifically calculated within the effective plateau area. This relationship can be expressed as follows[
Reference Dickey and Lizotte
30
]:

The value of this factor ranges from 0 to 1. A value approaching 0 indicates a highly uniform and flat energy distribution devoid of hot spots, whereas a larger value implies severe spatial modulations or intensity spikes within the beam cross-section.
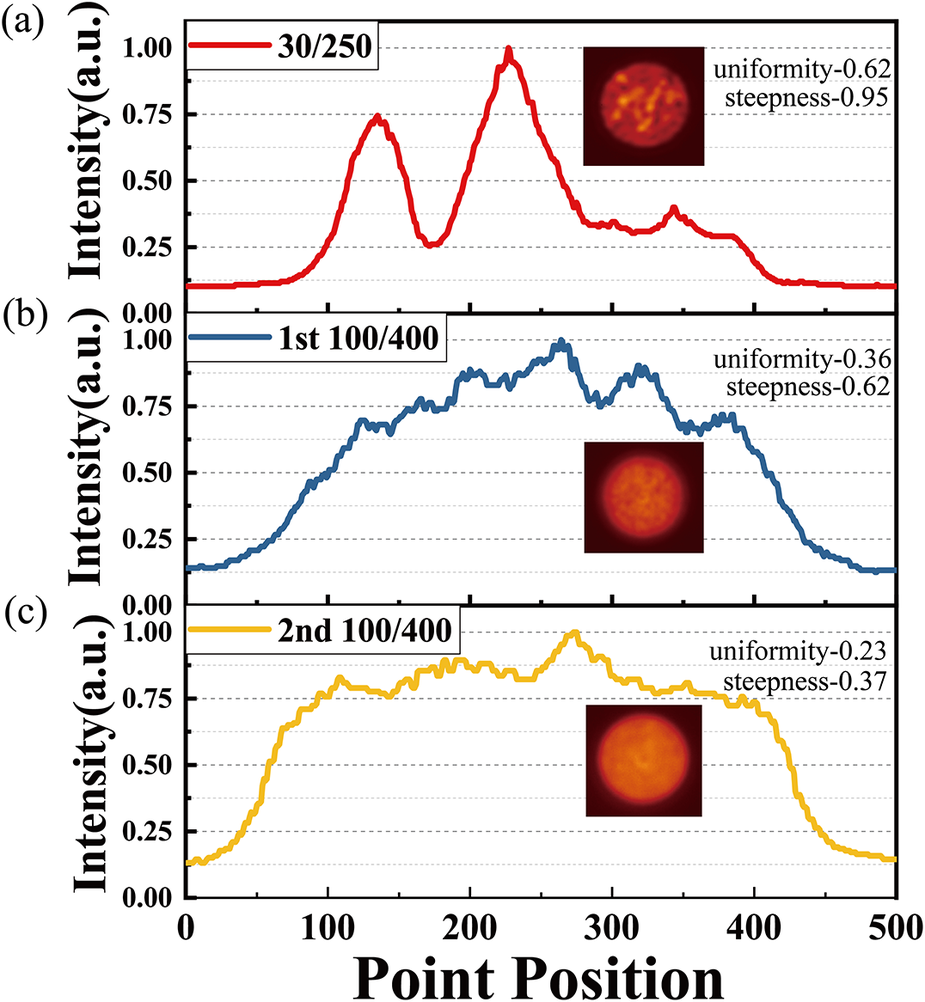
In the comprehensive evaluation of nanosecond pulsed lasers, both spatial uniformity and beam steepness are paramount metrics. Generally, a laser beam exhibiting superior spatial uniformity is highly preferred for industrial applications, as it guarantees consistent and predictable processing outcomes. Consequently, in our architecture, while beam steepness characterizes the sharpness of the boundary transition, a relatively lower edge steepness is intentionally prioritized over a perfectly steep top-hat profile. This tailored design provides natural spatial apodization, effectively suppressing the generation of Fresnel diffraction ripples and localized intensity hot spots during propagation. By doing so, it ensures the exceptional spatial uniformity required for industrial use. Furthermore, this uniform energy distribution serves as a critical prerequisite for safely seeding subsequent high-gain amplifiers, as it fundamentally prevents localized optical damage and mitigates the premature onset of nonlinear effects during high-energy extraction. To quantitatively assess the energy homogenization efficacy of the two-stage M-type fibers, we characterized the beam profiles output from both the second booster amplifier and the subsequent M-type fiber amplification stages. We calculated their central cross-sectional intensity distributions and analyzed the variations in beam steepness. The corresponding results are illustrated in Figure 5.
Analysis of beam uniformity: (a) relative intensity distribution along the radial direction of the fiber core of the 30/250 amplification stage; (b) relative intensity distribution along the radial direction of the fiber core of the first M-type 100/400 amplification stage; (c) relative intensity distribution along the radial direction of the fiber core of the second M-type 100/400 amplification stage. Inset: 2D relative intensity profiles.

Figure 5 Long description
The multi-panel graph shares a common X-axis labeled Point Position ranging from 0 to 500 and a Y-axis labeled Intensity a dot u dot ranging from 0.00 to 1.00.
Panel a: A red line for the 30 forward slash 250 stage shows two distinct sharp peaks. The first peak reaches approximately 0.75 at position 125, and the second reaches 1.00 at position 230. An inset shows a circular 2 D profile with high-contrast speckles. Text labels indicate uniformity-0.62 and steepness-0.95.
Panel b: A blue line for the 1st 100 forward slash 400 stage shows a broader, more plateau-like distribution with multiple small fluctuations. It reaches a maximum near 1.00 at position 270. The inset shows a more diffused circular profile. Text labels indicate uniformity-0.36 and steepness-0.62.
Panel c: A yellow line for the 2nd 100 forward slash 400 stage shows the flattest distribution, maintaining a high intensity between positions 100 and 400 before dropping off. The inset shows a highly uniform, glowing circular profile. Text labels indicate uniformity-0.23 and steepness-0.37.
In the beam quality characterization setup, the passive delivery fibers within the QCS were standard step-index 100/400 μm fibers. For the 30/250 amplification stage, the measurement point was positioned after the MFA to minimize fusion splice losses. Beam profile images were captured from the output of different amplification stages, and their grayscale representations were processed using MATLAB to extract relative intensity distributions. Figure 5 displays the relative intensity magnitude along the radial direction of the fiber core. Visually, the beam energy distribution prior to entering the main amplifier is highly nonuniform, characterized by multiple discrete high-intensity peaks along the radial direction. However, as the signal propagates through the main amplifier – comprising two stages of M-type 100/400 μm active fibers – a distinct homogenization of the beam energy is observable. To further quantify this improvement in uniformity, we calculated the beam steepness factor for the output at each stage. As depicted in Figure 5, the amplification structure of M-type fibers in the main amplifier significantly reduces the beam steepness from 0.95 to 0.37, resulting in a much more uniform energy distribution. The insets in Figure 5 display the two-dimensional (2D) spatial relative intensity distributions of the output beams from the respective amplification stages. These images visually corroborate the quantitative analysis, clearly demonstrating that the laser beam energy distribution becomes significantly more uniform following amplification through the two stages of M-type 100/400 fibers.
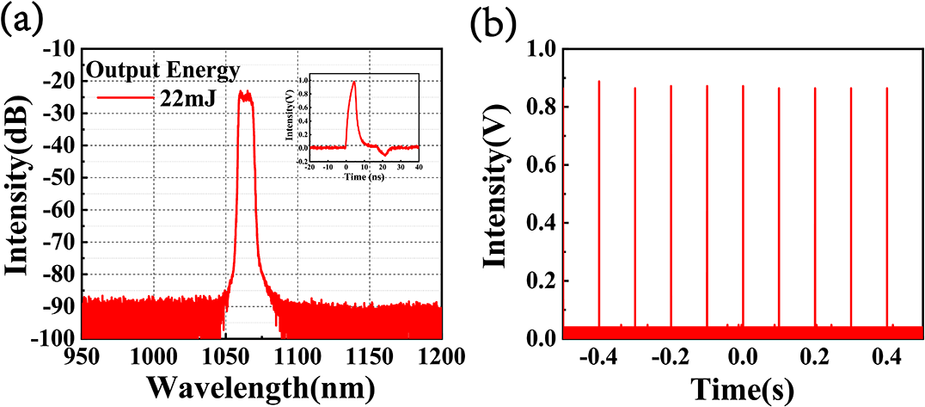
The peak power of the electric-pulse-driven LD seed was fixed at 300 mW. Therefore, changing the seed pulse width affected the output energy directly. In this study, the seed pulse width was set to 8 ns with a pulse energy of 2.4 nJ. After the first booster amplifier, the output energy reached 6 μJ, and after the second booster amplifier, the output energy increased to 800 μJ. Subsequently, the signal was amplified to 22 mJ through the two 100/400 μm fiber amplification stages. As shown in Figure 6(a), owing to the superior filtering performance of ISO-6 and effective ASE suppression in the pre-amplification stages, the signal exhibits a spectral signal-to-noise ratio (SNR) exceeding 65 dB at the output energy of 22 mJ of the second 100/400 μm fiber amplifier, making it suitable for final energy amplification. The inset of Figure 6(a) shows the input pulse shape of the last amplifier, which shows a deformation from the seed pulse mainly coming from the gain saturation in the pre-amplifier stages. As the amplification reaches the saturation energy of the power amplifier, the leading edge of the pulse depletes the gain and there is no amplification left for the remaining part of the pulse. Figure 6(b) shows the corresponding temporal pulse profile of 10 Hz. Despite a seed frequency of 1.3 kHz, only the 10 Hz pulse train could be effectively amplified during subsequent stages through precise control of the pump pulse repetition rate. The non-amplified seed pulses were attenuated within the pre-amplification stages and thus did not affect the final energy amplification.
The output performance of the second 100/400 μm amplifier. (a) Spectrum of the signal pulse. Inset: pulse shape with an FWHM of 5.6 ns. (b) Temporal profile of the signal pulse at 10 Hz.

Figure 6 Long description
The figure consists of two panels labeled a and b.
Panel a is a line graph showing Intensity in d B on the y-axis from negative 100 to negative 10, and Wavelength in n m on the x-axis from 950 to 1200. A sharp red peak is centered at approximately 1064 n m, rising from a noise floor of negative 90 d B to a flat-topped peak at negative 25 d B. A legend in the top left indicates Output Energy is 22 m J.
An inset graph in the top right of panel a shows a temporal pulse shape. The y-axis is Intensity in V from negative 0.2 to 1.0, and the x-axis is Time in n s from negative 20 to 40. The red curve shows a sharp rise to a peak at approximately 5 n s followed by a rapid decay with a small undershoot.
Panel b is a line graph showing the temporal profile. The y-axis is Intensity in V from 0.0 to 1.0, and the x-axis is Time in s from negative 0.5 to 0.5. The data consists of a series of ten equally spaced, narrow red vertical spikes of uniform height reaching approximately 0.9 V, representing a 10 H z pulse train.
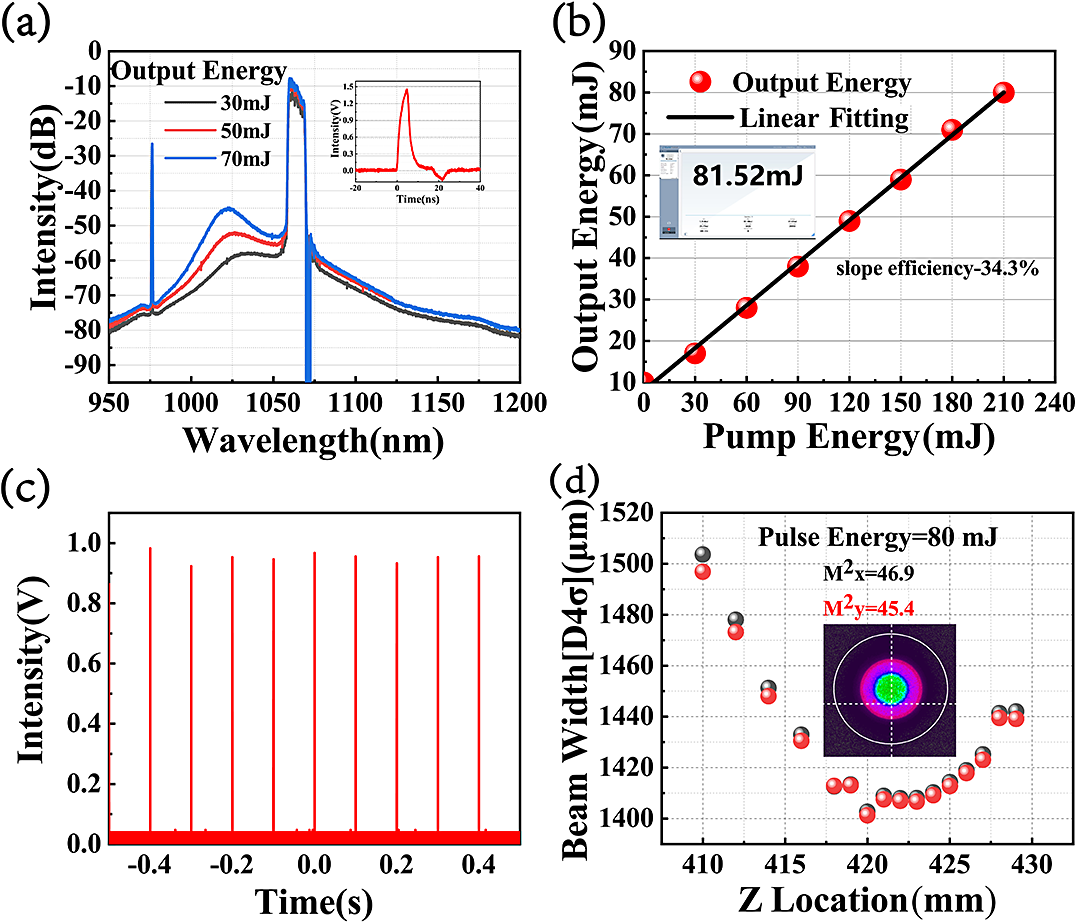
To further scale the pulse energy, a high-absorption 200/400 μm fiber was employed in the final stage of the main amplifier, which allowed for a significantly minimized active fiber length. This design strategy effectively suppressed nonlinear effects while simultaneously ensuring high energy conversion efficiency. The spectrum of the output pulse is shown in Figure 6(a). The center wavelength was located at 1064 nm with a full width at half maximum (FWHM) of 10 nm, which depended on the bandpass wavelength of the filter in ISO-6. As shown in Figure 7(a), the output spectra at pulse energies of 30, 50 and 70 mJ are presented. As the output energy increased, the relative intensity of ASE within the system grew correspondingly, leading to a lower SNR that ultimately limited further power scaling. It is evident that, despite the implementation of spectral filtering after each stage and the adoption of the pulse-picking amplification scheme, ASE remains the primary constraint limiting further energy scaling in the final LMA amplification stage. This limitation can be attributed to the incomplete spatial overlap between the signal mode and the extensive doped region of the LMA fiber. Specifically, the fundamental signal mode fails to fully saturate the entire active doped cross-section. Consequently, upon pump injection, the doped regions at the periphery of the core, where signal intensity is low, would preferentially generate and amplify ASE. This phenomenon represents an inherent limitation imposed by the geometric structure of conventional LMA fibers. Furthermore, benefiting from the beam energy homogenization provided by the M-type fibers in the main amplifier, the high SNR of the input signal pulses and the utilization of LMA fiber of the final energy amplifier, no significant SRS components were observed in the output spectrum. The inset in Figure 7(a) displays the pulse profile from the final amplification stage. Compared to the input pulse shape, little pulse distortion could be observed in the last amplifier stage. Figure 7(b) illustrates the linear relationship between output energy and pump energy. At the pump energy of 210 mJ, the output energy reached 80 mJ with a corresponding slope efficiency of approximately 34.3%. The output energy maintained a strong positive linear correlation with pump energy, with no sign of energy roll-off observed even at maximum pump power. This indicates that by optimizing the pump configuration to deliver higher pump energy, further scaling of output pulse energy can be anticipated. The temporal profile of the final output pulses is shown in Figure 7(c), demonstrating stable operation at 10 Hz. Figure 7(d) depicts the beam quality M 2 factor and beam shape of the laser system at 80 mJ. Benefiting from the implementation of the M-type fibers and LMA gain fiber of the main amplifier, the final output beam exhibits a well-defined and well-distributed spatial profile.
The output performance of the final energy amplifier. (a) Spectra of the signal pulse at the energy of 30, 50 and 70 mJ. Inset: pulse shape with an FWHM of 5.2 ns. (b) Pulse energy achieved as a function of pump energy. Inset: pulse energy data recorded by an Ophir energy meter PE50-DIF0C. (c) Temporal profile of the signal pulse at 10 Hz. (d) Beam quality at the maximum output energy of 80 mJ.

Figure 7 Long description
Panel a is a line graph of Intensity in d B versus Wavelength in n m from 950 to 1200. Three curves represent output energies of 30, 50, and 70 m J, showing a primary peak near 1064 n m and a secondary broad peak around 1030 n m. An inset shows a temporal pulse shape with a F W H M of 5.2 n s. Panel b is a scatter plot with a linear fitting line showing Output Energy in m J versus Pump Energy in m J. Red circular data points follow a linear increase from 10 to 80 m J with a slope efficiency of 34.3 percent. An inset shows a digital display reading 81.52 m J. Panel c is a temporal profile showing Intensity in V versus Time in s from minus 0.5 to 0.5, displaying a stable train of ten equidistant sharp pulses at 10 H z. Panel d is a scatter plot of Beam Width D 4 sigma in micrometers versus Z Location in m m. Black and red dots represent x and y axes, showing a parabolic caustic curve with a minimum near 1400 micrometers at a Z location of 420 m m. Text indicates M super 2 x equals 46.9 and M super 2 y equals 45.4 at 80 m J. An inset shows a circular multi-colored beam profile image.
5 Conclusion
In conclusion, we have demonstrated a high-energy high-peak-power all-fiber laser system capable of delivering output pulses with an energy of 81 mJ, a duration of approximately 5 ns and a peak power of 12.1 MW at 10 Hz. The system was seeded by an LD driven by electrical pulses at 1.3 kHz. In this work, a pulse-picking amplification scheme was implemented, wherein the seed signal is selectively amplified by pump pulses operating at a repetition rate of 10 Hz. Through this approach, combined with the deployment of bandpass filters at each stage, ASE within the system was effectively suppressed. Furthermore, two stages of M-type fibers were incorporated into the main amplifier to boost pulse energy while simultaneously homogenizing the beam energy distribution. Benefiting from the utilization of high-absorption LMA fibers in the final amplification stage and the high degree of beam uniformity, exceptional suppression of nonlinear effects was achieved, with no SRS components observed in the output spectrum. Featuring its advantages of high integration, robustness and flexible delivery capabilities, this laser system is poised to open new avenues for the deployment of fiber lasers in demanding applications such as industrial machining and smart manufacturing.
Acknowledgements
This work was supported by the National Key Research and Development Program of China (No. 2023YFB4604502).

 Open access

