I. INTRODUCTION
Lead-free piezoceramics have attracted wide interest in recent years due to upcoming environmental and health concerns against the widely used lead-based piezoceramics.Reference Rödel, Jo, Seifert, Anton, Granzow and Damjanovic1–Reference Aksel and Jones3 Bi1/2Na1/2TiO3 (BNT)-based compositions are of particular interest for application due to relatively easy processing compared to K0.5Na0.5NbO3 (KNN)-based lead-free ceramics. Since the piezoelectric properties and strain under electric field of pure BNT are poor (d 33 ∼70 pC/N,Reference Jaffe, Cook and Jaffe4 unipolar strain S ∼0.1% at 8 kV/mmReference Kounga, Zhang, Jo, Granzow and Rödel5), modifications are commonly made, e.g., with BaTiO3 (BT),Reference Takenaka, Maruyama and Sakata6 Bi1/2K1/2TiO3 (BKT),Reference Elkechai, Manier and Mercurio7, Reference Sasaki, Chiba, Mamiya and Otsuki8 KNN,Reference Kounga, Zhang, Jo, Granzow and Rödel5 or combinations of these systems like BNT–BKT–BT,Reference Nagata, Yoshida, Makiuchi and Takenaka9 BNT–BT–KNN,Reference Zhang, Kounga, Aulbach, Ehrenberg and Rödel10 or BNT–BKT–KNNReference Seifert, Jo and Rödel11 to improve properties. Among those, (1 − y)((1 − x)BNT–xBKT)–yKNN ((BNT–xBKT)–yKNN) ceramics have recently shown promising electrical properties both at and off the morphotropic phase boundary (MPB) at x = 0.2 of the basic system BNT–xBKT.Reference Seifert, Jo and Rödel11–Reference Anton, Jo, Trodahl, Damjanovic and Rödel13
The room temperature (RT) structure of the binary system BNT–xBKT has been widely studied. Like all the other mentioned compositions, it crystallizes in a distorted perovskite structure. Jones et al.Reference Jones, Kreisel and Thomas14 performed x-ray diffraction (XRD) and neutron diffraction on BNT–xBKT single crystals and found a transition from rhombohedral R3c phase with a −a −a − oxygen octahedral antiphase tilting (Glazer notationReference Glazer15) to a nontilted R3m phase at x = 0.45. They reported another transition at x = 0.7 from the R3m phase to a tetragonal P4mm phase without octahedral tilting. Most studies on polycrystals, however, report a transition from rhombohedral to tetragonal phase with a phase coexistence around x = 0.2.Reference Sasaki, Chiba, Mamiya and Otsuki8, Reference Zhao, Zhou, Yan and Liu16–Reference Otonicar, Skapin, Spreitzer and Suvorov18
Transmission electron microscopy (TEM) studies on several lead-free systems containing BNT–BKT revealed the presence of both types of superstructure reflections (SSRs), namely ½{ooo} and ½{ooe}, where o means odd and e even Miller indices.Reference Tai, Choy and Chan19–Reference Otonicar, Skapin and Jancar21 According to Woodward and Reaney,Reference Woodward and Reaney22 observed SSRs were attributed to the presence of antiphase octahedral tilting a−a−a− and in-phase octahedral tilting a 0a 0c + (Glazer notationReference Glazer15), respectively. A TEM investigation of the BNT–xBKT system by Otonicar et al.Reference Otonicar, Skapin and Jancar21 reported a gradual change in intensity of the SSRs with BKT content. Pure BNT and specimen with low BKT content (x = 0.1 and 0.15) exhibited ½{ooo} SSRs. The MPB composition was determined to be 0.2BKT containing predominantly ½{ooe} SSR. Samples with increasing BKT content displayed only ½{ooe} SSR with decreasing intensity. Superlattice reflections allowed for the assignment of P4bm space group symmetry.
Recently, indications for a nonrhombohedral structure of BNT were found and the monoclinic space group Cc was assigned to pure BNTReference Gorfman and Thomas23, Reference Aksel, Forrester, Jones, Thomas, Page and Suchomel24 and to BNT–xBKTReference Levin, Reaney, Anton, Jo, Rödel, Pokorny, Schmitt, Kleebe, Hinterstein, Trodahl and Jones25 for x < 0.2. Temperature-dependent structural studies on BNT–xBKT revealed a transition from the RT structure to a coexistence of the RT and tetragonal phases around 130 °C, to a tetragonal phase around 330 °C, and to a cubic phase at approximately 700 °C for 0.1< x < 0.6.Reference Jones, Kreisel and Thomas14
The structure of the ternary system BNT–BKT–KNN has not been investigated in detail. Yao et al.Reference Yao, Liu, Chen and Cao26 performed RT XRD on BNT–xBKT–0.03KNN and reported a MPB between rhombohedral and tetragonal structures around x = 0.2. Singh and ChatterjeeReference Singh and Chatterjee12 investigated (1 − x − y)BNT–xBKT–yKNN using the same methods and proposed a phase transition (PT) from an assumed phase coexistence of rhombohedral and tetragonal structure to cubic at y = 0.1 for x = 0.17 and y = 0.08 for x = 0.20. In a previous paper,Reference Anton, Jo, Trodahl, Damjanovic and Rödel13 we reported the electrical properties, Raman spectra, and laboratory XRD results at RT of the system (BNT–xBKT)–yKNN (x; y) and suggested a MPB connecting (0.2; 0), (0.2; 0.02), and (0.1; 0.05) compositions. However, final evidence could not be provided with the previously used methods. Note that all presented studies were performed on unpoled samples or powders, including the present work. Structural investigations on poled samples, e.g., in BNT–BT,Reference Jo, Daniels, Jones, Tan, Thomas, Damjanovic and Rödel27, Reference Wylie-van Eerd, Damjanovic, Klein, Setter and Trodahl28 have been shown to provide different results.
This paper seeks to clarify the crystallographic structure and microstructure of (BNT–xBKT)–yKNN near the MPB using the combination of TEM, synchrotron XRD, and neutron diffraction. Temperature-dependent structural studies were also performed on these compositions by means of synchrotron XRD and Raman spectroscopy.
II. EXPERIMENTAL PROCEDURE
(BNT–xBKT)–yKNN (x; y) ceramics with x = 0.1, 0.2, and 0.4 and y = 0, 0.02, and 0.05 were prepared by the conventional solid-state reaction method. Starting powders Bi2O3 (99.975%), Na2CO3 (99.5%), K2CO3, (99.0%), TiO2 (99.9%), and Nb2O5(99.9%) (all Alfa Aesar, Ward Hill, MA) were weighed according to the respective stoichiometry. The powder mixture was milled in ethanol for 24 h at 250 rpm and calcined at 800 °C for 5 h. Disk-shaped samples were pressed and sintered at 1080 °C for 3 h. Details of the powder and sample preparation can be found elsewhere.Reference Anton, Jo, Trodahl, Damjanovic and Rödel13
TEM samples were prepared by polishing the sintered samples down to approximately 120 μm thickness. Disks with a diameter of 3 mm were ultrasonically cut and mechanically dimpled. The specimen were thermally annealed at 400 °C to remove any residual strain introduced during mechanical treatment followed by Ar+ ion thinning. To prevent charging under the incident beam, samples were coated with a thin carbon layer. The experiments were carried out on a FEI CM20 (FEI, Eindhoven, Netherlands) microscope operating at 200 kV using a double tilt holder. Several representative grains of each specimen were investigated along the [100]c, [110]c, [111]c, and [310]c zone axis, where c denotes cubic indexing. The program for interpreting electron diffraction patterns (PIEP)Reference Miehe29 was used for determination of the orientation matrix. To image the SSRs, the selected area electron diffraction (SAED) patterns were overexposed.
Temperature-dependent XRD measurements were carried out at beamline 11-BM of the Advanced Photon Source at Argonne National Laboratory. To prepare powder samples, the sintered pellets were crushed and annealed at 400 °C for 1 h in closed alumina crucibles. The powder was loosely packed in quartz capillaries with a diameter of 0.7 mm, which were rotated at 60 Hz throughout the measurements to improve crystallite averaging. Samples were heated from RT to 500 °C at a rate of 5 °C/min using a hot gas blower. XRD patterns were collected with a monochromatic x-ray beam with a wave length of 0.41395 Å, which was refined using a LaB6 standard. Each pattern was measured in the angular range of 2θ = 0.5–24° with a step size of 0.002° using a scintillator-based multicrystal analyzer detector. Crystallographic refinements were completed with the XRD patterns using the Rietveld method in the software package FullProf.Reference Roisnel and Rodriguez-Carvajal30
RT neutron diffraction measurements were carried out at the D20 beamline of the institute Laue-Langevin. Three wave lengths were utilized to maximize information: 1.12 Å for a large Q-range, 2.41 Å for high resolution of low indexed reflections, and 1.54 Å as an intermediate wave length. Crystallographic refinements were performed using the Rietveld method for each composition with the same structure model for all three wave lengths. Hence, lattice and strain parameters were constrained.
Raman spectra were collected using 488 nm excitation with a Jobin-Yvon LabRam HR800 (Horiba, Kyoto, Japan). Samples were heated from RT to 500 °C with a heating rate of 4 °C/min using a variable-temperature stage (THMS-600, Linkam Scientific Instruments, Tadworth, UK). The spectra were fitted in a selected frequency range with four Lorentzian lines using the software Origin (OriginLab, vers. 7.5).
III. RESULTS
A. RT structure
1. Transmission electron microscopy
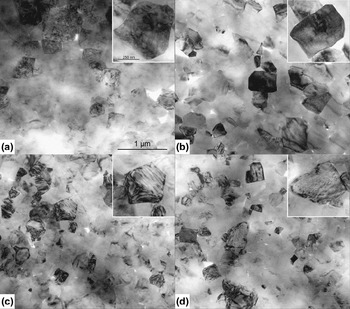
In Fig. 1, TEM bright field (BF) images of pure BNT–xBKT and KNN containing specimen are depicted. For BNT–0.2BKT (0.2; 0) [Fig. 1(a)], different types of contrast were observed. A high concentration of irregular domains, deviating from the permissible {110} and {100} twinning planes,Reference Fousek and Janovec31 were found. Some grains exhibited a granular contrast. Comparable morphologies were reported for lanthanum-doped Pb(Zr, Ti)O3 (PZT) ceramics, belonging to relaxor-type ferroelectrics.Reference Dai, Xu, Li and Viehland32 Lamellar domains, following permissible twinning planes, were observed rarely for this composition belonging to the MPB. Note that the contrast visible in Fig. 1 is orientation dependent. Grains that appear homogenous can change in contrast due to tilting.
BF images of (a) BNT–0.2BKT, (b) (BNT–0.2BKT)–0.02KNN, (c) BNT–0.4BKT, and (d) (BNT–0.4BKT)–0.05KNN. The insets show enlarged grains of the respective composition. Scale bars are the same for all main figures and all insets, respectively.

The BF image of the (0.2; 0.02) [Fig. 1(b)] and (0.2; 0.05) (not shown) compositions also display a granular contrast without any domain structure. The sample with higher BKT content without KNN (0.4; 0) [Fig. 1(c)] clearly shows a lamellar domain structure. In the (0.4; 0.02) composition (not provided), there are a larger number of domains with respect to the composition without KNN. With further increasing KNN content in the composition (0.4; 0.05) [Fig. 1(d)], domains are only rarely observed. Thus, increasing KNN content reduces the number of domains in the BNT–BKT–KNN system due to reduced lattice distortion.
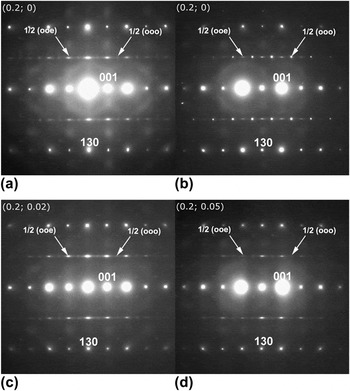
Figure 2 presents the SAED patterns of the <310>c (c: cubic indexing) zone for pure BNT–0.2BKT and compositions with different KNN contents. Composition of (0.2; 0) [Figs. 2(a) and 2(b)] features a distinct variation in intensity of SSRs, consistent with the contrast variation observed in BF. For this specific composition, grains exhibited ½{ooo} and ½{ooe} SSRs, which could be of equal, lower, or higher intensity than their counterpart. The ½{ooe} SSRs are elongated along the [001] direction, which could be caused by twin boundaries or tilting disorder along one specific direction.Reference Levin, Reaney, Anton, Jo, Rödel, Pokorny, Schmitt, Kleebe, Hinterstein, Trodahl and Jones25 The origin of diffuse streaks observed in electron diffraction patterns was attributed to a small amount of adjacent atoms displaced from their original position by Honjo et al.Reference Honjo, Kodera and Kitamura33 Streaking was also observed in XRD patterns and assigned to the existence of planar defects.Reference Welberry34, Reference Daniels, Jo, Rodel, Rytz and Donner35 Accordingly, defect-containing planes could be specified as {001}-planes. With KNN addition [Figs. 2(c) and 2(d)], both types of SSRs are still present though a decrease in intensity of ½{ooo} SSRs can be noticed.
SAED pattern of the <310>c zone for (a) (0.2; 0) revealing strong ½{ooe} and weak ½{ooo} SSRs, (b) SAED pattern for the same (0.2; 0) composition also revealing both SSRs, but with inverse intensities. SAED patterns for (c) (0.2; 0.02) and (d) (0.2; 0.05) reveal strong ½{ooe} and weak ½{ooo} SSRs.

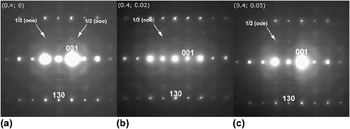
Composition (0.4; 0) shows weak ½{ooe} and very weak ½{ooo} SSRs [Fig. 3(a)], suggesting that incorporation of large K+ ions suppresses the tilting of oxygen octahedra.Reference Jeong, Park, Kim, Kim, Moon, Kim and Ahn36 For the KNN containing compositions, only weak ½{ooe} SSRs are visible [Figs. 3(b) and 3(c)]. The ½{ooe} SSRs show the same streaking as observed for the compositions with x = 0.2.
SAED patterns of the <310>c zone for (a) (0.4; 0) revealing both ½{ooo} and ½{ooe} SSRs. In the SAED patterns for (b) (0.4; 0.02) and (c) (0.4; 0.05), only ½{ooe} SSR is observed.

Reflection splitting is not observed for the compositions with x = 0.2 or the (0.4; 0.05) composition. For the compositions (0.4; 0) and (0.4; 0.02), reflections are split indicating the presence of 90° a–c and 90° a–a domain configurations, respectively (images along the [100]c zone are not shown here). Note that 90° a–c and 90° a–a configurations only differ in viewing direction. The c/a ratio for the composition (0.4; 0) was determined from reflection splitting viewed along the [100]c zone axis and calculated to 1.021 ± 0.003, while for (0.4; 0.02), it was 1.017 ± 0.002.
2. XRD and neutron diffraction
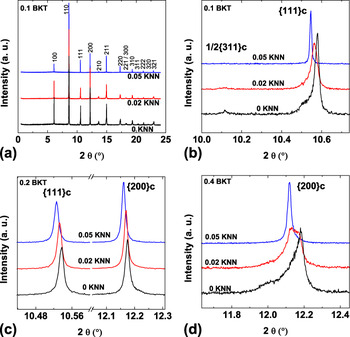
RT XRD patterns are shown in Fig. 4. The entire 2θ range is only displayed for (BNT–0.1BKT)–yKNN compositions [Fig. 4(a)] since all the patterns have a perovskite structure without traces of an impurity phase and look very similar in the overview. Magnified reflections nevertheless reveal differences between the structures of the investigated compositions. For example, the {111}c reflection is split and the ½{311}c SSR is present for the (0.1; 0) and (0.1; 0.02) compositions. These results are consistent with a R3c or Cc structure. It was shown that the monoclinic Cc space group is a better representation for the structure of BNT because peak splitting and asymmetries could not be represented with a R3c model.Reference Gorfman and Thomas23, Reference Aksel, Forrester, Jones, Thomas, Page and Suchomel24, Reference Aksel, Forrester, Kowalski, Jones and Thomas37 For the more complex BNT–BKT–(KNN) system, final evidence for the Cc space group cannot be found in XRD due to broader reflections as compared to pure BNT or in the neutron diffraction data, which does not provide a high enough resolution for the subtle asymmetries evidencing Cc space group. However, other property data and analytical techniques have suggested that the sequence of phase transformations is the same in BNT as in BNT modified with small amounts of BKT and KNN. For instance, Raman spectra for BNT and BNT–BKT with a low BKT content of 12 mol% are nearly identicalReference Xie, Jin, Shen, Wang and Shen38 and the same is true for the spectra of the compositions of (0.1; 0) and (0.1; 0.02).Reference Anton, Jo, Trodahl, Damjanovic and Rödel13 This may imply that materials in this region of the phase diagram exhibit the same structure as unmodified BNT, which has been reported as the Cc space group. Moreover, comparing the dielectric properties of BNTReference Aksel, Forrester, Kowalski, Deluca, Damjanovic and Jones39 with those of BNT–0.1BKT,Reference Anton, Jo, Damjanovic and Rödel40 it is apparent that these materials follow the same sequence of PTs, even though the transition temperatures are shifted slightly with composition. Additional similarities between the temperature-dependent properties of BNT and BNT–0.1BKT can also be found in the piezoelectric coefficient d 33.Reference Anton, Jo, Damjanovic and Rödel40, Reference Davies, Aksel and Jones41 Thus, the Cc space group can be assigned to the compositions of (0.1; 0) and (0.1; 0.02) in this paper.
Room temperature XRD patterns. (a) The entire 2θ range for (BNT–0.1BKT)–yKNN and (b) a selected 2θ range to magnify the ½{311}c and {111}c reflections. (c) A selected 2θ range for (BNT–0.2BKT)–yKNN to show the {111}c and {200}c reflections and (d) for (BNT–0.4BKT)–yKNN to enlarge the {200}c reflections.

The composition with higher KNN content (0.1; 0.05) does not reveal any split of the {111}c reflection or a SSR. The patterns for the compositions with x = 0.2 do not show any apparent split of the {111}c or {200}c reflection but a slight broadening, which decreases with increasing KNN content. This is consistent with the absence of reflection splitting in SAED images. The {200}c reflection is split for the (0.4; 0) and (0.4; 0.02) compositions, and shoulders indicate a noncubic structure also for the higher KNN content (0.4; 0.05) composition.
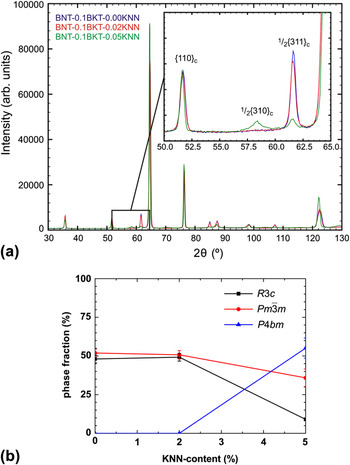
Neutron diffraction was performed on the (0.1; 0), (0.1; 0.02), and (0.1; 0.05) compositions. Figure 5(a) provides a plot of the high-resolution measurements of the three compositions. The inset highlights the ½{310}c and ½{311}c SSRs. With increasing KNN content, the intensity of the ½{311}c SSR decreases. For a KNN content of 5 mol%, additionally, a ½{310}c SSR appears. With a combined refinement of the measurements with 1.12, 1.54, and 2.41 Å wave lengths of the three compositions, these observations can be quantified. Figure 5(b) displays the phase fractions as function of KNN content. With increasing KNN content, the phase fraction of the pseudocubic phase decreases monotonically.
a) Room temperature neutron diffraction pattern and (b) phase fractions for (BNT–0.1BKT)–yKNN.

For a KNN content of 5 mol%, a phase coexistence of tetragonal P4bm and monoclinic Cc phases is hypothesized. The pseudocubic phase  $Pm\bar 3m$ is introduced for a representation of the unit cells, which are only slightly and locally distorted, but do not actually possess an ideal cubic symmetry.Reference Aksel, Forrester, Kowalski, Jones and Thomas37 A refinement with the phases Cc + P4bm +
 $Pm\bar 3m$ did not converge due to the high number of degrees of freedom, thus Cc was replaced by the R3c space group. The tetragonal phase is the main phase in this composition with the lattice distortion decreasing with increasing KNN content. This is in agreement with TEM observations, where an increasing KNN content suppresses the development of domain structures.
The spontaneous polarization Ps can be estimated with the cell parameters and the atomic positions by the dipole moment equation:
 $${\bf P}_{\rm{s}} = (1/V)\sum\nolimits_i {q_i {\bf{r}}_i ,} $$
where the summation is over the point charges qi at positions ri in a primitive cell volume V.Reference Frantti, Ivanov, Eriksson, Rundlöf, Lantto, Lappalainen and Kakihana42
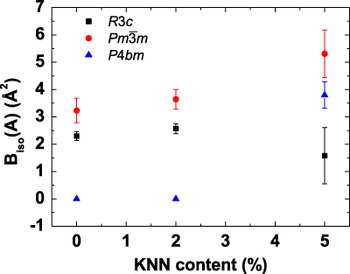
The spontaneous polarization of the refined tetragonal phase is very weak (3.9 μC/cm2) in comparison to the spontaneous polarization of the refined rhombohedral phases (34.0–41.1 μC/cm2). For the system BNT–BT–KNN, a similar coexistence of a ferroelectric active and a nonpolar phase was observed by Hinterstein et al.Reference Hinterstein, Knapp, Holzel, Jo, Cervellino, Ehrenberg and Fuess43 and Schmitt et al.Reference Schmitt, Hinterstein, Kleebe and Fuess44 An analysis of the isotropic displacement parameters of the A-site cations (Fig. 6) provides that with increasing KNN content, the values increase significantly. This indicates a local disorder of static displacements, which is a common observation for relaxor ferroelectrics.Reference Peng and Bursill45–Reference Maier, Angel, Marshall, Mihailova, Paulmann, Engel, Gospodinov, Welsch, Petrova and Bismayer47
Biso of the A-site cations for (BNT–0.1BKT)–yKNN.

3. Raman
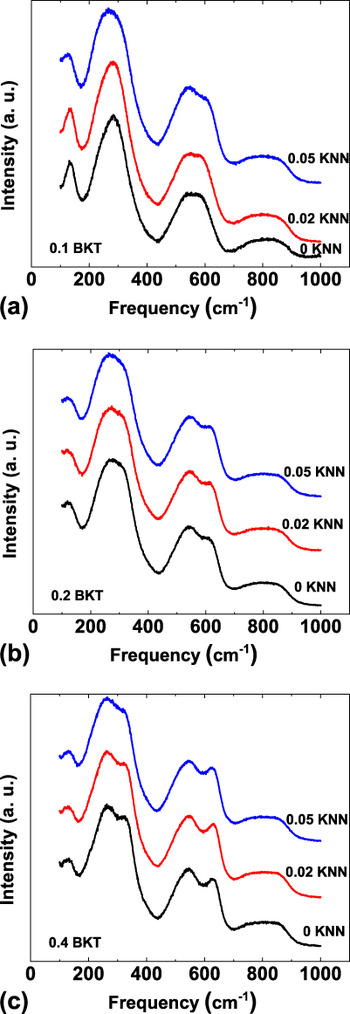
RT Raman spectra of the (BNT–xBKT)–yKNN system were already investigated in a previous paperReference Anton, Jo, Trodahl, Damjanovic and Rödel13 but results were only provided for the compositions with x = 0.1. Figure 7 presents the RT Raman spectra for x = 0.1, 0.2, and 0.4. There is no significant difference between the spectra of different KNN contents for x = 0.2 and 0.4. The spectra of the compositions (0.1; 0) and (0.1; 0.02) are also very similar to each other, but the composition with 5 mol% KNN (0.1; 0.05) differs from those with lower KNN concentrations in agreement with XRD and neutron diffraction results. The Raman mode close to the frequency of 300 cm−1 is broadened and softened, which means shifted to lower frequencies, compared to the same mode for the lower KNN content compositions. The mode at 600 cm−1 is shifted to higher frequencies in the composition with 5 mol% KNN. The Raman spectrum of the composition (0.1; 0.05) thus shows more similarities with the spectra of the compositions with x = 0.2.
Room temperature Raman spectra for (a) (BNT–0.1BKT)–yKNN, (b) (BNT–0.2BKT)–yKNN, and (c) (BNT–0.4BKT)–yKNN.

B. Temperature-dependent structural evolution
1. X-ray diffraction
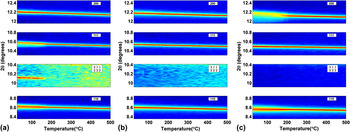
In Fig. 8, the temperature-dependent evolution of selected XRD reflections is shown. For the composition (0.1; 0), the patterns change clearly around 180 °C, i.e., the split of the {111}c reflection and the SSR ½{311}c vanish. For the MPB composition (0.2; 0), there is no visible change in the XRD patterns throughout the investigated temperature regime up to 500 °C. The {200}c reflection of the (0.4; 0) composition loses the pronounced split around 200 °C. All compositions show the expected shift of the reflections to lower 2θ upon heating due to thermal expansion. The thermal evolutions of the XRD patterns of the other investigated compositions are all similar to one of the patterns presented. The temperature-dependent changes of the XRD patterns of the (0.1; 0.02) composition (not shown) demonstrate the same characteristics as those of the (0.1; 0) composition; the changes of the (0.4, 0.02) composition (not shown) resemble those of the (0.4; 0) composition. All the other compositions do not reveal any discontinuous changes from RT up to 500 °C as observed for (0.2; 0).
Temperature-dependent evolution of the XRD reflections {110}c, {002}c, {111}c, and the SSR ½{311}c for (a) BNT–0.1BKT, (b) BNT–0.2BKT, and (c) BNT–0.4BKT.

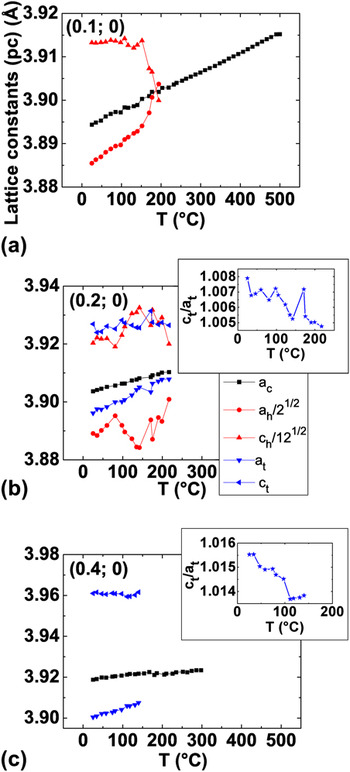
In Fig. 9, the respective pseudocubic lattice parameters are provided as obtained by Rietveld refinement. For the structural model of (0.1; 0), a combination of a pseudocubic  $Pm\bar 3m$ and a rhombohedral R3c phase was used, for which a hexagonal unit cell was chosen. The Cc space group in combination with a pseudocubic phase is believed to be a better representation of the real structure but did not converge due to the high number of degrees of freedom. When the sample (0.1; 0) is heated, the pseudocubic lattice constants of the hexagonal cell change rapidly around 170 °C. Above 200 °C, they are both approximately equal to the lattice constants of the pseudocubic phase when the rhombohedral phase fraction vanishes in the refinements.
Refined pseudocubic lattice constants for (a) BNT–0.1BKT, (b) BNT–0.2BKT, and (c) BNT–0.4BKT. The insets show the c/a ratio of the tetragonal phase.

For the (0.2; 0) composition, a combined structural model of a tetragonal P4mm, a rhombohedral R3c, and a pseudocubic  $Pm\bar 3m$ space group was used. TEM revealed SSRs, which are not consistent with a pure
 $Pm\bar 3m$ phase, but indicate the presence of P4bm and R3c or Cc distorted phases. Due to the low scattering power of oxygen, these SSRs are not visible with x-rays. Therefore, the structure model was simplified to P4mm for the P4bm phase. In the applied form, P4mm is structurally identical to P4bm but without the possibility of octahedral tilting.Reference Jones and Thomas48 The Cc phase is believed to extend from the (0.1; 0) composition to the MPB. The refinement with the R3c phase was again chosen because a refinement with the Cc phase did not converge due to the high number of degrees of freedom. A pseudocubic
 $Pm\bar 3m$ phase was incorporated to account for local disordered regions.Reference Aksel, Forrester, Kowalski, Jones and Thomas37 A refinement with these three phases represents the patterns better than a single-phase cubic refinement, even though deviations from a cubic structure are small. There is no apparent change in lattice constants in the temperature range up to 200 °C for this composition. Above 200 °C, a refinement with the distorted phases did not converge.
For the structural model of the (0.4; 0) composition, a combination of tetragonal P4mm and pseudocubic  $Pm\bar 3m$ was chosen. TEM observations in Fig. 3 show weak and diffuse ½{ooe} reflections indicating the space group P4bm. Due to the low scattering power of oxygen, these SSRs are not visible with x-rays and again the structure model was simplified to P4mm.
The lattice constants of the (0.4; 0) composition do not reveal any discontinuous changes on heating up to 150 °C; above this temperature, a refinement including the tetragonal phase was not stable. 150 °C is about the temperature the splitting of the {200}c reflection starts to disappear.
For the KNN containing compositions, the same phases as for the respective KNN-free compositions were first tested. The composition of (0.1; 0.02) could be refined with the same phases and exhibited similar trends as the (0.1; 0) composition but with a lower transition temperature of 130 °C. For the composition (0.1; 0.05), no refinement with a distorted phase was possible, so a single-phase  $Pm\bar 3m$ structural model was applied. No discontinuities in the lattice parameter occurred up to 500 °C, suggesting an absence of any measurable PT in the investigated temperature range. Compositions of (0.4; 0.02) and (0.4; 0.05) were also refined with a two-phase model of P4mm and
 $Pm\bar 3m$. For (0.4; 0.02), the refinement including the tetragonal phase was only stable up to rather low temperatures of about 100 °C, the temperature when the {200}c split starts to disappear. The refinement with P4mm and
 $Pm\bar 3m$ was possible for (0.4; 0.05) up to about 100 °C, but the phase fraction of P4mm never exceeded 10% as expected from the small deviation of the cubic structure. No evidence for a PT was found in the evolution of the lattice constants.
2. Raman
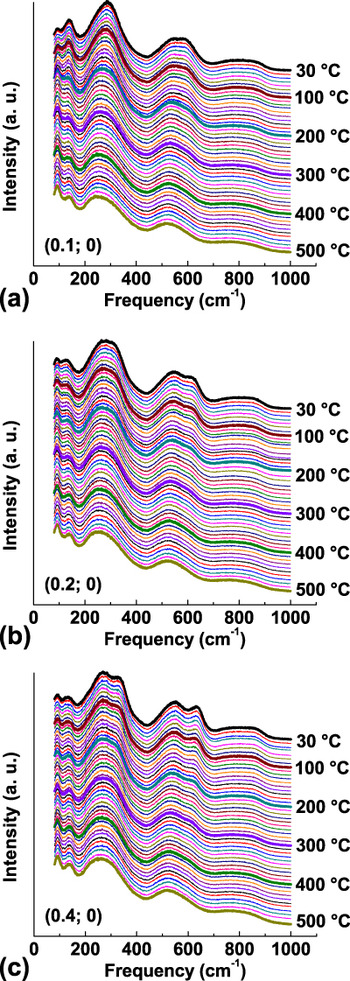
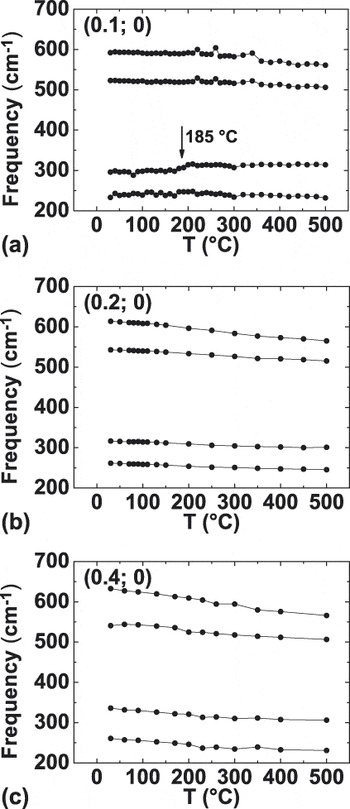
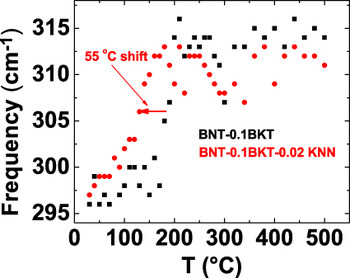
Figure 10 provides the Raman spectra of KNN-free compositions from RT to 500 °C with a temperature interval of 10 °C. A general broadening of the Raman modes is observed with increasing temperature due to the increased thermal motion of the ions, but there are no changes indicating a PT. To further investigate the thermal evolution of the spectra, the frequency range from 200 to 600 cm−1 was fitted with four Lorentzian lines. The frequencies of the modes as obtained by the fit are presented in Fig. 11. The compositions of (0.2; 0) and (0.4; 0) do not show a discontinuous change of the fitted peak positions. For the (0.1; 0) composition, a sudden increase of the frequency of the mode around 300 cm−1 is observed at 185 °C. The only other composition which reveals a comparable sudden change in frequencies is (0.1; 0.02) for which the shift is found at 130 °C, as displayed in Fig. 12.
Temperature-dependent Raman spectra for (a) BNT–0.1BKT, (b) BNT–0.2BKT, and (c) BNT–0.4BKT.

Frequencies of selected Raman modes as obtained by a fit with four Lorentzian lines. (a) BNT–0.1BKT, (b) BNT–0.2BKT, and (c) BNT–0.4BKT.

Comparison of the phase transition temperature of BNT–0.1BKT and (BNT–0.1BKT)–0.02KNN as revealed by a discontinuous frequency shift of a Raman mode.

IV. DISCUSSION
A. RT structure
TEM BF images reveal a suppression of ferroelectric domains and development of polar nanoregions with increasing KNN content in the (BNT–xBKT)–yKNN system. The same effect of KNN was observed in a similar system BNT–xBT–yKNN (x; y) by Schmitt et al.Reference Schmitt, Hinterstein, Kleebe and Fuess44 In that case, the (0.05; 0.01) composition showed lamellar domains with a coexistence of a pseudocubic and a distorted phase. In the sample with higher KNN content (0.06; 0.02), mainly regions with granular contrast and a single pseudocubic phase were observed. The pseudocubic phase was found to be nonpolar. This effect of KNN seems to appear in different material systems. La was found to have a similar effect on the domain configuration in PZT as KNN in BNT–BKT. In the La-doped PZT-based system Pb1−xLax(Zr1−yTiy)1−x/4O3 (PLZT), Dai et al.Reference Dai, Xu, Li and Viehland32 demonstrated performing TEM that with increasing La content, there is a gradual transition from a ferroelectric phase with lamellar microdomains to a relaxor ferroelectric phase with polar nanoregions. An intermediate state of coexisting lamellar microdomains and polar nanoregions was also reported.
A combination of nanoscale regions including nontilted in-phase a 0a 0c + and antiphase a−a−a− tilted domains with different orientations was also suggested for a BNT–BKT-based ceramicReference Tai and Lereah20 and ascribed to structural disorder of Bi atoms.Reference Kreisel, Bouvier, Dkhil, Thomas, Glazer, Welberry, Chaabane and Mezouar49 The BNT–xBKT system is a relaxor ferroelectricReference Said and Mercurio50 even without KNN. Thus, lamellar domains and polar nanoregions coexist for (0.2; 0) and (0.4; 0) compositions. Apart from this similarity, the SAED patterns show a clear tendency of decreasing intensity of SSRs with K+ addition. Performing neutron total scattering and reverse Monte Carlo modeling, Jeong et al.Reference Jeong, Park, Kim, Kim, Moon, Kim and Ahn36 reported the suppression of oxygen octahedral tilting with increasing amount of K+ ions substituting the smaller Na+ ions. For the MPB composition (0.2; 0), a variation in intensity of SSR was observed.
Contrary to our observation for the MPB composition (0.2; 0), Otonicar et al.Reference Otonicar, Skapin and Jancar21 observed predominantly ½{ooe} SSRs. They suggested the sole presence of tetragonal phase induced during TEM sample preparation.
For x = 0.2, the substitution of 2 mol% KNN causes the disappearance of lamellar domains and thus destroys the long-range polar order. For x = 0.4, a reduction in the number of lamellar domains is only observed at concentrations of at least 5 mol% KNN. The more pronounced effect of KNN on the compositions with x = 0.2 can be rationalized by the fact that these compositions have a less distorted unit cell (Fig. 9). This is in accordance with PLZT, where Dai et al.Reference Dai, Xu, Li and Viehland32 observed that more La was necessary to cause a similar reduction of lamellar domains for more distorted structures. The differences in the c/a ratio of the tetragonal unit cell also explain why reflection splitting is only observed for the (0.4; 0) and (0.4; 0.02) compositions on the BKT-side of the MPB but not for those at the MPB with x = 0.2. Compositions of (0.4; 0) and (0.4; 0.02) have a relatively high c/a ratio of 1.016 and 1.015, respectively, whereas the compositions with x = 0.2 have a c/a ratio of less than 1.010 as obtained by XRD (Fig. 9 for y = 0, others not shown). The c/a ratio calculated from the reflection splitting in the SAED image was 1.021 ± 0.003 for (0.4; 0) and 1.017 ± 0.002 for (0.4; 0.02), which nearly agrees with the c/a ratio obtained by XRD. The deviation for the (0.4; 0) composition can be explained by local variation of the c/a ratio, which affects the results from SAED probing on a local scale, but not XRD, which averages over a larger volume of the sample.
Even though there are clearly differences in the microstructure, the SAED images do not reveal changes of the local real structure for samples with different KNN contents. The SAED images of the compositions with x = 0.2 were nearly the same for all KNN contents showing the ½{ooo} and ½{ooe} SSR in the <310>c zone, thus samples with all investigated KNN contents can be assumed to have the same coexistence of monoclinic Cc or rhombohedral R3c and tetragonal P4bm phases. The SSRs as revealed by the TEM SAED show streaking, which could be explained by planar defects. An alternative explanation, which is consistent with the hypothesized Cc space group in this region, is that the streaking is caused by an a −a −c − tilt system.Reference Levin, Reaney, Anton, Jo, Rödel, Pokorny, Schmitt, Kleebe, Hinterstein, Trodahl and Jones25
The (0.4; 0) composition was found to have a P4bm phase causing the expected ½{ooe} SSRs and a local disorder of the oxygen octahedral tilt angles, which cause weak ½{ooo} SSR in the <310>c zone and elongation of the ½{ooe} SSRs. In KNN containing samples with x = 0.4, no ½{ooo} SSRs were observed in the <310>c zone, which might be due to a decreased amount of regions with oxygen octahedral tilting. Nevertheless, the space group P4bm does not change since ½{ooe} SSRs are present for all KNN contents. Thus, KNN affects the long-range polar order of the BNT–xBKT system favoring the development of polar nanoregions typical for relaxor ferroelectrics without having an influence on the local crystallographic symmetry. The weakening of the ferroelectric order in the BNT–BKT–KNN system, visible in a reduction of remanent polarization and negative strain, was already demonstrated by electrical measurements.Reference Anton, Jo, Trodahl, Damjanovic and Rödel13
The Raman spectra support the result that the local symmetry remains unchanged for varying KNN contents for x = 0.2 and 0.4. Raman spectra are sensitive to changes of the local environment of the ions, thus almost identical spectra for the x = 0.2 and x = 0.4 compositions suggest that the local symmetry does not change with KNN contents up to 5 mol% in agreement with the TEM results. In contrast, compositions with x = 0.1 reveal a difference between the low KNN and the 5 mol% KNN compositions. It was observed that the spectrum of the composition with 5 mol% KNN resembles the one at the MPB without KNN and it is suggested to also represent a MPB structure with phase coexistence.Reference Anton, Jo, Trodahl, Damjanovic and Rödel13 This assumption can be proven with the results from neutron diffraction as presented in this paper. Neutron diffraction on the (0.1; 0.05) composition revealed the presence of both ½{310}c and ½{311}c SSRs, which are consistent with coexisting Cc and P4bmstructures, the same as found for the MPB. This leads to the conclusion that the MPB extends from (0.2; 0) to (0.2; 0.02), (0.2; 0.05), and to the (0.1; 0.05) composition.
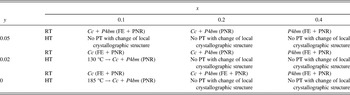
XRD is a suitable method to investigate the long-range order of a material. The split of the {111}c reflection observed for the compositions of (0.1; 0) and (0.1; 0.02) reveals the dominantly ferroelectric character with long-range ordered ferroelectric domains. The Cc space group was assigned to these compositions, as explained above. The split of the {200}c reflection in the (0.4; 0) and (0.4; 0.02) compositions demonstrates that there is a long-range ferroelectric order with a nontilted P4mm or in-phase tilted P4bm space group present. Both space groups are possible since XRD is not as sensitive for oxygen octahedral tilting. Taking into account the TEM results, which show the presence of SSR compatible with a 0a 0c + in-phase tilting, the P4bm space group is assigned. The MPB compositions from (0.2; 0), (0.2; 0.02), (0.2; 0.05), and (0.1; 0.05) mainly have a relaxor characterReference Anton, Jo, Damjanovic and Rödel40 with short-range ordered polar nanoregions as shown by TEM and a coexistence of Cc and P4bm phases as obtained by a combination of XRD, neutron diffraction, and TEM. For the (0.4; 0.05) composition, a mainly short-range ordered P4bm structure is revealed by TEM from the observation of a granular contrast and the ½{ooe} SSR. The asymmetry of the {hhk} (h ≠ k) XRD profiles confirms this tetragonality. The ½{ooe} SSRs expected in the P4bm phase were not observed in the x-ray measurement; these reflections may not be observed because tilting may not be ordered at a long enough length scale for x-ray observation. The RT structure of (BNT–xBKT)–yKNN is summarized in Table I.
Summary of the structure and phase transitions (PT) of (BNT-xBKT)-yKNN from room temperature (RT) up to high temperatures (HT) of 500 °C. FE: ferroelectric domains, PNR: polar nanoregions.

The combination of different techniques revealed the ferroelectric and relaxor properties of (BNT–xBKT)–yKNN. While Raman probes the average local order, the microstructure and local crystallographic structure can be studied with TEM down to the nanometer regime. High-resolution XRD is suitable for profile analysis and for the detection of weak lattice distortions. The high sensitivity of neutron diffraction to oxygen is ideal for the investigation of SSRs originating from oxygen octahedral tilting.
The combination of these methods demonstrates that a lamellar domain structure can be directly connected to a ferroelectric active phase with lattice distortions. An increasing KNN content suppresses these distorted phases. Especially, for morphotropic compositions, the nonpolar and pseudocubic character and the high isotropic displacement parameters of the A-site cations indicate relaxor properties at RT.
B. Temperature-dependent structural evolution
Discontinuous changes in the Raman spectra indicate a PT with a change of the local symmetry. A discontinuous change of the fitted frequencies of the Raman modes was only observed for the compositions (0.1; 0) and (0.1; 0.02) at 185 and 130 °C, respectively. At approximately the same temperatures, changes in the XRD lattice parameters of the rhombohedral phase take place. This PT is suggested to be a transition from the Cc phase to a Cc + P4bm phase coexistence, similar to the previously reported transition of pure BNT from R3c to R3c + P4bm at 255 °C.Reference Jones and Thomas48 When this paper by Jones and ThomasReference Jones and Thomas48 was published, the space group of BNT was still believed to be R3c, but recent publications indicate a monoclinic Cc structure.Reference Gorfman and Thomas23–Reference Levin, Reaney, Anton, Jo, Rödel, Pokorny, Schmitt, Kleebe, Hinterstein, Trodahl and Jones25
At the MPB, that means for (0.1; 0.05) and for all compositions with x = 0.2, no indication of a PT was found in the Raman spectra or in XRD from RT up to 500 °C. It can be expected that a transition to a cubic phase takes place only at higher temperatures, e.g., 700 °C for BNT–xBKT with x ≥ 0.1.Reference Jones, Kreisel and Thomas14 The absence of a PT was also reported for the MPB composition BNT–0.06BT by Wylie-van Eerd et al.Reference Wylie-van Eerd, Damjanovic, Klein, Setter and Trodahl28 using Raman spectroscopy, even though electrical properties revealed significant changes in the lower temperature regime.Reference Takenaka, Maruyama and Sakata6 Wylie-van Eerd et al.Reference Wylie-van Eerd, Damjanovic, Klein, Setter and Trodahl28 found structural changes between a low temperature phase (zone I) and a high temperature (HT) phase (zone III) on the BNT-rich side of the MPB at 5 mol% BT. At the MPB and up to 10 mol% BT, there was no structural difference between RT (zone II) and the higher temperature zone III. In other words, the HT phase for lower BT contents is equivalent to the MPB phase, which is also the case for the here investigated BNT–xBKT system for lower BKT contents. The transition temperature to this HT phase, which is the same as the Cc + P4bm phase coexistence at the MPB, is lowered when adding KNN to BNT–0.1BKT. Finally, at 5 mol% KNN, the HT phase is stabilized at RT. This also explains why there is no PT observed for the MPB compositions since the “HT” phase coexistence is already stable at RT for these compositions.
Below 200 °C, Yao et al.Reference Yao, Liu, Chen and Cao26 observed a dielectric anomaly in the BNT–0.2BKT system on poled samples, which was ascribed to a ferroelectric to antiferroelectric phase transformation. Similar to the BNT–BTReference Wylie-van Eerd, Damjanovic, Klein, Setter and Trodahl28 system, there is no structural PT related to this electrical anomaly revealed by Raman or XRD for BNT–0.2BKT, making the explanation of the ferroelectric to antiferroelectric PT unlikely. For BNT–BT, the dielectric anomalies were explained by thermal evolution of the ferroelectric polar nanoregions.Reference Jo, Schaab, Sapper, Schmitt, Kleebe, Bell and Rodel51 As mentioned above, poled samples might lead to different results in the structural investigation.
For higher BKT contents, the tetragonal P4bm phase is stable at RT. XRD shows a decrease of the tetragonal split for (0.4; 0) and (0.4; 0.02) compositions upon heating, but there is no indication of a PT in the Raman spectra. This discrepancy is explained by the different probing size of the methods. The changes in the XRD patterns reveal that the long-range polar order of the samples is destroyed while heating. This rationalizes why the split of the {200}c reflection vanishes and the pattern appears cubic above a certain temperature. Raman on the other hand is only sensitive to local ion environments. On a local level, the unit cells are still tetragonal distorted up to HTs, leaving the Raman spectra changing only gradually with temperature. For the composition (0.4; 0.05), the long-range ferroelectric order is already disturbed by the high KNN content, resulting in a pseudocubic XRD pattern starting from RT. The results on temperature-dependent PTs in the (BNT–xBKT)–yKNN system are summarized in Table 1.
V. CONCLUSIONS
The RT structure and PTs of (BNT-xBKT)-yKNN (x; y) piezoceramics with x = 0.1, 0.2, and 0.4 and y = 0, 0.02, and 0.05 were investigated by TEM, neutron diffraction, temperature-dependent XRD, and Raman spectroscopy. It was shown that KNN-free samples have a long-range polar order with ferroelectric domains on both sides of the MPB at x = 0.2, while at the MPB, a predominantly short-range order with polar nanoregions is observed. Still, there are always regions with short-range polar order next to the ferroelectric microdomains as expected from the relaxor character of the investigated system. With increasing KNN content, the long-range polar order is disturbed favoring the evolution of polar nanoregions instead of ferroelectric microdomains. For x = 0.1, additions of 5 mol% KNN stabilize a phase coexistence of Cc + P4bm at RT. This phase coexistence is observed at higher temperatures for the samples with x = 0.1 and smaller KNN contents and is also the structure observed at the MPB. Hence, the MPB extends from (0.2; 0) to (0.2; 0.02), (0.2; 0.05), and to the (0.1; 0.05) composition. Except for the low KNN content compositions with x = 0.1, there was no PT with local symmetry change observed from RT up to 500 °C for any of the other investigated compositions.
ACKNOWLEDGMENTS
E-M.A. acknowledges support for this work by the LOEWE-center AdRIA on adaptronics. M.H. acknowledges support from the BMBF (Bundesministerium für Bildung und Forschung) under Grant No. 05K10ODA. J.L.J. and B.K. acknowledge partial support by the U.S. National Science Foundation (NSF) under award number DMR-0746902 and the U.S. Department of the Army under W911NF-09-1-0435. Use of the Advanced Photon Source was supported by the U.S. Department of Energy, Office of Science, Office of Basic Energy Sciences, under Contract No. DE-AC02-06CH11357. The authors thank Robert Dittmer and Matthew Suchomel for assistance with the x-ray measurements, Thomas Hansen for the assistance with neutron measurements, Lars Riekehr for TEM specimen preparation, and Michael Wagner for assistance with Raman spectroscopy and sample preparation.