1 Introduction
Turbulent boundary layers (TBLs) subjected to streamwise pressure gradients (PGs) are of great importance in a wide range of industrial applications, including the flow around a wing or inside a diffuser. Despite their relevance, the effects of PGs on the characteristics of wall-bounded turbulence are still elusive. Part of the reason for this lack of detailed knowledge of PG TBLs is the fact that there is not a systematic approach towards characterizing the pressure gradient. Since the effect of the pressure gradient on the TBL is closely related to its streamwise development (Spalart & Watmuff Reference Spalart and Watmuff1993), it is important to define the concept of an equilibrium boundary layer: according to the strict definition by Townsend (Reference Townsend1956), this condition requires the mean flow and Reynolds-stress tensor profiles to be independent of the streamwise position
 $x$
, when scaled with appropriate local velocity and length scales. As also shown by Townsend (Reference Townsend1956) this condition is only satisfied by the sink flow, although it is possible to define a less restrictive near-equilibrium condition when the mean velocity defect
 $U_{\infty }-U$
is self-similar in the outer region, which in any case dominates at high Reynolds numbers (Marusic et al.
Reference Marusic, Mckeon, Monkewitz, Nagib, Smits and Sreenivasan2010). Townsend (Reference Townsend1956) and Mellor & Gibson (Reference Mellor and Gibson1966) showed that these near-equilibrium conditions can be obtained when the free stream velocity is prescribed by a power law such that
 $U_{\infty }=C(x-x_{0})^{m}$
, where
 $C$
is a constant,
 $x_{0}$
is a virtual origin and
 $m$
the power-law exponent. In particular, Townsend (Reference Townsend1956) showed that
 $m$
has to be larger than
 $-1/3$
in order to obtain near-equilibrium conditions, which means that all accelerated TBLs subjected to a favourable pressure gradient (FPG), with
 $U_{\infty }$
distributions defined by a power law, exhibit near-equilibrium behaviour. Regarding TBLs subjected to adverse pressure gradients (APGs), only the ones with
 $U_{\infty }$
defined by a power law as defined above, and satisfying
 $-1/3<m<0$
are in near-equilibrium conditions. Note that Townsend (Reference Townsend1956) also showed that a free stream velocity distribution defined by an exponential function as
 $U_{\infty }=C\exp (\unicode[STIX]{x1D707}x)$
(with
 $\unicode[STIX]{x1D707}$
being a constant) may also lead to near-equilibrium conditions, although only if
 $\unicode[STIX]{x1D707}>0$
, i.e. only in the case of FPG TBLs. Further discussion on equilibrium in APG TBLs can be found in the work by Maciel, Rossignol & Lemay (Reference Maciel, Rossignol and Lemay2006). An additional interesting conclusion is the fact that the widely studied zero-pressure-gradient (ZPG) TBL (Schlatter et al.
Reference Schlatter, Örlü, Li, Brethouwer, Fransson, Johansson, Alfredsson and Henningson2009; Bailey et al.
Reference Bailey, Hultmark, Monty, Alfredsson, Chong, Duncan, Fransson, Hutchins, Marusic and Mckeon2013), driven by a constant free stream velocity, is a particular case of the general near-equilibrium TBLs proposed by Townsend (Reference Townsend1956) and Mellor & Gibson (Reference Mellor and Gibson1966) where
 $m=0$
. In this respect, it is relatively common in the literature to refer to ‘self-similar’ boundary layers, where as discussed above the only case in which complete self-similarity is observed is the sink flow. For instance, Skåre & Krogstad (Reference Skåre and Krogstad1994) obtained an experimental APG TBL with a
 $U_{\infty }$
distribution given by a power law, and with
 $m=-0.23$
, which in principle would lead to near-equilibrium conditions. Nevertheless, the authors described their boundary layer as a self-similar one, therefore there is some discrepancy in the terminology and interpretation of PG TBL data. Moreover, power-law distributions of
 $U_{\infty }$
were also considered in the numerical studies by Skote, Henningson & Henkes (Reference Skote, Henningson and Henkes1998), Lee & Sung (Reference Lee and Sung2009) and Lee (Reference Lee2017), focused on attached APG TBLs, and by Skote & Henningson (Reference Skote and Henningson2002) where the aim was to characterize separated APG TBLs. In this context, the connection between backflow events present in APG TBLs and the mechanisms of separation have recently been studied by Vinuesa, Örlü & Schlatter (Reference Vinuesa, Örlü and Schlatter2017).
These differences in terminology are motivated in part by the difficulties arising from setting up canonical PG TBLs, the wide range of parameters used to characterize pressure-gradient effects (Monty, Harun & Marusic Reference Monty, Harun and Marusic2011), as well as the impact of history effects on the local state of the TBL (Schlatter & Örlü Reference Schlatter and Örlü2012), which leads to additional difficulties in the interpretation of the results. Another factor that might as well have contributed to the confusion when it comes to turbulence quantities, is the different level of insufficient spatial resolution (Hutchins et al. Reference Hutchins, Nickels, Marusic and Chong2009).
Perry, Marusic & Jones (Reference Perry, Marusic and Jones2002) attempted to develop a methodology to compute mean flow, Reynolds stress components and total shear-stress profiles, for any given free stream velocity distribution. Although this is a challenging task, especially in the general non-equilibrium case they considered, they reached some success with several empirical closures, and acknowledged the lack of data in the literature to accurately compute such streamwise evolutions. They identified the most relevant parameters determining the flow evolution from a particular initial condition, and considered a wide range of cases, from APG TBLs to the sink flow. More recently, a simplified version of the framework developed by Perry et al. (Reference Perry, Marusic and Jones2002) was used by Marusic et al. (Reference Marusic, Chauhan, Kulandaivelu and Hutchins2015) to evaluate the downstream evolution of ZPG TBLs from various initial conditions, in particular to assess the convergence towards a canonical ZPG configuration from different tripping devices.
The focus of this study is on near-equilibrium APG TBLs, and more precisely on the assessment of history effects on the boundary-layer development. To that end, we consider the Clauser pressure-gradient parameter
 $\unicode[STIX]{x1D6FD}=\unicode[STIX]{x1D6FF}^{\ast }/\unicode[STIX]{x1D70F}_{w}\,\text{d}P_{\infty }/\text{d}x$
, where
 $\unicode[STIX]{x1D6FF}^{\ast }$
is the displacement thickness,
 $\unicode[STIX]{x1D70F}_{w}$
is the wall-shear stress and
 $P_{\infty }$
is the free stream pressure, to quantify the pressure-gradient magnitude and evaluate the evolution of flat-plate TBLs under various
 $\unicode[STIX]{x1D6FD}(x)$
distributions. For this purpose, datasets from well-resolved large-eddy simulations (LES) of turbulent boundary layers with various APG conditions (Bobke et al.
Reference Bobke, Vinuesa, Örlü and Schlatter2016b
) and the flow over the suction side of a wing from a recent direct numerical simulation (DNS) (Hosseini et al.
Reference Hosseini, Vinuesa, Schlatter, Hanifi and Henningson2016) are considered. To complement the existing databases, two new simulations in which the pressure-gradient parameter
 $\unicode[STIX]{x1D6FD}$
remains constant have been performed. To the best of the authors knowledge, this is the first systematic approach to assess the effect of streamwise pressure-gradient history effects on the development of turbulent boundary layers.
The paper is organized as follows: in § 2 we provide a description of the numerical method used for the flat-plate APG simulations, as well as a summary of the various databases under consideration; the impact of different
 $\unicode[STIX]{x1D6FD}(x)$
distributions on turbulence statistics, spectra and boundary-layer development is discussed in § 3; in § 4 we use our cases with constant
 $\unicode[STIX]{x1D6FD}$
to assess the alternative scaling law proposed by Kitsios et al. (Reference Kitsios, Atkinson, Sillero, Borrell, Gungor, Jiménez and Soria2016); and finally in § 5 the main conclusions of the present study are outlined.
2 Numerical method and databases
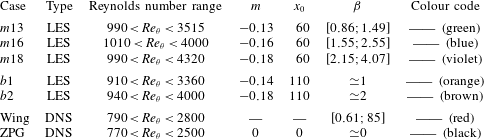
List of datasets used in the present paper, including their momentum loss Reynolds number range, power-law exponent, virtual origin, Clauser pressure-gradient parameter and colour code used throughout the remainder of the paper. The set-up of cases
 $m13$
,
 $m16$
and
 $m18$
is reported in detail by Bobke et al. (Reference Bobke, Vinuesa, Örlü and Schlatter2016b
); the wing case is described by Hosseini et al. (Reference Hosseini, Vinuesa, Schlatter, Hanifi and Henningson2016) and the ZPG database is reported by Schlatter et al. (Reference Schlatter, Örlü, Li, Brethouwer, Fransson, Johansson, Alfredsson and Henningson2009). Note that the ranges are given for
 $x>500$
, and up to the location where the fringe in the outflow is applied.

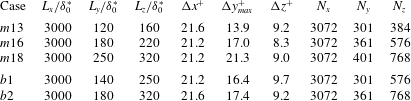
Summary of simulation parameters from the various cases considered in this study.
 $L_{x}$
,
 $L_{y}$
and
 $L_{z}$
are the domain sizes in the streamwise, wall-normal and spanwise directions.
 $\unicode[STIX]{x0394}x$
and
 $\unicode[STIX]{x0394}z$
are the collocation resolutions in the wall-parallel directions, obtained using
 $N_{x}$
and
 $N_{z}$
points, respectively.
 $\unicode[STIX]{x0394}y_{max}$
is the maximum grid spacing in the wall-normal direction and the number of Chebyshev polynomials is denoted by
 $N_{y}$
. Note that in all the cases, at least 10 grid points were located below
 $y^{+}=10$
.

The downstream evolution of TBLs subjected to adverse pressure gradients was studied by means of well-resolved LES. The pressure gradient was imposed through the variation of the free stream velocity at the top of the domain, which was defined following the near-equilibrium definition by Townsend (Reference Townsend1956), i.e.
 $U_{\infty }(x)=C(x-x_{0})^{m}$
. Thus, different near-equilibrium boundary layers were investigated by varying the virtual origin
 $x_{0}$
and the power-law exponent
 $m$
as listed in table 1. We used the code SIMSON (Chevalier et al.
Reference Chevalier, Schlatter, Lundbladh and Henningson2007), which is based on a fully spectral method with Fourier discretization in streamwise and spanwise directions and on the Chebyshev-tau method in the wall-normal direction. See also the work by Skote (Reference Skote2001) for additional details on APG TBL simulations with this code. A summary of the simulation parameters, including domain size and grid resolutions for the various cases, is given in table 2. Note that in this article the superscript ‘
 $+$
’ denotes inner scaling, i.e. non-dimensionalization with the friction velocity
 $u_{\unicode[STIX]{x1D70F}}=\sqrt{\unicode[STIX]{x1D70F}_{w}/\unicode[STIX]{x1D70C}}$
(where
 $\unicode[STIX]{x1D70F}_{w}$
is the wall-shear stress and
 $\unicode[STIX]{x1D70C}$
is the fluid density) and the fluid kinematic viscosity
 $\unicode[STIX]{x1D708}$
. The value of
 $u_{\unicode[STIX]{x1D70F}}$
used to compute the grid resolutions reported in table 2 was taken at
 $x/\unicode[STIX]{x1D6FF}_{0}^{\ast }=250$
(where
 $\unicode[STIX]{x1D6FF}_{0}^{\ast }$
is the displacement thickness of the laminar inflow) in all the cases. In this work we used the approximate deconvolution relaxation term model (ADM-RT, see Schlatter, Stolz & Kleiser Reference Schlatter, Stolz and Kleiser2004) as a subgrid-scale (SGS) model as in Eitel-Amor, Örlü & Schlatter (Reference Eitel-Amor, Örlü and Schlatter2014). Unlike other SGS models, in the relaxation term approach the forcing acts directly on the resolved velocity components
 $\overline{u}_{i}$
,
 $$\begin{eqnarray}\frac{\unicode[STIX]{x2202}\unicode[STIX]{x1D70F}_{ij}}{\unicode[STIX]{x2202}x_{j}}=\unicode[STIX]{x1D712}H_{N}\ast \overline{u}_{i},\end{eqnarray}$$
where
 $\unicode[STIX]{x1D70F}_{ij}$
denotes the Reynolds stresses,
 $\unicode[STIX]{x1D712}$
is a model coefficient which is taken as equal to 0.2 and the cutoff frequency of the high-order filter
 $H_{N}$
is taken as
 $\unicode[STIX]{x1D714}_{c}\approx 0.86\unicode[STIX]{x03C0}$
. The high-order filter
 $H_{N}$
is designed so that the model affects only the small scales in the flow, whereas the large scales are unaffected by the model. The symbol
 $\ast$
represents the convolution operator and the overbar the implicit grid filter due to the lower resolution in the LES. In earlier boundary-layer studies (Eitel-Amor et al.
Reference Eitel-Amor, Örlü and Schlatter2014; Bobke, Örlü & Schlatter Reference Bobke, Örlü and Schlatter2016a
) it has been shown that the results from the LES are in very good agreement with the DNS in terms of mean velocity, Reynolds-stress tensor and turbulence budgets. At the wall a no-slip condition was imposed, while at the upper boundary a Neumann condition was applied. In particular, we set
 $\unicode[STIX]{x2202}u/\unicode[STIX]{x2202}y=\unicode[STIX]{x2202}w/\unicode[STIX]{x2202}y=0$
, and the wall-normal velocity gradient is obtained from continuity as
 $\unicode[STIX]{x2202}v/\unicode[STIX]{x2202}y=-\unicode[STIX]{x2202}U_{\infty }/\unicode[STIX]{x2202}x$
, therefore the free stream velocity distribution is imposed through the Neumann boundary condition. Although technically this choice of boundary conditions does not lead to zero spanwise vorticity
 $\unicode[STIX]{x1D714}_{z}$
in the free stream, we have observed that
 $\unicode[STIX]{x1D714}_{z}$
is approximately zero well beyond the boundary-layer edge (for
 $y>2.5\unicode[STIX]{x1D6FF}_{99}$
, where
 $\unicode[STIX]{x1D6FF}_{99}$
is the 99 % boundary-layer thickness), and only very close to the top boundary increases slightly to match the condition
 $\unicode[STIX]{x2202}u/\unicode[STIX]{x2202}y=0$
(Bobke et al.
Reference Bobke, Vinuesa, Örlü and Schlatter2016b
). In order to ensure periodic boundary conditions in the streamwise direction a fringe region was considered upstream of the outlet, which forces the fully turbulent flow back to the laminar Blasius inlet profile. The pressure gradients in the TBLs under consideration are of different magnitudes, and exhibit various streamwise developments. The resulting pressure-gradient parameter
 $\unicode[STIX]{x1D6FD}$
decreases over the streamwise direction in the cases
 $m13$
,
 $m16$
and
 $m18$
, whereas
 $\unicode[STIX]{x1D6FD}$
remains constant over streamwise distances of
 $37\overline{\unicode[STIX]{x1D6FF}}_{99}$
and
 $28\overline{\unicode[STIX]{x1D6FF}}_{99}$
in the cases
 $b1$
and
 $b2$
, respectively. The overbar denotes the boundary-layer thickness averaged over the region where
 $\unicode[STIX]{x1D6FD}$
is observed to remain constant. The determination of the boundary-layer thickness and edge velocity can become ambiguous and cumbersome the stronger the pressure gradient becomes, hence, here the 99 % boundary-layer thickness
 $\unicode[STIX]{x1D6FF}_{99}$
was determined by means of the method developed by Vinuesa et al. (Reference Vinuesa, Bobke, Örlü and Schlatter2016) for PG TBLs. Further details regarding the numerical set-up of the cases
 $m13$
,
 $m16$
and
 $m18$
are given by Bobke et al. (Reference Bobke, Vinuesa, Örlü and Schlatter2016b
). In addition to the five flat-plate APG cases discussed above, also the TBL developing over the suction side of a NACA4412 wing section at
 $Re_{c}=400\,000$
(where
 $Re_{c}$
is the Reynolds number based on free stream velocity
 $U_{\infty }$
and chord length
 $c$
) by Hosseini et al. (Reference Hosseini, Vinuesa, Schlatter, Hanifi and Henningson2016), and the ZPG TBL data by Schlatter et al. (Reference Schlatter, Örlü, Li, Brethouwer, Fransson, Johansson, Alfredsson and Henningson2009) are considered, as shown in table 1. The idea is that the TBL developing on the suction side of the wing is subjected to a progressively stronger APG (contrary to the flat-plate APG TBLs, in which case they are either constant or mildly relaxing), and therefore exhibits a very interesting
 $\unicode[STIX]{x1D6FD}(x)$
distribution, which will enrich the comparison with the near-equilibrium cases developing over the flat plate. DNS was considered for the wing case, and the spectral-element code Nek5000 (Fischer, Lottes & Kerkemeier Reference Fischer, Lottes and Kerkemeier2008) was employed, as discussed in detail in Hosseini et al. (Reference Hosseini, Vinuesa, Schlatter, Hanifi and Henningson2016). The DNS of ZPG TBL by Schlatter et al. (Reference Schlatter, Örlü, Li, Brethouwer, Fransson, Johansson, Alfredsson and Henningson2009) is considered to provide a baseline case, with respect to which pressure-gradient effects can be assessed, since the APG cases start from the same initial conditions as the ZPG case.
2.1 Effect of the SGS model on the dissipation of turbulent kinetic energy
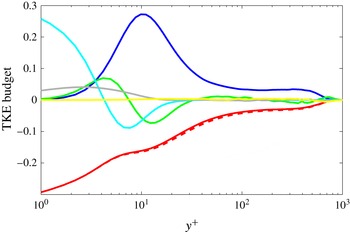
TKE budget corresponding to the
 $m13$
case at
 $x\simeq 2200$
. The Reynolds number based on momentum thickness is
 $Re_{\unicode[STIX]{x1D703}}=3300$
, and the value of
 $\unicode[STIX]{x1D6FD}$
is approximately 0.93. The budget terms are represented as follows: —— (blue) production, —— (red) resolved dissipation, —— (green) turbulent transport, —— (cyan) viscous diffusion, —— (grey) velocity–pressure-gradient correlation and —— (yellow) convection. Note that the total dissipation, including the resolved component and the additional contribution from the SGS model, is represented by – – – – (red). The TKE budget terms are scaled by
 $u_{\unicode[STIX]{x1D70F}}^{4}/\unicode[STIX]{x1D708}$
.

As stated above, in the present study we performed well-resolved LES, which means that the resolutions reported in table 2 are good, although not as high as the ones considered in proper DNS. As in the work by Eitel-Amor et al. (Reference Eitel-Amor, Örlü and Schlatter2014) we use the ADM-RT subgrid-scale model by Schlatter et al. (Reference Schlatter, Stolz and Kleiser2004), which adds an additional dissipation at the smallest scales, with the aim of improving the accuracy of the results. Eitel-Amor et al. (Reference Eitel-Amor, Örlü and Schlatter2014) performed well-resolved LES of the ZPG TBL case up to
 $Re_{\unicode[STIX]{x1D703}}=8300$
, and compared the terms in the turbulent kinetic energy (TKE) budget from their LES with the ones in the DNS simulation of a ZPG TBL at
 $Re_{\unicode[STIX]{x1D703}}=3600$
(Schlatter & Örlü Reference Schlatter and Örlü2010). Their results revealed that the agreement in all the terms of the TKE budget was excellent, and in fact when adding their resolved dissipation of TKE (which amounted to 87.2 % of the total dissipation in the DNS) with the additional dissipation of the SGS model, they were able to recover 99.8 % of the total dissipation from the DNS. The results by Eitel-Amor et al. (Reference Eitel-Amor, Örlü and Schlatter2014) in ZPG TBLs, using the same SGS approach as the one reported here, show the adequacy of the method considered in the present study. Moreover, in this section we illustrate the effect of the SGS model in APG TBLs. Note that the transport equation of the TKE, defined as
 $k=(1/2)(\langle u^{2}\rangle +\langle v^{2}\rangle +\langle w^{2}\rangle )$
, is given by:
 $$\begin{eqnarray}\frac{\unicode[STIX]{x2202}k}{\unicode[STIX]{x2202}t}=P^{k}+\unicode[STIX]{x1D700}^{k}+D^{k}+\unicode[STIX]{x1D6F1}^{k}+T^{k}+C^{k},\end{eqnarray}$$
where the production term is computed as
 $P^{k}=-\langle u_{i}u_{j}\rangle \unicode[STIX]{x2202}U_{i}/\unicode[STIX]{x2202}x_{j}$
, the dissipation as
 $\unicode[STIX]{x1D700}^{k}=-2\unicode[STIX]{x1D708}\langle s_{ij}s_{ij}\rangle$
(where
 $s_{ij}$
fluctuating strain rate), the viscous diffusion is defined as
 $D^{k}=(\unicode[STIX]{x1D708}/2)\unicode[STIX]{x2202}^{2}\langle u_{i}u_{i}\rangle /\unicode[STIX]{x2202}x_{j}^{2}$
, the velocity–pressure-gradient correlation is
 $\unicode[STIX]{x1D6F1}^{k}=-(1/\unicode[STIX]{x1D70C})\unicode[STIX]{x2202}\langle pu_{i}\rangle /\unicode[STIX]{x2202}x_{i}$
, the turbulent transport is calculated as
 $T^{k}=-(1/2)\unicode[STIX]{x2202}\langle u_{i}u_{i}u_{j}\rangle \unicode[STIX]{x2202}x_{j}$
and the convection is
 $C^{k}=-(1/2)\langle u_{j}\rangle \unicode[STIX]{x2202}\langle u_{i}u_{i}\rangle /\unicode[STIX]{x2202}x_{j}$
. In figure 1 we show the TKE budget corresponding to the
 $m13$
case at
 $Re_{\unicode[STIX]{x1D703}}=3300$
, subjected to a value of
 $\unicode[STIX]{x1D6FD}\simeq 0.93$
. Although the effects of the APG on the various terms from the TKE budget are discussed in detail in § 3.2 for various pressure-gradient conditions, here it is interesting to highlight that the resolved dissipation corresponds to 92 % of the total dissipation. Note that the total dissipation would also include the additional contribution from the SGS model. Note that the larger percentage of resolved dissipation, compared to the ZPG case, can be explained by the fact that the friction-velocity values used to design the mesh were taken at
 $x\simeq 250$
, whereas the budget shown in figure 1 was extracted at
 $x\simeq 2200$
. Naturally, the friction-velocity value at the location where the budget is obtained is lower than the one used to design the mesh due to the APG, and consequently the resolution is effectively higher. Therefore, we consider that the resolution and SGS model used in the present study are adequate to properly reproduce the energy transfer across scales in the present APG TBLs.
3 Results and discussion
3.1 Streamwise development
We first report the streamwise development of five near-equilibrium APG TBLs on flat plates, defined by different power-law exponents and virtual origins. As stated in § 1, the state of the boundary layer will not depend on the particular value of
 $\unicode[STIX]{x1D6FD}$
at a certain position, but on its development history, i.e. on
 $\unicode[STIX]{x1D6FD}(x)$
. While
 $\unicode[STIX]{x1D6FD}$
decreases over the streamwise direction in the cases denoted with
 $m$
(
 $m13$
,
 $m16$
,
 $m18$
),
 $\unicode[STIX]{x1D6FD}$
remains constant for the two cases denoted with
 $b$
(
 $b1$
,
 $b2$
). Let us recall that although
 $\unicode[STIX]{x1D6FD}$
is not constant with
 $x$
in the
 $m$
cases, these TBLs are in near equilibrium due to the fact that the
 $U_{\infty }$
distribution is prescribed by a power law as defined by Townsend (Reference Townsend1956) and Mellor & Gibson (Reference Mellor and Gibson1966). Regarding the cases with constant
 $\unicode[STIX]{x1D6FD}$
, not only are they in near equilibrium, but they also allow a better characterization of Reynolds-number effects in a certain pressure-gradient configuration. Note that the ZPG TBL flow essentially corresponds to a constant
 $\unicode[STIX]{x1D6FD}=0$
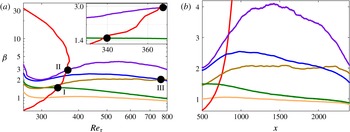
configuration. In figure 2 we show the streamwise evolution of
 $\unicode[STIX]{x1D6FD}$
, as a function of the friction Reynolds number
 $Re_{\unicode[STIX]{x1D70F}}$
(based on the friction velocity
 $u_{\unicode[STIX]{x1D70F}}$
and the boundary-layer thickness
 $\unicode[STIX]{x1D6FF}_{99}$
) and the streamwise coordinate
 $x$
, for the various flat-plate cases as well as for the TBL on the suction side of a wing described in § 2. For the flat-plate cases the inflow laminar displacement thickness
 $\unicode[STIX]{x1D6FF}_{0}^{\ast }$
is used to non-dimensionalize
 $x$
, whereas for the case of the wing the displacement thickness at
 $x/c=0.15$
, where the flow is post-transitional, is considered.
Clauser pressure-gradient parameter
 $\unicode[STIX]{x1D6FD}$
as function of (a) friction Reynolds number
 $Re_{\unicode[STIX]{x1D70F}}$
and (b) streamwise coordinate
 $x$
for the following cases: —— (red) boundary layer developing on the suction side of a wing (Hosseini et al.
Reference Hosseini, Vinuesa, Schlatter, Hanifi and Henningson2016), and over a flat plate for non-constant
 $\unicode[STIX]{x1D6FD}$
-cases (—— (green)
 $m=-0.13$
, —— (blue)
 $m=-0.16$
and —— (violet)
 $m=-0.18$
) and constant
 $\unicode[STIX]{x1D6FD}$
-cases (—— (brown)
 $\unicode[STIX]{x1D6FD}=1$
and —— (orange)
 $\unicode[STIX]{x1D6FD}=2$
). Inset and black dots indicate the matched
 $\unicode[STIX]{x1D6FD}{-}Re_{\unicode[STIX]{x1D70F}}$
values that will be considered in the remainder of the paper.

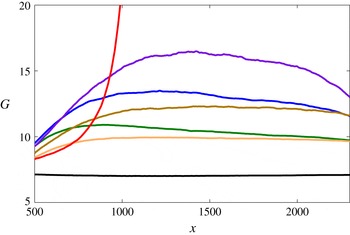
Further insight into the characteristics of near-equilibrium TBLs can be gained by analysing the streamwise evolution of the defect shape factor
 $G$
, defined as follows:
 $$\begin{eqnarray}G=\frac{\displaystyle \int _{0}^{\infty }(U_{\infty }^{+}-U^{+})^{2}\,\text{d}y}{\displaystyle \int _{0}^{\infty }(U_{\infty }^{+}-U^{+})\,\text{d}y}.\end{eqnarray}$$
Note that the defect shape factor can also be expressed as
 $G=(H_{12}-1)/(H_{12}\sqrt{c_{f}/2})$
, where
 $c_{f}=2(u_{\unicode[STIX]{x1D70F}}/U_{e})^{2}$
is the skin-friction coefficient (with
 $U_{e}$
being the boundary-layer edge velocity at the particular streamwise location) and
 $H_{12}=\unicode[STIX]{x1D6FF}^{\ast }/\unicode[STIX]{x1D703}$
is the shape factor. According to Mellor & Gibson (Reference Mellor and Gibson1966), the value of
 $G$
is essentially constant in near-equilibrium APG TBLs with a constant value of
 $\unicode[STIX]{x1D6FD}$
, and they also introduced a correction factor for
 $G$
at low Reynolds numbers. In figure 3 we show the streamwise evolution of
 $G$
in the various cases under consideration, including the ZPG TBL. It is interesting to note that, as expected from the work by Mellor & Gibson (Reference Mellor and Gibson1966), the values of
 $G$
generally increase for progressively larger values of
 $\unicode[STIX]{x1D6FD}$
, and qualitatively the
 $G(x)$
curves resemble the
 $\unicode[STIX]{x1D6FD}(x)$
ones. Moreover, it is interesting to observe that the cases with regions of constant
 $\unicode[STIX]{x1D6FD}$
, i.e. the ZPG TBL and the
 $b1$
and
 $b2$
APGs, also exhibit regions of constant
 $G$
, which is also in agreement with Mellor & Gibson (Reference Mellor and Gibson1966). Note that in figure 2(b) it can be observed that the
 $b1$
case shows a region of constant
 $\unicode[STIX]{x1D6FD}=1$
in the range
 $500<x<1300$
, whereas in the
 $b2$
configuration the
 $\unicode[STIX]{x1D6FD}=2$
region is identified for
 $1000<x<2300$
. On the other hand, the results shown in figure 3 reveal that the regions of constant
 $G$
start downstream of the corresponding regions of constant
 $\unicode[STIX]{x1D6FD}$
: in the
 $b1$
case the constant-
 $G$
region starts at approximately
 $x\simeq 1000$
, and in the
 $b2$
configuration it starts at approximately
 $x\simeq 1200$
. Interestingly, these regions of constant defect shape factor end at approximately the same locations as the constant-
 $\unicode[STIX]{x1D6FD}$
regions do. Moreover, the ZPG case appears to exhibit a region of constant
 $G$
already at
 $x\simeq 500$
, and it extends up to
 $x\simeq 2300$
. A possible explanation for the delay in the region of constant
 $G$
present in the APG cases can be the fact that, as stated by Mellor & Gibson (Reference Mellor and Gibson1966),
 $G$
is essentially constant in regions of constant
 $\unicode[STIX]{x1D6FD}$
but there is a small Reynolds-number effect, which is only significant at low Reynolds numbers. A correction to account for this effect was proposed by Mellor & Gibson (Reference Mellor and Gibson1966), and the correction leads to an increase in
 $G$
inversely proportional to the Reynolds number and the skin-friction coefficient. Since, as discussed below, the ZPG case exhibits larger
 $c_{f}$
values than the APG ones, the correction would have a smaller effect on this case, thus explaining the reason why this configuration exhibits the constant-
 $G$
behaviour earlier. Moreover, the fact that the two APG cases also exhibit regions of constant
 $G$
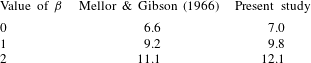
is attributed to the fact that the correction only has a significant contribution at low Reynolds numbers. Note that Mellor & Gibson (Reference Mellor and Gibson1966) provided theoretical predictions of the values of
 $G$
in PG TBLs subjected to different values of
 $\unicode[STIX]{x1D6FD}$
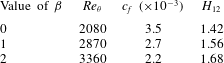
. In particular, in table 3 we provide a comparison of the
 $G$
values obtained in the constant-
 $G$
regions from the
 $\unicode[STIX]{x1D6FD}=0$
, 1 and 2 cases in the present study, with the values reported by Mellor & Gibson (Reference Mellor and Gibson1966). The values are in reasonably good agreement, especially at lower values of
 $\unicode[STIX]{x1D6FD}$
, and the general increasing trend of
 $G$
with
 $\unicode[STIX]{x1D6FD}$
predicted by Mellor & Gibson (Reference Mellor and Gibson1966) is also well represented by the present numerical simulations. It is also important to note that, as indicated in § 1, the fact that a TBL exhibits a constant value of
 $\unicode[STIX]{x1D6FD}$
, or of
 $G$
, does not imply that this boundary layer exhibits self-similarity, since as shown by Townsend (Reference Townsend1956) only the sink flow fulfils the requirements for complete self-similarity. On the other hand, the constant-
 $\unicode[STIX]{x1D6FD}$
cases (including the ZPG TBL) are particular cases of near-equilibrium PG TBLs, in which the mean velocity defect is self-similar in the outer region at high Reynolds numbers (Marusic et al.
Reference Marusic, Mckeon, Monkewitz, Nagib, Smits and Sreenivasan2010). The scaling of near-equilibrium TBLs is further discussed in § 4.


Summary of values of
 $G$
obtained in the constant-
 $\unicode[STIX]{x1D6FD}$
regions from the cases with
 $\unicode[STIX]{x1D6FD}=0$
, 1 and 2 in the present study, compared with the theoretical predictions by Mellor & Gibson (Reference Mellor and Gibson1966).

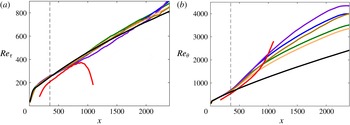
The streamwise development of various integral quantities, for the various configurations under consideration, is discussed next. In figure 4(a),
 $Re_{\unicode[STIX]{x1D70F}}$
is shown for all pressure-gradient cases listed in table 1. The growth of
 $Re_{\unicode[STIX]{x1D70F}}$
is similar for all the boundary layers over the flat plate reaching up to
 $Re_{\unicode[STIX]{x1D70F}}\simeq 900$
at the end of the domain. The APG was applied at the streamwise position
 $x\simeq 350$
, which is denoted by the vertical line. At this position a change in the slope of
 $Re_{\unicode[STIX]{x1D70F}}$
can clearly be observed between the various APG TBLs. Interestingly, the
 $Re_{\unicode[STIX]{x1D70F}}$
trend appears to be relatively independent of the strength of the pressure gradient in the investigated
 $\unicode[STIX]{x1D6FD}$
-range. Note that in the case of the APG TBL developing on the suction side of a wing the growth of
 $Re_{\unicode[STIX]{x1D70F}}$
is also similar to the flat-plate cases up to
 $Re_{\unicode[STIX]{x1D70F}}\simeq 380$
, from where on
 $Re_{\unicode[STIX]{x1D70F}}$
decreases rapidly towards the trailing edge of the wing due to the progressively stronger values of
 $\unicode[STIX]{x1D6FD}$
obtained in this region. Towards the trailing edge of the wing, the skin friction is further reduced and with this the friction velocity
 $u_{\unicode[STIX]{x1D70F}}$
and
 $Re_{\unicode[STIX]{x1D70F}}$
, despite the relative increase in
 $\unicode[STIX]{x1D6FF}_{99}$
. Also, let us recall that for the wing we show results for
 $x/c>0.15$
(since the flow is tripped at
 $x/c=0.1$
), and the value of
 $\unicode[STIX]{x1D6FF}^{\ast }$
at this location is used to non-dimensionalize the streamwise coordinate
 $x$
. Moreover, in figure 4(b) the Reynolds number based on the momentum thickness
 $Re_{\unicode[STIX]{x1D703}}$
is shown. Within the ZPG region the various flat-plate cases exhibit very good agreement, and grow within the APG region with various growth rates depending on the particular
 $\unicode[STIX]{x1D6FD}(x)$
distribution. Note that in general the cases subjected to larger
 $\unicode[STIX]{x1D6FD}(x)$
values show larger
 $Re_{\unicode[STIX]{x1D703}}$
, due to the increase in the boundary-layer thickness produced by the boundary-layer lift up caused by the APG. The growth of
 $Re_{\unicode[STIX]{x1D703}}$
in the wing is comparable to the one observed in the flat-plate case up to
 $x\simeq 900$
. Beyond this point, the
 $Re_{\unicode[STIX]{x1D703}}$
curve exhibits a stepper growth rate. The value of
 $\unicode[STIX]{x1D6FD}$
at the streamwise position where the
 $Re_{\unicode[STIX]{x1D70F}}$
and
 $Re_{\unicode[STIX]{x1D703}}$
curves from the wing start to deviate from those of the flat-plate cases is around 4, beyond those considered in the comparison of statistics from § 3.2.
Streamwise evolution of (a) friction Reynolds number
 $Re_{\unicode[STIX]{x1D70F}}$
and (b) momentum loss Reynolds number
 $Re_{\unicode[STIX]{x1D703}}$
. The location where the pressure gradient is applied,
 $x=350$
, is represented by a thin dashed line and the colours are given by table 1.

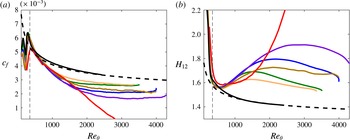
In figure 5 we show the skin-friction coefficient
 $c_{f}$
and the shape factor
 $H_{12}$
as a function of
 $Re_{\unicode[STIX]{x1D703}}$
for the various APG cases. Firstly, the
 $c_{f}$
trends from the APG boundary layers are below the ZPG correlation by Nagib, Chauhan & Monkewitz (Reference Nagib, Chauhan and Monkewitz2007), which is explained by the reduced velocity gradient at the wall and is a consequence of the increased thickening experienced by the boundary layer in the streamwise direction due to the action of the APG. This is also connected to the higher
 $U_{\infty }^{+}$
values observed in the APG boundary layers, as discussed in § 3.2. Also note that the various APG cases exhibit similar
 $c_{f}$
evolutions in the range
 $350<Re_{\unicode[STIX]{x1D703}}<1000$
, whereas at higher Reynolds numbers the development is strongly influenced by the particular
 $\unicode[STIX]{x1D6FD}(x)$
distribution. It can be observed in figure 5(a) that higher
 $\unicode[STIX]{x1D6FD}$
values lead to lower skin friction. Moreover, the agreement among profiles for
 $350<Re_{\unicode[STIX]{x1D703}}<1000$
is associated with the fact that the boundary layer needs a certain streamwise distance to adapt to the prescribed APG conditions, since the
 $U_{\infty }(x)$
distribution leading to the APG is imposed at the top boundary of the computational domain, but its effect in
 $c_{f}$
is reflected at the wall. On the other hand, within the ZPG region, the given correlation does not represent the data of the simulations, which can be explained by the way that the pressure gradient is introduced in the flow: the free stream velocity profile is modified according to the corresponding power law, but the ZPG region is not long enough to reach a canonical ZPG state, which is represented by the correlation from Nagib et al. (Reference Nagib, Chauhan and Monkewitz2007); similar observations have been made by Schlatter & Örlü (Reference Schlatter and Örlü2010). In this context, it is interesting to point out that the wing boundary layer actually reaches the
 $c_{f}$
values from the ZPG correlation at
 $Re_{\unicode[STIX]{x1D703}}\simeq 350$
, and deviates from it at
 $Re_{\unicode[STIX]{x1D703}}\simeq 700$
. The boundary layer developing on the suction side of the wing starts from very low values of
 $\unicode[STIX]{x1D6FD}\simeq 0$
, and therefore exhibits a region of approximate ZPG conditions, which allows a development closer to that of canonical ZPGs, before the exponential increase in
 $\unicode[STIX]{x1D6FD}$
observed beyond
 $x/c\simeq 0.4$
(Hosseini et al.
Reference Hosseini, Vinuesa, Schlatter, Hanifi and Henningson2016). Similar conclusions can be drawn from the streamwise evolution of the shape factor
 $H_{12}$
, shown in figure 5(b). Whereas the curves from the various APG cases collapse for
 $350<Re_{\unicode[STIX]{x1D703}}<1000$
,
 $H_{12}$
grows more rapidly for higher
 $\unicode[STIX]{x1D6FD}$
than for the small and intermediate
 $\unicode[STIX]{x1D6FD}$
cases, where actually a small decrease can be detected towards high
 $Re_{\unicode[STIX]{x1D703}}$
. Note that higher
 $\unicode[STIX]{x1D6FD}$
values lead to larger
 $H_{12}$
due to the fact that an APG boundary layer will be thicker than an equivalent ZPG carrying the same momentum. Nevertheless, the distribution of
 $H_{12}$
in ZPGs differs completely to the one in APG TBLs, not even the slopes in the range
 $350<Re_{\unicode[STIX]{x1D703}}<1000$
are similar. This is also connected to the thicker boundary layers in APG flows, and the lift-up of the boundary layer. It is also interesting to note that the wing boundary layer exhibits a similar trend to that of the various flat-plate cases up to
 $x\simeq 1000$
, after which point the significantly higher increase in
 $\unicode[STIX]{x1D6FD}$
leads to a much steeper growth in shape factor. Most notable is, however,
 $Re_{\unicode[STIX]{x1D703}}$
-trend exhibited by the constant
 $\unicode[STIX]{x1D6FD}$
cases
 $b1$
and
 $b2$
, in which both the skin-friction coefficient and shape factor curves are nearly parallel to the ZPG, i.e.
 $\unicode[STIX]{x1D6FD}=0$
, case.
Evolution of (a) skin-friction coefficient
 $c_{f}$
and (b) shape factor
 $H_{12}$
with momentum loss Reynolds number
 $Re_{\unicode[STIX]{x1D703}}$
. – – – – (Black) represents the empirical correlations developed by Nagib et al. (Reference Nagib, Chauhan and Monkewitz2007) for
 $c_{f}$
, and by Monkewitz, Chauhan & Nagib (Reference Monkewitz, Chauhan and Nagib2007) for
 $H_{12}$
. The location where the pressure gradient is applied,
 $x=350$
, is represented by a thin dashed line and the colours are given by table 1.

The effect of the particular
 $\unicode[STIX]{x1D6FD}(x)$
distributions on the turbulence statistics, for the various cases under consideration, is discussed next.
3.2 Effect of history on turbulence statistics
In order to evaluate the impact of different
 $\unicode[STIX]{x1D6FD}(x)$
distributions on the local state of the APG TBL, we select three cases in which the
 $\unicode[STIX]{x1D6FD}$
and
 $Re_{\unicode[STIX]{x1D70F}}$
conditions are matched, but with different streamwise histories of
 $\unicode[STIX]{x1D6FD}$
. As highlighted with black dots in figure 2, the first selected case is
 $\unicode[STIX]{x1D6FD}=1.4$
and
 $Re_{\unicode[STIX]{x1D70F}}=340$
, obtained from the wing (which starts from very low values of
 $\unicode[STIX]{x1D6FD}$
and exhibits approximately exponential growth with
 $x$
) and from the flat-plate case
 $m13$
(in which a decreasing trend in
 $\unicode[STIX]{x1D6FD}$
, starting from higher values, is observed). The second case exhibits a slightly higher friction Reynolds number
 $Re_{\unicode[STIX]{x1D70F}}=367$
, at a stronger adverse pressure gradient
 $\unicode[STIX]{x1D6FD}=2.9$
, and in this case also the wing is selected (with the exponentially increasing
 $\unicode[STIX]{x1D6FD}(x)$
), together with the flat-plate APG case
 $m18$
, which at that point exhibits a slightly increasing trend in
 $\unicode[STIX]{x1D6FD}$
. The third case highlighted in figure 2 involves the two flat-plate APG TBLs
 $m16$
and
 $b2$
, at a higher Reynolds number of
 $Re_{\unicode[STIX]{x1D70F}}=762$
, and with
 $\unicode[STIX]{x1D6FD}=2.0$
. Note that in this particular case both boundary layers are in near equilibrium, and that the
 $b2$
configuration exhibits a constant value of
 $\unicode[STIX]{x1D6FD}=2$
starting at
 $x\simeq 1000$
, whereas in the
 $m16$
case the
 $\unicode[STIX]{x1D6FD}$
curve shows a decreasing trend. Additionally, ZPG profiles at the corresponding
 $Re_{\unicode[STIX]{x1D70F}}$
are shown together with each of the comparisons.
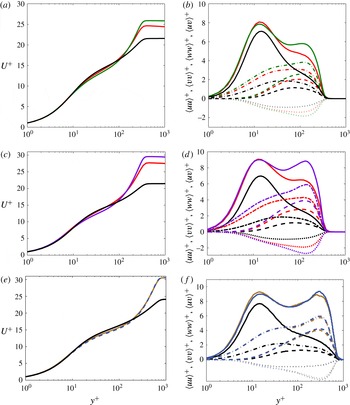
(a,c,e) Inner-scaled mean velocity profiles and (b,d,f) selected components of the inner-scaled Reynolds-stress tensor. (a,b) Correspond to case I:
 $\unicode[STIX]{x1D6FD}=1.4$
and
 $Re_{\unicode[STIX]{x1D70F}}=340$
; (c,d) to case II:
 $\unicode[STIX]{x1D6FD}=2.9$
and
 $Re_{\unicode[STIX]{x1D70F}}=367$
; and (e,f) to case III:
 $\unicode[STIX]{x1D6FD}=2.0$
and
 $Re_{\unicode[STIX]{x1D70F}}=762$
. Colours as in table 1, and the following line styles correspond to the various Reynolds stress tensor components: ——
 $\langle uu\rangle ^{+}$
, – – – –
 $\langle vv\rangle ^{+}$
, — ⋅ —
 $\langle ww\rangle ^{+}$
and
 $\cdots \cdots$
 $\langle uv\rangle ^{+}$
. The dotted line in (e) is used to allow better visualization of the profiles.

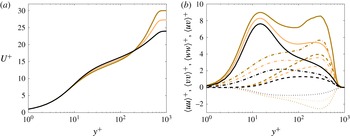
In figure 6 we show the inner-scaled mean flow for the various comparisons discussed above, as well as selected components of the Reynolds-stress tensor. The first two important observations from this figure are: although the three comparisons are at the same
 $\unicode[STIX]{x1D6FD}$
and
 $Re_{\unicode[STIX]{x1D70F}}$
, the turbulence statistics in the outer layer (i.e. overlap and wake layers) are essentially different among the cases, while they agree in the viscous sublayer, i.e. for
 $y^{+}<5$
. This highlights the significant impact of history effects on the state of the outer layer of a turbulent boundary layer. Focusing on figure 6(a), we can observe the general effect of a moderate APG with
 $\unicode[STIX]{x1D6FD}=1.4$
on the boundary layers, compared with the equivalent ZPG case: the APG TBLs exhibit a steeper logarithmic region, as previously observed by Nagib & Chauhan (Reference Nagib and Chauhan2008) who reported lower values of the von Kármán coefficient
 $\unicode[STIX]{x1D705}$
in APGs. Moreover, the APG TBLs also exhibit a more prominent wake than the ZPG, associated with stronger energetic structures in the outer region, as also observed by Monty et al. (Reference Monty, Harun and Marusic2011) and Vinuesa et al. (Reference Vinuesa, Rozier, Schlatter and Nagib2014). With respect to the differences between the two APG cases, it is important to recall that the profiles on the suction side of the wing were obtained by means of DNS, whereas the flat-plate boundary layers are based on LES. This could be the reason for the subtle discrepancies between both profiles in the buffer region, since as documented by Eitel-Amor et al. (Reference Eitel-Amor, Örlü and Schlatter2014) the coarser resolution used in the LES produces slightly lower mean velocities in this region of the boundary layer. Nevertheless, the effect of the LES is negligible in the outer region, and therefore the differences observed in the wake of the two APG cases can be attributed to their particular streamwise evolution. Monty et al. (Reference Monty, Harun and Marusic2011) and Harun et al. (Reference Harun, Monty, Mathis and Marusic2013) showed that the APG energizes the largest turbulent structures in the outer flow, leading to the more prominent wake, as well as to the outer peak in the streamwise velocity fluctuation profile. As noticeable in figure 2, the
 $\unicode[STIX]{x1D6FD}(x)$
curve from the
 $m13$
case exhibits values above
 $1.4$
from the start of the pressure-gradient region, whereas in the wing the initial
 $\unicode[STIX]{x1D6FD}$
values are close to zero, and they only reach the value 1.4 after a certain streamwise development. Therefore, in the
 $m13$
case the outer flow was subjected to a stronger APG throughout its streamwise development, and hence the larger structures received much more energy from the APG. As a consequence, and although at
 $Re_{\unicode[STIX]{x1D70F}}=340$
the wing and the flat-plate boundary layers have the same value of
 $\unicode[STIX]{x1D6FD}=1.4$
, the accumulated
 $\unicode[STIX]{x1D6FD}(x)$
effect leads to a stronger impact of the APG in the
 $m13$
case. The Reynolds-stress tensor components are analysed for this case in figure 6(b), where again the most characteristic features of APG TBLs can be observed in comparison with the ZPG case (Monty et al.
Reference Monty, Harun and Marusic2011): the streamwise velocity fluctuation profile develops an outer peak, a consequence of the energizing of the large-scale motions, which also produces an increase of the near-wall peak due to the connection between the near-wall region and the outer flow. Note that the location of this inner peak,
 $y^{+}\simeq 15$
, is essentially unaffected by the APG. The wall-normal and spanwise velocity variance profiles, as well as the Reynolds-shear-stress profile, exhibit a more prominent outer region compared to the ZPG due to the effect of the APG on the outer flow. Regarding the characteristics of the two APG cases, the first noticeable feature is the fact that the value of the inner peak appears to be approximately the same in the two cases, whereas the
 $m13$
case exhibits a stronger outer peak. The larger value of the outer peak can be explained, as well as the more prominent wake, by the fact that the flat-plate case was exposed to a higher accumulated
 $\unicode[STIX]{x1D6FD}(x)$
, therefore the large-scale motions in the outer flow were effectively more energized than those in the wing. Nevertheless, it would be expected that the inner peak would also be larger in the
 $m13$
case, due to the connection between the large-scale motions in the outer flow and the near-wall region, as mentioned above. A possible explanation for this apparent contradiction lies in the use of LES for the
 $m13$
are, which as also mentioned above does not have a noticeable effect on the outer region. Moreover, in the outer region, the wall-normal and spanwise variances, as well as the Reynolds-shear-stress profile, are also stronger in the
 $m13$
case than in the wing. An alternative explanation might be related to the different upstream histories of the boundary layers exposed to nearly the same
 $\unicode[STIX]{x1D6FD}$
parameter: the boundary layer on the wing increases in terms of the strength of the APG along its downstream evolution, while the TBL in the
 $m=-0.13$
case stems from a stronger APG that relaxes in terms of
 $\unicode[STIX]{x1D6FD}$
. Whereas the inner layer adapts quickly to the imposed pressure gradient, the outer layer inherits the different upstream histories farther downstream, thereby yielding matched inner-layer turbulence statistics at the same
 $\unicode[STIX]{x1D6FD}$
-value, while the outer layer exhibits amplitudes that are rather representative of the respective
 $\unicode[STIX]{x1D6FD}$
at a more upstream station, i.e. a higher and lower
 $\unicode[STIX]{x1D6FD}$
value for the
 $m=-0.13$
and wing, respectively.
The second comparison is also between a flat-plate APG and the boundary layer developing on the suction side of the wing, this time at
 $\unicode[STIX]{x1D6FD}=2.9$
and
 $Re_{\unicode[STIX]{x1D70F}}=367$
. In figure 6(c) the effect of a stronger APG on the mean flow can be observed in comparison with the ZPG, more precisely, the wake region is significantly stronger (a fact associated with a much lower skin friction and the lifting up of the boundary layer by the action of the APG), and the incipient log region is steeper. Also in this case, the
 $\unicode[STIX]{x1D6FD}(x)$
history from the flat-plate case (
 $m18$
) leads to a higher accumulated effect of the APG in comparison with the wing. In particular, the
 $m18$
case exhibits values of
 $\unicode[STIX]{x1D6FD}$
starting around 2 (at the beginning of the APG region), and increasing up to the value of around 2.9 where the comparison with the wing is performed. On the other hand, in the wing the initial values are around zero and rise quickly up to the value of
 $2.9$
, but the accumulated APG effect is significantly inferior to that of the flat-plate case. This is again manifested in the more prominent wake region for the
 $m18$
configuration, due to the fact that the most energetic structures in the outer flow have been exposed to a stronger APG throughout the boundary-layer development. The discrepancy in the logarithmic and buffer regions for the streamwise mean velocity profile is larger in this case than what was observed in figure 6(a), at a lower
 $\unicode[STIX]{x1D6FD}$
. Note that the lower velocities in the buffer region with stronger localized APGs have already been reported by Monty et al. (Reference Monty, Harun and Marusic2011), and therefore it is plausible that in this case they could be caused by the different
 $\unicode[STIX]{x1D6FD}(x)$
from the two cases. Figure 6(d) further supports the fact that the accumulated
 $\unicode[STIX]{x1D6FD}(x)$
in the
 $m18$
case leads to a much more energetic outer region compared with the wing. The outer peak in the streamwise fluctuations is significantly larger in the flat-plate case, and the differences in the outer region are also noticeable in the other two fluctuation components, as well as in the Reynolds shear stress (as opposed to what was observed in the lower
 $\unicode[STIX]{x1D6FD}$
case described above). Interestingly, also in this case the inner peak in the streamwise fluctuations from the two APG TBLs exhibits approximately the same value, despite the large difference in the outer region.
Finally, in figure 6(e) we compare the mean flow from two flat-plate cases, one with a constant
 $\unicode[STIX]{x1D6FD}$
region (
 $b2$
), and the other one with no constant
 $\unicode[STIX]{x1D6FD}$
(
 $m16$
); both in near equilibrium. In particular, the comparison is done at
 $\unicode[STIX]{x1D6FD}\simeq 2$
and at a higher friction Reynolds number of
 $Re_{\unicode[STIX]{x1D70F}}=762$
. The effect of the APG is also noticeable in this case, with the more prominent wake and lower velocities in the buffer region, in comparison with the ZPG. Note that the
 $U_{\infty }^{+}$
value from the flat-plate boundary layers is approximately 30, approximately the value obtained in the
 $m18$
case. This inner-scaled free stream velocity is obtained here with a lower
 $\unicode[STIX]{x1D6FD}$
(2 instead of 2.9), but higher
 $Re_{\unicode[STIX]{x1D70F}}$
(762 instead of 367). This, together with the similarities between figures 6(f) and 6(d) in terms of inner and outer peaks of the streamwise velocity fluctuations, suggests certain connections between Reynolds-number and pressure-gradient effects. More precisely, a low-
 $Re$
APG TBL may exhibit features of a high-
 $Re$
ZPG TBL, if the magnitude of the APG is strong enough. This also points towards certain connections between the energizing mechanisms in the outer flow present at higher Reynolds numbers and with stronger APGs. Focusing on figure 6(e), it is interesting to note that the two flat-plate cases exhibit very good agreement in their mean flow profiles, although their streamwise developments are different. Nevertheless, figure 2(b) shows that although the
 $m16$
case exhibits a decreasing trend in
 $\unicode[STIX]{x1D6FD}(x)$
, and in the
 $b2$
case a region of constant
 $\unicode[STIX]{x1D6FD}$
is observed, from
 $x\simeq 1500$
to around 2000 (the location where the comparison is done), the two curves converge, and the relative differences between the two curves are below 15 %. Hence, both APGs share a similar upstream history for approximately 6.5 integrated boundary-layer thicknesses. Regarding the components of the Reynolds-stress tensor shown in figure 6(f), the pressure-gradient effects (combined with the moderate
 $Re_{\unicode[STIX]{x1D70F}}$
of 762) lead to significantly more energized structures in the outer region compared with the ZPG, as well as a larger near-wall peak in the streamwise component. Interestingly, in this case the outer peak of the streamwise velocity fluctuations is slightly larger than the inner peak; a phenomenon that suggests the development of a different energy distribution throughout the boundary layer, compared with that of moderately high ZPG TBLs. Such an overtaking of the inner peak by an outer peak has for instance been predicted by the diagnostic profile as shown by Alfredsson, Segalini & Örlü (Reference Alfredsson, Segalini and Örlü2011), Alfredsson, Örlü & Segalini (Reference Alfredsson, Örlü and Segalini2012), although there, the outer peak resided within the overlap region, which is not the case for strong APGs, cf. Skåre & Krogstad (Reference Skåre and Krogstad1994). The other significant observation is the fact that the two flat-plate APG boundary layers exhibit very good agreement in all the components of the Reynolds-stress tensor, again highlighting the convergence of the two boundary layers towards the same state. These results suggest that, in this particular configuration with a moderately changing
 $\unicode[STIX]{x1D6FD}$
, a streamwise distance of around
 $x/\unicode[STIX]{x1D6FF}_{0}^{\ast }\simeq 500$
(where
 $\unicode[STIX]{x1D6FF}_{0}^{\ast }$
is the displacement thickness of the inflow laminar boundary layer), corresponding to
 $6.5\overline{\unicode[STIX]{x1D6FF}}_{99}$
, may be sufficient for the APG TBL to become independent of its initial downstream development, and converge towards a certain state uniquely characterized by the
 $\unicode[STIX]{x1D6FD}$
and
 $Re_{\unicode[STIX]{x1D70F}}$
values.
The comparisons presented above were carried out at the same value of the friction Reynolds number as in the work by Harun et al. (Reference Harun, Monty, Mathis and Marusic2013), i.e. they focused on the effect of the pressure-gradient history on TBLs with the same inner-scaled boundary-layer thickness
 $\unicode[STIX]{x1D6FF}_{99}^{+}$
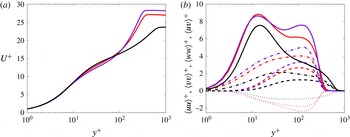
, which fixes the range of scales in the boundary layer. On the other hand, it is important to note that under very strong APG conditions the scales considered in ZPG TBLs are not valid anymore, and therefore the friction Reynolds number would not be an adequate representation of the Reynolds-number effects in the boundary layer. Although this is not the case in the configurations discussed in the present study, it is also interesting to consider cases where the matched Reynolds number is based on a length scale that would also be relevant at stronger APG conditions, such as the displacement thickness. Thus, in figure 7 we show a comparison between the wing and the
 $m18$
case similar to the one presented in figure 6(c,d), but in this case with a matched value of
 $\unicode[STIX]{x1D6FD}=2.75$
and
 $Re_{\unicode[STIX]{x1D6FF}^{\ast }}=2640$
. Note that the comparison of inner-scaled mean flow and Reynolds-stress tensor components between the two APG cases is very similar to the one shown in figure 6, although there is a subtle variation: the difference in APG effect between the
 $m18$
and the wing cases is slightly less pronounced in this matched-
 $Re_{\unicode[STIX]{x1D6FF}^{\ast }}$
comparison. This is due to the fact that when matching
 $Re_{\unicode[STIX]{x1D70F}}$
, the profiles from the two APG cases were extracted at almost the same streamwise position:
 $x=841$
in the wing and
 $x=852$
in the
 $m18$
boundary layer (cf. figure 6
c). Nevertheless, when matching
 $Re_{\unicode[STIX]{x1D6FF}^{\ast }}$
the wing profile is extracted slightly downstream (
 $x=822$
) of the
 $m18$
case (
 $x=718$
). This is due to the fact that
 $Re_{\unicode[STIX]{x1D6FF}^{\ast }}$
increases more quickly with the APG than
 $Re_{\unicode[STIX]{x1D70F}}$
, since the former is directly connected with the boundary-layer thickness, whereas the latter also includes the reduction in wall-shear stress induced by the APG. Thus, since the
 $m18$
case is subjected to a stronger accumulated effect of
 $\unicode[STIX]{x1D6FD}(x)$
, it reaches the target
 $Re_{\unicode[STIX]{x1D6FF}^{\ast }}$
earlier than the wing, a fact that also leads to less pronounced APG features with respect to the matched-
 $Re_{\unicode[STIX]{x1D70F}}$
case. Moreover, the most notable difference with respect to figure 6 is in the ZPG case at matched
 $Re_{\unicode[STIX]{x1D6FF}^{\ast }}$
: although the wake is less prominent, and the outer region of the Reynolds stresses is less energetic than in the APG cases, the
 $\unicode[STIX]{x1D6FF}_{99}^{+}$
values are significantly larger in the ZPG. This can be explained by the fact that the ZPG case only relies on
 $Re$
-effects to increase the displacement thickness, whereas in the pressure-gradient cases the APG significantly increases it. Thus, the results from the ZPG shown in figure 6 were obtained at
 $x=746$
, whereas the ones shown in figure 7 are obtained at
 $x=1757$
. The differences in
 $Re_{\unicode[STIX]{x1D70F}}$
values are important in the cases shown in figure 7: 365 and 332 for wing and
 $m18$
, whereas in the ZPG case the value is 636. This highlights the importance of the different scales when assessing Reynolds-number and pressure-gradient effects, especially in progressively more extreme conditions.
(a) Inner-scaled mean velocity profiles and (b) selected components of the inner-scaled Reynolds-stress tensor. Comparison performed at
 $\unicode[STIX]{x1D6FD}=2.75$
and
 $Re_{\unicode[STIX]{x1D6FF}^{\ast }}=2640$
. Colours and line styles as in figure 6(c,d).

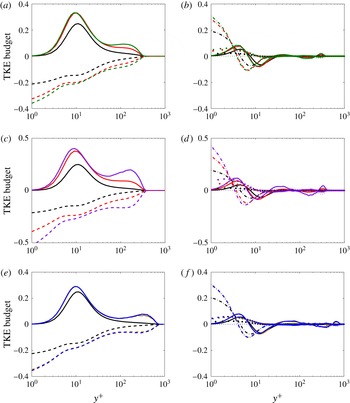
(a,c,e) Terms of the TKE budget: —— production
 $P^{k}$
and – – – – total dissipation (i.e., the resolved component
 $\unicode[STIX]{x1D700}^{k}$
plus the contribution from the SGS model in the LES cases); (b,d,f) —— turbulent transport
 $T^{k}$
, — ⋅ — viscous diffusion
 $D^{k}$
,
 $\bullet$
velocity–pressure-gradient correlation
 $\unicode[STIX]{x1D6F1}^{t}$
and
 $\cdots \cdots$
convection
 $C^{k}$
. Cases and colours as in figure 6. The TKE budget terms are scaled by
 $u_{\unicode[STIX]{x1D70F}}^{4}/\unicode[STIX]{x1D708}$
.

In order to further understand the TKE distribution throughout the boundary layer, the various terms of the inner-scaled TKE budget, defined in (2.2), are shown in figure 8 for the different cases under consideration, and the same comparisons as in figure 2 are performed. Note that in the TKE budgets shown in figure 8 we show the total dissipation, i.e. including the resolved component and also the contribution of the SGS model, as discussed in § 2.1. In figure 8(a) it can be observed that the APG leads to a larger near-wall production peak, as well as to enhanced production throughout the whole boundary layer. Moreover, higher dissipation is observed at the wall in the APG cases. Regarding the differences between the wing and the
 $m13$
case, the accumulated higher
 $\unicode[STIX]{x1D6FD}(x)$
from the flat-plate boundary layer leads to higher production in the outer region, as well as to larger dissipation at the wall and in the outer part. With respect to the remaining terms, shown in figure 8(b), note the higher viscous diffusion at the wall, which compensates the extra wall dissipation in APG TBLs, as well as the point where the turbulent transport changes sign, which also shifts slightly towards the wall. Consequently, the two APG cases exhibit higher values of the velocity–pressure-gradient correlation in the buffer and near-wall regions in comparison with the ZPG, which highlights the relevance of the pressure gradient in the TKE distribution across the boundary layer in the APG case. Interestingly, the most significant difference in this figure between the two APG cases is the higher viscous diffusion in the
 $m13$
configuration, which essentially balances the higher wall dissipation.
The differences between the two APG cases indicated above are magnified when comparing the wing and the
 $m18$
case in figure 8(c), where not only the high value of
 $\unicode[STIX]{x1D6FD}=2.9$
produces significant discrepancies with respect to the ZPG, but also the very different streamwise development of the two APG boundary layers leads to different manifestations of the pressure-gradient effects. The
 $m18$
case exhibits significantly higher production than the wing in the outer region, as well as increased dissipation also in the outer part of the boundary layer. Moreover, the flat-plate case shows higher wall dissipation, and interestingly also a larger value of the inner production peak. This is once again due to the fact that this case has been exposed to a stronger APG over a long streamwise distance, as opposed to the wing. The increased wall dissipation from the
 $m18$
case leads to higher viscous diffusion as observed in figure 8(d), and also the velocity–pressure-gradient correlation and the turbulent transport are increased in the region
 $y^{+}<5$
. These terms reflect the effect of the APG, especially in the
 $m18$
case which exhibits higher viscous diffusion at the wall, and larger turbulent transport and velocity–pressure-gradient correlation values close to the wall, than the wing case.
Finally, in figure 8(e,f) we show the TKE budget terms corresponding to the
 $m16$
and
 $b2$
cases. The previously discussed differences between the APG and ZPG cases, with a
 $\unicode[STIX]{x1D6FD}$
value of 2 and
 $Re_{\unicode[STIX]{x1D70F}}=762$
, are also present in this case. Thus, we observe higher production and dissipation of TKE throughout the whole boundary layer, especially higher production in the near-wall peak and outer region, and larger wall dissipation; we also observe higher viscous diffusion at the wall, as well as larger values of the turbulent transport and velocity–pressure-gradient correlation for
 $y^{+}<5$
. Nevertheless, the most remarkable result of these figures is the fact that both flat-plate cases exhibit very good agreement in all the TKE budget terms, again despite of their relatively different upstream histories. As discussed in figure 6, it appears that a streamwise distance of
 $\simeq 6.5\overline{\unicode[STIX]{x1D6FF}}_{99}$
(over which the differences in
 $\unicode[STIX]{x1D6FD}$
are below 15 %) is sufficient for the
 $m16$
case to converge towards the ‘canonical’
 $\unicode[STIX]{x1D6FD}=2$
APG TBL, represented in the present study by the
 $b2$
configuration. Note that in the present context, the statement ‘canonical’ refers to an APG TBL subjected to a constant value of
 $\unicode[STIX]{x1D6FD}$
over its streamwise development. Given the significant impact of the
 $\unicode[STIX]{x1D6FD}(x)$
history on the characteristics of an APG TBL, as discussed above, the case with a constant value of
 $\unicode[STIX]{x1D6FD}$
can be considered as a canonical representation of an APG at a given value of
 $\unicode[STIX]{x1D6FD}$
; this would be analogous to the constant
 $\unicode[STIX]{x1D6FD}=0$
case being the canonical representation of the ZPG TBL. Such convergence to a canonical APG state is a remarkable result, since the TKE budget terms are known for requiring long streamwise convergence lengths (as well as long sampling times). The present results show that it is possible to define a canonical APG turbulent boundary-layer case, which is essential for future studies on fundamentals of turbulence in PG TBLs.
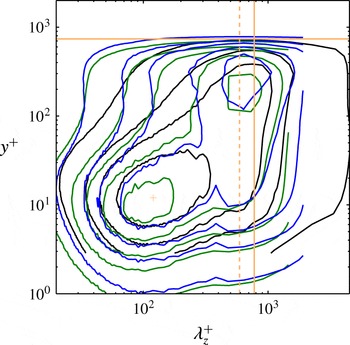
As discussed in figures 6 and 8, the APG energizes the large-scale motions in the outer flow, which leads to larger fluctuations not only in the outer part of the boundary layer, but also in the inner region due to the connection between the structures in the near-wall region and in the outer part of the boundary layer. These statements can be further confirmed by the one-dimensional premultiplied spectra of the streamwise velocity shown in figure 9 for the two non-constant pressure-gradient cases with
 $m=-0.13$
and
 $m=-0.16$
at matched friction Reynolds number
 $Re_{\unicode[STIX]{x1D70F}}\simeq 739$
. The premultiplied streamwise spectra from the ZPG TBL by Schlatter et al. (Reference Schlatter, Örlü, Li, Brethouwer, Fransson, Johansson, Alfredsson and Henningson2009) at a similar
 $Re_{\unicode[STIX]{x1D70F}}$
is also shown for comparison. Note that although the domain is not wide enough to completely capture some of the widest structures in the flow, the most relevant structures are properly simulated. The spectral inner peak is found at
 $y^{+}\simeq 12$
,
 $\unicode[STIX]{x1D706}_{z}^{+}\simeq 120$
, a position and width which appears to be approximately independent of the pressure gradient, and in agreement with the higher-
 $Re$
findings by Eitel-Amor et al. (Reference Eitel-Amor, Örlü and Schlatter2014). On the other hand, figure 9 reveals the development of an outer spectral peak with increasing
 $\unicode[STIX]{x1D6FD}$
, which is at the same wall-normal position as the corresponding outer peak observed in all the normal components of the Reynolds stress tensor in figure 6(f). As mentioned before, the development of this outer peak is caused by the energizing effect of the APG on the most energetic large structures in the flow; a process which shares some similarities with the high-
 $Re$
behaviour in ZPG TBLs. It is in fact interesting to note that this considerable spectral density peak in the outer region is also reported in ZPG TBLs at higher Reynolds number up to
 $Re_{\unicode[STIX]{x1D703}}=8300$
(Eitel-Amor et al.
Reference Eitel-Amor, Örlü and Schlatter2014), at the same wavelength as the one observed here, i.e.
 $\unicode[STIX]{x1D706}_{z}^{+}\simeq 0.8\unicode[STIX]{x1D6FF}_{99}^{+}$
. This supports the similarities in the development of large-scale motions in the outer region observed at high-
 $Re$
, and at lower
 $Re$
but in the presence of an APG.
Inner-scaled spanwise premultiplied power spectral density of the streamwise velocity
 $k_{z}\unicode[STIX]{x1D6F7}_{uu}/u_{\unicode[STIX]{x1D70F}}^{2}$
. The following APG TBL cases are shown: —— (green)
 $m=-0.13$
at
 $Re_{\unicode[STIX]{x1D70F}}=763$
and —— (blue)
 $m=-0.16$
at
 $Re_{\unicode[STIX]{x1D70F}}=739$
, and —— (black) represents the ZPG TBL case by Schlatter et al. (Reference Schlatter, Örlü, Li, Brethouwer, Fransson, Johansson, Alfredsson and Henningson2009) at
 $Re_{\unicode[STIX]{x1D70F}}=717$
. —— (orange) denotes
 $\unicode[STIX]{x1D6FF}_{99}^{+}=739$
, and – – – – (orange) indicates
 $\unicode[STIX]{x1D706}_{z}^{+}=0.8\unicode[STIX]{x1D6FF}_{99}^{+}$
. Note that the point
 $y^{+}=12$
,
 $\unicode[STIX]{x1D706}_{z}^{+}=120$
is represented by
 $+$
. Isocontour values of 0.1, 0.5, 1 and 2 are shown in the ZPG case, whereas one additional contour with value 3.5 is shown for the
 $m=-0.13$
and
 $m=-0.16$
configurations.

3.3 Characterization of constant-
 $\unicode[STIX]{x1D6FD}$
APG TBLs

(a) Inner-scaled mean velocity profiles and (b) selected components of the inner-scaled Reynolds-stress tensor. Cases with constant values of
 $\unicode[STIX]{x1D6FD}=0$
, 1 and 2, at matched friction Reynolds number
 $Re_{\unicode[STIX]{x1D70F}}\simeq 700$
. Colours as in table 1 and line styles as in figure 6.

In the previous section we discussed the great impact of flow history in the state of a TBL, and in particular we highlighted the importance of constant-
 $\unicode[STIX]{x1D6FD}$
cases as canonical representations of an APG TBL subjected to a certain pressure-gradient magnitude. In this section we characterize the constant-
 $\unicode[STIX]{x1D6FD}$
cases at a matched value of
 $Re_{\unicode[STIX]{x1D70F}}\simeq 700$
. In figure 10 we show the inner-scaled mean velocity profile and selected components of the Reynolds-stress tensor for the cases with constant values of
 $\unicode[STIX]{x1D6FD}=0$
, 1 and 2, i.e. the ZPG and two APG cases. The interest of these configurations lies in the fact that they do not depend on flow history, and therefore can be considered as reference results for the corresponding
 $\unicode[STIX]{x1D6FD}$
cases. Thus, the reported differences among cases are uniquely due to the pressure gradient, and not to flow history. The mean flow profile reveals the more prominent wake (connected to a lower skin-friction coefficient) at larger APGs, and also clearly shows the fact that the buffer layer lies below the one of the ZPG TBL, an effect that becomes more pronounced at progressively larger values of
 $\unicode[STIX]{x1D6FD}$
. As opposed to what is observed in stronger APG conditions (Skåre & Krogstad Reference Skåre and Krogstad1994), the cases under consideration in figure 10 do not exhibit any differences in the viscous sublayer with respect to the ZPG. As discussed above, the APG also has an important effect in the Reynolds-stress tensor components, manifested in more energetic velocity fluctuation profiles, as well as Reynolds-shear-stress profiles. This effect also becomes more pronounced for increasing values of
 $\unicode[STIX]{x1D6FD}$
, and in the
 $\unicode[STIX]{x1D6FD}=2$
case the magnitude of the outer peak in the streamwise velocity fluctuation profile is almost as large as that of the inner peak. An outer peak, which was not present in the ZPG case, also emerges in the other components of the Reynolds-stress tensor, the magnitude of which is proportional to the value of
 $\unicode[STIX]{x1D6FD}$
. Another interesting observation from the Reynolds-stress profiles is the fact that, in the near-wall region, the streamwise and spanwise fluctuation profiles exhibit larger values for progressively stronger APG conditions. This is noticeable already at
 $y^{+}\simeq 2$
, and is related to the influence of the more energetic large-scale motions in the outer part of the boundary layer on the near-wall region. Interestingly, these deviations are not present in ZPG TBLs at large Reynolds numbers, a fact that indicates some differences between the energizing mechanisms in TBLs at increasing
 $Re$
and at increasing
 $\unicode[STIX]{x1D6FD}$
values. Moreover, such differences with pressure gradient are only observed beyond
 $y^{+}\simeq 10$
in the
 $\langle vv\rangle ^{+}$
and
 $\langle uv\rangle ^{+}$
, a fact that is related to the effect of the wall, which inhibits the wall-normal fluctuations. A summary of the boundary-layer parameters from the constant-
 $\unicode[STIX]{x1D6FD}$
cases is provided in table 4, which shows how for the same inner-scaled boundary-layer thickness the
 $Re_{\unicode[STIX]{x1D703}}$
increases with APG, a manifestation of the thickening of the TBL due to its deceleration. The APG also leads to lower skin-friction coefficients (as the boundary layer thickens, the velocity gradient at the wall is reduced), as well as to larger values of the shape factor (connected to the larger displacement thickness resulting from the APG).
Boundary-layer parameters for the cases at matched
 $Re_{\unicode[STIX]{x1D70F}}\simeq 700$
reported in figure 10.

4 Assessment of alternative scaling laws
Due to the significant impact of history effects on the local flow features discussed throughout § 3, here we aim at characterizing the scaling in the configurations with values of
 $\unicode[STIX]{x1D6FD}$
constant over a significant portion of the domain, discussed in § 3.3. As observed by Mellor & Gibson (Reference Mellor and Gibson1966), the constant
 $\unicode[STIX]{x1D6FD}$
configuration is a particular case of a near-equilibrium TBL, and therefore the
 $U_{\infty }(x)$
distribution is also defined by a power law with particular choices of
 $x_{0}$
and
 $m$
. A detailed characterization of constant
 $\unicode[STIX]{x1D6FD}$
cases will ultimately allow to assess pressure-gradient effects with progressively more complex history effects, given by the particular
 $\unicode[STIX]{x1D6FD}(x)$
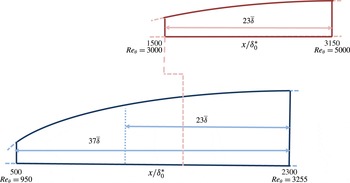
distribution. In figure 11 we show a schematic representation of the
 $b1$
case, and of the region in the computational domain where the constant value of
 $\unicode[STIX]{x1D6FD}=1$
is observed. In this figure it is shown that the
 $\unicode[STIX]{x1D6FD}=1$
region spans from
 $x/\unicode[STIX]{x1D6FF}_{0}^{\ast }=500$
to 2300, which corresponds to a Reynolds-number range of
 $950<Re_{\unicode[STIX]{x1D703}}<3255$
. As discussed in § 2, this corresponds to around 37 averaged boundary-layer thicknesses, where the streamwise average is taken over the constant-
 $\unicode[STIX]{x1D6FD}$
range. This figure also shows the region of constant
 $\unicode[STIX]{x1D6FD}=1$
observed in the simulation by Kitsios et al. (Reference Kitsios, Atkinson, Sillero, Borrell, Gungor, Jiménez and Soria2016), which in their case spans from
 $x/\unicode[STIX]{x1D6FF}_{0}^{\ast }=1500$
to 3150, a range that corresponds to
 $3000<Re_{\unicode[STIX]{x1D703}}<5000$
. Note that although in the simulation by Kitsios et al. (Reference Kitsios, Atkinson, Sillero, Borrell, Gungor, Jiménez and Soria2016) the Reynolds-number range is higher than the one considered in the present study, their region of constant
 $\unicode[STIX]{x1D6FD}$
spans a streamwise distance of only 23 averaged boundary-layer thicknesses, i.e. a distance 1.6 times shorter than the one considered in the present simulation.
—— (Blue) sketch of the
 $b1$
APG TBL case showing the area where a constant value of
 $\unicode[STIX]{x1D6FD}=1$
was obtained, where
 $\unicode[STIX]{x1D6FF}_{0}^{\ast }$
is the displacement thickness of the laminar inflow boundary layer. —— (Red) domain of interest with
 $\unicode[STIX]{x1D6FD}=1$
extracted from the study by Kitsios et al. (Reference Kitsios, Atkinson, Sillero, Borrell, Gungor, Jiménez and Soria2016). The extent of the constant
 $\unicode[STIX]{x1D6FD}=1$
regions are shown in both cases normalized with the averaged boundary-layer thicknesses
 $\overline{\unicode[STIX]{x1D6FF}}$
. The extent of the domain of interest from Kitsios et al. (Reference Kitsios, Atkinson, Sillero, Borrell, Gungor, Jiménez and Soria2016) is also represented in our case. The dashed line connecting both domains indicates the streamwise distance where the region of constant
 $\unicode[STIX]{x1D6FD}$
starts in the simulation by Kitsios et al. (Reference Kitsios, Atkinson, Sillero, Borrell, Gungor, Jiménez and Soria2016), i.e.
 $x/\unicode[STIX]{x1D6FF}_{0}^{\ast }=1500$
.

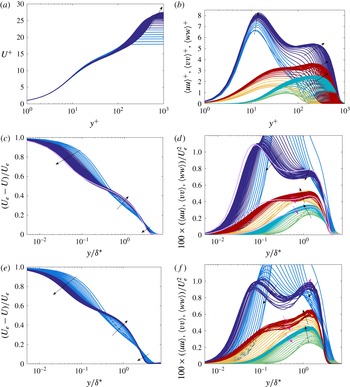
Case
 $\unicode[STIX]{x1D6FD}=1$
: mean streamwise velocity profiles and selected Reynolds-stress tensor components (31 profiles in the range
 $100<x<2300$
) non-dimensionalized by (a,b)
 $u_{\unicode[STIX]{x1D70F}}$
and
 $\ell ^{\ast }=\unicode[STIX]{x1D708}/u_{\unicode[STIX]{x1D70F}}$
, and (c,d)
 $U_{e}$
and
 $\unicode[STIX]{x1D6FF}^{\ast }$
. —— (Dark blue) indicates profiles in the area of constant
 $\unicode[STIX]{x1D6FD}$
for
 $U$
and
 $\langle uu\rangle$
, whereas —— (light blue) denotes profiles where
 $\unicode[STIX]{x1D6FD}$
is not constant. —— (Turquoise) and —— (dark red) denote profiles of
 $\langle vv\rangle$
and
 $\langle ww\rangle$
within the constant
 $\unicode[STIX]{x1D6FD}$
region, whereas —— (light green) and —— (orange) correspond to profiles without constant
 $\unicode[STIX]{x1D6FD}$
. Average of collapsed profiles reported by Kitsios et al. (Reference Kitsios, Atkinson, Sillero, Borrell, Gungor, Jiménez and Soria2016) represented by —— (purple) in (c,d). Case
 $\unicode[STIX]{x1D6FD}=2$
: (e) mean streamwise velocity profiles (23 positions in the range
 $100<x<2300$
), and (f) selected Reynolds-stress tensor components, with same scaling and colour code as in (c,d). The black arrows indicate the evolution of various parts of the profiles with increasing Reynolds number. The magenta arrows are included in the cases where a change in the trend is produced, in which case the magenta arrow indicates the new evolution of the profiles with
 $Re$
.

Figure 12(a,b) shows the inner-scaled mean flow and velocity fluctuations corresponding to case
 $b1$
, schematically discussed in figure 11. The profiles within the region of constant
 $\unicode[STIX]{x1D6FD}=1$
are highlighted in the two panels. The mean flow shows all characteristic features of APG TBLs, as discussed in § 3. Moreover, the velocity fluctuations develop an outer peak in all components, connected with the most energetic structures in the outer region. An alternative scaling for these quantities was considered by Kitsios et al. (Reference Kitsios, Atkinson, Sillero, Borrell, Gungor, Jiménez and Soria2016) in their simulation, based on the displacement thickness
 $\unicode[STIX]{x1D6FF}^{\ast }$
and the local edge velocity
 $U_{e}$
. They observed an apparent collapse of the mean flow and the fluctuations in their region of constant
 $\unicode[STIX]{x1D6FD}$
, which as indicated in figure 11 corresponds to a streamwise distance of approximately
 $23$
integrated boundary-layer thicknesses
 $\overline{\unicode[STIX]{x1D6FF}}$
. In figure 12(c,d) we apply the same scaling to our data: as apparent no such collapse in any of the investigated quantities in our constant
 $\unicode[STIX]{x1D6FD}$
region, which spans a longer streamwise distance of
 $37\overline{\unicode[STIX]{x1D6FF}}$
, is observable. One possible explanation for this discrepancy could be that the scaling considered by Kitsios et al. (Reference Kitsios, Atkinson, Sillero, Borrell, Gungor, Jiménez and Soria2016) does not lead to self-similarity, and since their constant
 $\unicode[STIX]{x1D6FD}$
region is shorter than ours and their
 $Re$
-range spans a shorter fraction of a decade, their streamwise development would be insufficient to reveal this conclusion. The present data exhibit a clear
 $Re$
trend, which is furthermore extended through the higher
 $Re$
data by Kitsios et al. (Reference Kitsios, Atkinson, Sillero, Borrell, Gungor, Jiménez and Soria2016). The failure of the scaling would indeed be in agreement with Townsend (Reference Townsend1956), since in principle the sink flow is the only flow that can be described from the wall to the free stream in terms of a single similarity variable in
 $y$
. It is also interesting to note that recent particle image velocimetry experiments performed in a similar configuration to that of Kitsios et al. (Reference Kitsios, Atkinson, Sillero, Borrell, Gungor, Jiménez and Soria2016), carried out by the same research group (Atkinson et al.
Reference Atkinson, Buchner, Eisfelder, Kitsios and Soria2016), also shows
 $Re$
-dependent profiles of the Reynolds-stress tensor components. These aspects are further explored by analysing the constant
 $\unicode[STIX]{x1D6FD}=2$
case, over a streamwise distance of
 $28\overline{\unicode[STIX]{x1D6FF}}$
. Note that the region of constant
 $\unicode[STIX]{x1D6FD}=2$
found in the
 $b2$
case is located in
 $1000<x/\unicode[STIX]{x1D6FF}_{0}^{\ast }<2300$
. A higher
 $Re_{\unicode[STIX]{x1D703}}$
range is reached in this case, which is more comparable to the one analysed by Kitsios et al. (Reference Kitsios, Atkinson, Sillero, Borrell, Gungor, Jiménez and Soria2016), albeit at a higher value of
 $\unicode[STIX]{x1D6FD}$
. As seen from figure 12(e,f), the scaling by Kitsios et al. (Reference Kitsios, Atkinson, Sillero, Borrell, Gungor, Jiménez and Soria2016) does not lead to self-similarity in this case either. Also here a clear
 $Re$
trend is noticed, supporting the statements presented above, and also the validity of the classic two-layer similarity, at least for the
 $\unicode[STIX]{x1D6FD}$
range under consideration.
5 Conclusions
The present study is focused on the history effects in turbulent near-equilibrium boundary layers with pressure gradients. After defining the near-equilibrium state according to Townsend (Reference Townsend1956), large-eddy simulations were performed over a flat plate to assess the effect of different evolutions of the pressure-gradient parameter
 $\unicode[STIX]{x1D6FD}$
. The adverse pressure gradient was imposed by a varying free stream velocity profile at the top of the domain, i.e. in the free stream. Hereby constant and non-constant pressure-gradient-parameter distributions were achieved. With the constant values of
 $\unicode[STIX]{x1D6FD}$
, turbulent boundary layers at a certain state can be investigated over a certain
 $Re$
-range. In this case, the skin-friction coefficient and shape factor distributions appear nearly parallel to those of their ZPG counterpart, which is a special case of a near-equilibrium (
 $\unicode[STIX]{x1D6FD}=0$
) TBL. An interesting finding was obtained when comparing the mean and Reynolds-stress profiles of the non-constant pressure and constant APG TBLs at matched
 $\unicode[STIX]{x1D6FD}$
and
 $Re_{\unicode[STIX]{x1D70F}}$
. The non-constant
 $\unicode[STIX]{x1D6FD}$
case appears to converge towards the canonical state after a sufficiently long downstream length. For the conditions investigated in the present study, this length is
 $7\overline{\unicode[STIX]{x1D6FF}}_{99}$
, a conclusion that was also confirmed by inspection of the TKE budget.
The history effects were studied not only in flat-plate TBLs, but also in the APG boundary layer developing over the suction side of a NACA4412 wing section. The large structures in the outer region were found to be less energetic (in inner scaling) on the suction side of the wing than in the flow over the flat plate for matched
 $\unicode[STIX]{x1D6FD}$
and
 $Re_{\unicode[STIX]{x1D70F}}$
. The structures were exposed to a lower PG throughout the streamwise development of the boundary layer (compared to the ones over the flat plate), resulting in a less pronounced wake region and a less intense outer region in the Reynolds stresses. The TKE budget also shows some of the reported effects of the APG, such as the higher values in the velocity–pressure-gradient correlation in the buffer and near-wall region or the extra wall dissipation. The comparison between the flow over a wing and the flat plate led to interesting results, such as the fact that the viscous diffusion term is stronger close to the plate than over the surface of the wing at same
 $\unicode[STIX]{x1D6FD}$
. This is due to the stronger wall dissipation resulting from the larger accumulated effect of the
 $\unicode[STIX]{x1D6FD}$
history. One-dimensional spectral density maps indicate that the large-scale structures are energized in APG TBLs compared to ZPG TBLs at matched friction Reynolds numbers. The position of the near-wall spectral peak appears to be independent of the APG.
Although some similarities can be drawn between PG TBLs and high-
 $Re$
ZPG TBLs in terms of the mechanisms by which the large-scale motions are energized, additional work must be carried out over a wide range of Reynolds-number and pressure-gradient conditions in order to clearly assess the combined effect of both on the characteristics of TBLs.
Finally, we investigated the scaling proposed by Kitsios et al. (Reference Kitsios, Atkinson, Sillero, Borrell, Gungor, Jiménez and Soria2016), in which
 $\unicode[STIX]{x1D6FF}^{\ast }$
and
 $U_{e}$
are considered as length and velocity scales. Our results show that this scaling does not lead to self-similar boundary-layer profiles in the constant
 $\unicode[STIX]{x1D6FD}$
region. This conclusion is in agreement with Townsend (Reference Townsend1956), who showed that the sink flow is the only boundary layer exhibiting self-similarity. Although the current flat-plate simulations established long constant
 $\unicode[STIX]{x1D6FD}$
regions, stronger streamwise constant pressure gradients at higher Reynolds numbers should be investigated in order to characterize cases closer to wind-tunnel experiments and general applications.
Acknowledgements
Financial support provided by the Knut and Alice Wallenberg Foundation and the Swedish Research Council (VR) is gratefully acknowledged. The simulations were performed on resources provided by the Swedish National Infrastructure for Computing (SNIC) at the PDC Center for High Performance Computing at KTH Stockholm.