Implications
The aim of this study was to assess the genetic diversity of six Italian chicken breeds in order to define the status of in situ genetic collections and study their conservation potential. The genetic and genomic structure of the six Italian native chicken populations reported here will contribute to design coherent programmes for in vivo and in vitro conservation, valorisation and utilisation of the breeds. As these breeds represent a unique animal resource, these findings will impact the economic value and environmental sustainability of traditional food production.
Introduction
Genetic makeup of populations is the result of a long-term process of adaptation to specific environments and ecosystems and, of artificial selection. Local populations are usually well adapted to environment and capable to express optimal functionality of life cycle events, as reproduction and resistance to diseases despite environmental challenges and, at the same time, to exhibit a good food production (i.e. meat and eggs).
The Food and Agricultural Organization of United Nation (FAO) definition of animal genetic resources eligible for conservation includes animal populations with economic potential, scientific and cultural interest (Food and Agricultural Organization (FAO) of United Nation, 2009). In most of the World about 50% of documented breeds have been classified as extinct, at critical survival or endangered (Hammond, Reference Hammond1996); furthermore 31% of cattle breeds, 35% of pig breeds and 38% of chicken breeds are at risk of extinction. In addition, especially in poultry, local breeds have often been diluted by indiscriminate cross-breeding with imported stocks (FAO of United Nation, 2009). As a consequence, the conservation of domestic animal biodiversity has become a priority to develop sustainable, safe and diversified products and production systems. Considering that the 68% of the 53 Italian chicken breeds were classified as extinct (Zanon and Sabbioni, Reference Zanon and Sabbioni2001), efforts for conservation of the remaining local populations are urgently required. Recently, national initiatives (Mosca et al., Reference Mosca, Madeddu, Mangiagalli, Colombo, Cozzi, Zaniboni and Cerolini2015) have been undertaken in Italy to characterise local populations for resilience and for the nutritional properties of their primary production used as basis of regional food products often related to gastronomic traditions.
In the last decades, microsatellite markers have been used to perform phylogenetic analysis and studies on genetic variability in the chicken breeds (Strillacci et al., Reference Strillacci, Marelli, Cozzi, Colombo, Polli, Gualtieri, Cristalli, Pignattelli, Longeri and Guidobono Cavalchini2009; Al-Qamashoui et al., Reference Al-Qamashoui, Simianer, Kadim and Weigend2014; Ceccobelli et al., Reference Ceccobelli, Di Lorenzo, Lancioni, Monteagudo Ibáñez, Tejedor, Castellini, Landi, Martínez Martínez, Delgado Bermejo, Vega Pla, Leon Jurado, García, Attard, Grimal, Stojanovic, Kume, Panella, Weigend and Lasagna2015). The availability of high-density single nucleotide polymorphism (SNP) arrays has opened the possibility to investigate the genetic structure of a population on a very large number of markers having uniform distribution on all chromosomes. Moreover, these arrays permit to identify and map copy number variants (CNV) on the genome. CNV are distributed over the whole genome in all species, and are defined as large-scale genome mutations ranging from 50 bp to several Mb (Mills et al., Reference Mills, Walter, Stewart, Handsaker, Chen, Alkan, Abyzov, Yoon, Ye, Cheetham, Chinwalla, Conrad, Fu, Grubert, Hajirasouliha, Hormozdiari, Iakoucheva, Iqbal, Kang, Kidd, Konkel, Korn, Khurana, Kural, Lam, Leng, Li, Li, Lin, Luo, Mu, Nemesh, Peckham, Rausch, Scally, Shi, Stromberg, Stütz, Urban, Walker, Wu, Zhang, Zhang, Batzer, Ding, Marth, McVean, Sebat, Snyder, Wang, Ye, Eichler, Gerstein, Hurles, Lee, McCarroll and Korbel2011) compared with a reference genome (insertions, deletions and more complex changes). Involving large genomic regions, CNV may affect gene structure and determine expression and/or regulation gene changes (Redon et al., Reference Redon, Ishikawa, Fitch, Feuk, Perry, Andrews, Flegler, Shapero, Carson and Chen2006). Although CNV were recently mapped in several livestock species (Han et al., Reference Han, Yang, Tian, Wang, Zhang, Wang, Li, Jiang and Kang2014; Schiavo et al., Reference Schiavo, Dolezal, Scotti, Bertolini, Calò, Galimberti, Russo and Fontanesi2014; Bagnato et al., Reference Bagnato, Strillacci, Pellegrino, Schiavini, Frigo, Rossoni, Fontanesi, Maltecca, Prinsen and Dolezal2015), their use as markers to explain intra-breeds genetic diversity has been explored only in few species (Gazave et al., Reference Gazave, Darré, Morcillo-Suarez, Petit-Marty, Carreño, Marigorta, Ryder, Blancher, Rocchi, Bosch, Baker, Marquès-Bonet, Eichler and Navarro2011; Xu et al., Reference Xu, Hou, Bickhart, Zhou, Hay, Song, Sonstegard, Van Tassell and Liu2016).
The aim of this study was to analyse the genomic and genetic variation in order to describe the existing variability among individuals of six Italian chicken breeds using both SNP and CNV as markers. We will then test the hypothesis that genetic variation exists among the six breeds considered in this study, highlighting that the new knowledge gained thanks to high throughput genotyping (SNP, CNV) strongly contribute to the characterisation of genetic diversity among them. The knowledge of the genetic structure of these breeds may be used to preserve the genetic variability and the phenotypic features peculiar of each population.
Material and methods
Sampling and genotyping
In this study, six Italian chicken breeds were used: Livornese (LI) from Tuscany, Milanino (MI) and Mericanel della Brianza (MB) from Lombardy, Bionda Piemontese (PI) and Bianca di Saluzzo (SA) from Piedmont and Siciliana (SI) from Sicily (Supplementary Tables S1 and S2). All the populations are ancient Italian breeds except the composite MI. The MB is the only Italian bantam breed, with an official recognised standard.
In total, 96 blood samples (16 per breed) were randomly selected among blood bio-banks (stored in 0.5 M ethylenediaminetetraacetic acid at −20°C) representative of flock nucleus conserved within the universities of Milano, Torino and Pisa. Genomic DNA was isolated using the NucleoSpin® Blood kit (Macherey-Nagel GmbH & Co. KG, Düren, Germany) according to the manufacturer’s instructions. DNA concentration was determined with the Qubit® dsDNA HS Assay kit (Invitrogen™, Carlsbad, CA, USA) using the proper Qubit® fluorometer (Thermo Fisher Scientific Inc., Waltham, MA, USA); purity was assessed through the evaluation of A260/280 and A260/230 ratios on the Infinite® 200 PRO NanoQuant spectrophotometer (Tecan Trading AG, Switzerland) and integrity verified running samples E-Gel® 48 Agarose Gels, 1% (Invitrogen).
All DNA samples were genotyped using the Axiom® Genome-Wide Chicken Genotyping Array (Affymetrix, Thermo Fisher Scientific Inc.) including 580 961 SNP markers, distributed across the genome with an average spacing of 1.7 Kb (galGal4 assembly). Axiom™ Analysis Suite software (Affymetrix, Thermo Fisher Scientific Inc.) was used to run raw intensity data Quality Control and Genotyping Algorithms. Default quality control settings were applied to filter for low-quality samples before running the genotyping analysis. Axiom CNV summary tool was used to generate input files for CNV prediction analysis software.
Single nucleotide polymorphism analyses
SNP allele frequencies, expected (H e) and observed (H o) heterozygosity were computed separately for each breed using the PEAS software (Xu et al., Reference Xu, Guputa and Jin2010). Genetic diversity within and among breeds was determined estimating the Wright’s F-statistics fixation index (F ST) and inbreeding coefficient of an individual relative to a subpopulation (F IS) on SVS Golden Helix software 8.3.1 (Golden Helix Inc., Bozeman, MT, USA) (SVS). The genetic structure of Italian chicken populations was analysed using:
-
(i) SVS: principal component analysis (PCA) based on SNP allele frequencies.
-
(ii) ADMIXTURE ver. 1.3.0 software (Alexander et al., Reference Alexander, Novembre and Lange2009): population structure analysis with a number of ancestral populations K that ranged from two to eight. To evaluate optimal number of ancestors, cross-validation error values were computed for each K using a fivefold cross-validation procedure, as reported by Nicoloso et al. (Reference Nicoloso, Bomba, Colli, Negrini, Milanesi, Mazza, Sechi, Frattini, Talenti, Coizet, Chessa, Marletta, D’Andrea, Bordonaro, Ptak, Carta, Pagnacco, Valentini, Pilla, Ajmone-Marsan and Crepaldi2015). Each inferred chicken population structure was visualised using an R script.
-
(iii) PEAS software: individual tree using Neighbour-Joining (NJ) algorithm. The NJ tree, constructed based on the allele sharing distance as the genetic distance between individuals, was graphically represented using FigTree version 1.4.2 (Rambaut, Reference Rambaut2014).
Copy number variants and copy number variants region analyses
Both the log R ratio (LRR) and the B-Allele Frequency (BAF) values of each sample were obtained from the Axiom® CNV Summary Tool software. LRR and BAF were used in the individual-based CNV calling performed by PennCNV software (Wang et al., Reference Wang, Li, Hadley, Liu, Glessner, Grant, Hakonarson and Bucan2007) on chromosomes 1 to 28, using the default parameters of the HMM: SD of LRR <0.30, BAF drift as 0.01 and waviness factor at 0.05. The CNV regions (CNVR) were defined in each breed using the BedTools software, through merging overlapping CNV by at least 1 bp, as described by Redon et al. (Reference Redon, Ishikawa, Fitch, Feuk, Perry, Andrews, Flegler, Shapero, Carson and Chen2006).
Clustering analysis using copy number variants region
A clustering analysis for all samples was performed considering the identified CNVR as genetic makers (Tian et al., Reference Tian, Wang, Gu, Feng, Fang, Hu and Li2013). A scoring matrix of the CNVR data was built by encoding a value of ‘0’ or ‘1’ according to the absence or presence for each individual of any mapped CNV in the pertinent CNVR. A hierarchical agglomerative clustering was applied on the scoring matrix using the pvclust function from the pvclust R package (Suzuki and Shimodaira, Reference Suzuki and Shimodaira2006). Multiscale bootstrap resampling was applied to calculate the Approximately Unbiased P-value (AU-P) using 10 000 bootstraps to assess the robustness of branches. Agglomerative method chosen was Unweighted Pair Group Method with Arithmetic mean.
Results and discussion
Single nucleotide polymorphism analyses
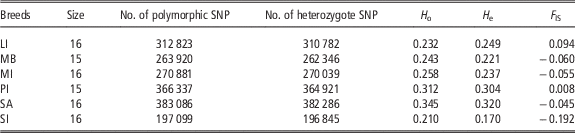
SNP analyses and the CNV detection were performed on 94 quality-filtered samples, as two samples belonging to MB and PI breeds were discarded for low raw signal intensity. SNP with minor allele frequency value ⩽0.01, SNP with Hardy–Weinberg equilibrium ⩽0.00001, SNP not on first 28 autosomal chromosomes and SNP having a call rate <99% were excluded, reducing to 412 336 SNP markers the number of loci used in the analysis. The number of polymorphic sites within breed ranged from 197 099 (47.8%) to 383 086 (92.8%) for SI and SA, respectively (Table 1).
Single nucleotide polymorphism (SNP) statistics, observed heterozygosity (H o), expected heterozygosity (H e) and inbreeding coefficient (F IS) values for the six Italian chicken populations

LI=Livornese; MB=Mericanel della Brianza; MI=Milanino; PI=Bionda Piemontese; SA=Bianca di Saluzzo; SI=Siciliana.
For each breed, the effective number of polymorphic SNP (number of SNP in which at least one heterozygous individual was identified) represents >99% of polymorphic sites (Table 1). The H o and H e ranged from 0.210 and 0.170 (SI) to 0.345 and 0.320 (SA), whereas the F IS values ranged from −0.192 (SI) to 0.094 (LI). The SI H o and H e values (0.210; 0.170) reflect the highest percentage of monomorphic SNP (52.2%) and the low variability within the breed. On the contrary, the SA breed has a low F IS value (−0.045) and the highest H o and H e values confirming results previously obtained by Sartore et al. (Reference Sartore, Sacchi, Soglia, Maione, Schiavone, De Marco, Ceccobelli, Lasagna and Rasero2016) using microsatellite markers.
In the LI breed, despite the high percentage of polymorphic SNP (75.9%), the H o and H e values are quite low (0.232 and 0.249), although the F IS value (0.094) indicates a low level of inbreeding. Ceccobelli et al. (Reference Ceccobelli, Di Lorenzo, Lancioni, Monteagudo Ibáñez, Tejedor, Castellini, Landi, Martínez Martínez, Delgado Bermejo, Vega Pla, Leon Jurado, García, Attard, Grimal, Stojanovic, Kume, Panella, Weigend and Lasagna2015) reported for the same breed similar F IS value and higher H o and H e values obtained using microsatellites data. The low genetic variability measured in both LI and SI birds is suggested to be related to the small size of the population under conservation for many years, situation generally known to be associated with relevant value of inbreeding. The H o and H e values for the bantam breed MB (0.243 and 0.221) are lower than those obtained by Tadano et al. (Reference Tadano, Nishibori, Nagasaka and Tsudzuki2008) on Japanese bantam breeds using a panel of 40 microsatellites. The F IS value for MB (−0.060) is very low and quite similar to that identified in the Japanese Bantam breed Tosa-Jidori (Tadano et al., Reference Tadano, Nishibori, Nagasaka and Tsudzuki2008).
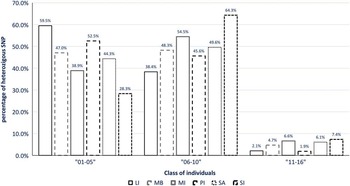
Except for LI and PI, the negative F IS values detected in all other breeds reflect an excess (increasing) of heterozygosity, probably due to outbreeding (Tadano et al., Reference Tadano, Nishibori, Imamura, Matsuzaki, Kinoshita, Mizutani, Namikawa and Tsudzuki2007). The heterozygous SNP were classified into three classes according to the number of individuals resulted heterozygous at the same locus: ‘01 to 05’, ‘06 to 10’ and ‘11 to 16’. In fact, for MB, MI, SA and SI breeds (MB=4.7%, MI=6.6%, SA=6% and SI=7.4%) respect to LI and PI (LI=2.1%, PI=1.8%) a higher proportion of SNP were heterozygous in >10 samples (class ‘11 to 16’) (Figure 1). The same distribution applies for class of individuals ‘6 to 10’. On the contrary, if we consider the class of individuals ‘1 to 5’ the two breeds LI and PI are those with the largest proportion of heterozygous SNP. This behaviour in SNP heterozygous loci agree well with the F IS values found here.
Proportion of heterozygous single nucleotide polymorphism (SNP) classified into three classes according to the number of individuals resulted heterozygous at the same locus: ‘01-05’, ‘06-10’ and ‘11-16’. LI=Livornese, MB=Mericanel della Brianza, MI=Milanino, PI=Bionda Piemontese, SA=Bianca di Saluzzo and SI=Siciliana.

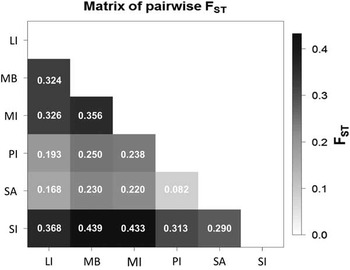
The pairwise fixation indexes (F ST) among the six Italian chicken breeds are presented in Figure 2. The F ST values range from 0.082 (PI v. SA) to 0.439 (SI v. MB). The largest differences were between the SI breed and the other populations, with F ST values ranging from 0.290 (SA) to 0.439 (MB). The F ST values >0 can be related to the effect of genetic isolation respect to the other populations, which can lead to homozygous excess over time. As expected by their origin (i.e. same geographical region), the PI and SA breeds are closely related (F ST=0.082) and their F ST values against the other populations are very low. Sartore et al. (Reference Sartore, Sacchi, Soglia, Maione, Schiavone, De Marco, Ceccobelli, Lasagna and Rasero2016) considered PI as the ancestral population of the present day SA. These authors also report a similar F ST value for the same breeds using a panel of 32 microsatellite markers.
Matrix of pairwise fixation index F ST among the six Italian chicken breeds. LI=Livornese, MB=Mericanel della Brianza, MI=Milanino, PI=Bionda Piemontese, SA=Bianca di Saluzzo and SI=Siciliana.

The MI breed is relatively similar to PI and SA and differs from all other breeds in terms of genetic structure (Figure 2). The bantam breed MB differs from the MI and LI breeds (F ST=0.356 and F ST=0.324), but is relatively similar to the Piedmont PI and SA breeds (F ST=0.250 and F ST=0.230). MB is a very common breed in north-east of Milan, and it is still not possible to determine the period in which this breed appeared. The breed anyhow is reported to derive from dwarf rural chickens diffused in small rural farms at the beginning of last century (Ceppolina, Reference Ceppolina2015).
The overall F ST value found across all breeds is 0.253, indicating that 25.3% of the genetic variation is explained by the breed differences, whereas the remaining 74.7% of the variance describes the differences among individuals. This value is >0.15 considered by Frankham et al. (Reference Frankham, Ballou and Briscoe2004) as an indicator of significant differentiation among populations. The genetic variability of local breeds here highlighted must be considered an important genetic resource as indicated by Muir et al. (Reference Muir, Wong, Zhang, Wang, Groenen, Crooijmans, Megens, Zhang, Okimoto, Vereijken, Jungerius, Albers, Lawley, Delany, MacEachern and Cheng2008). In fact, they reported in a recent analysis using SNP markers, that commercial pure line showed a substantial decrease of genetic diversity compared with non-commercial chicken populations.
The overall F ST value identified here is similar to the previous reported using microsatellites markers in commercial chicken lines (Tadano et al., Reference Tadano, Nishibori, Imamura, Matsuzaki, Kinoshita, Mizutani, Namikawa and Tsudzuki2007), British (Wilkinson et al., Reference Wilkinson, Wiener, Teverson, Haley and Hocking2011) and Mediterranean chicken breeds (Ceccobelli et al., Reference Ceccobelli, Di Lorenzo, Lancioni, Monteagudo Ibáñez, Tejedor, Castellini, Landi, Martínez Martínez, Delgado Bermejo, Vega Pla, Leon Jurado, García, Attard, Grimal, Stojanovic, Kume, Panella, Weigend and Lasagna2015). In contrast, lower F ST values were reported in Japanese, Italian and Swedish local populations (Tadano et al., Reference Tadano, Nishibori, Nagasaka and Tsudzuki2008; Zanetti et al., Reference Zanetti, De Marchi, Dalvit and Cassandro2010; Abebe et al., Reference Abebe, Mikko and Johansson2015). The higher chicken F ST values, highlighted the larger genetic variability of chicken populations, respect to the one found in other livestock species. For instance, Wang et al. (Reference Wang, Chen, Yang, Liao, Zhao, Zhang, Chen, Zhang, Xue, Yang, Zheng, Wang and Pan2015) reported a F ST value of 0.149 in Chinese pig breeds and Makina et al. (Reference Makina, Muchadeyi, van Marle-Köster, MacNeil and Maiwashe2014) a F ST value of 0.149 in South Africa cattle breeds.
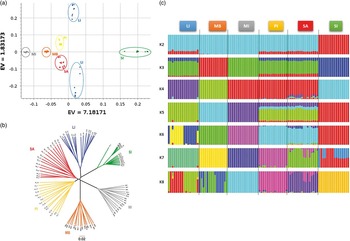
The PCA (Figure 3a) disclosed genetic differences among the six breeds and show that all individuals are well clustered by breed. The canonical variable plotted on the y-axis explained 1.93% of the overall SNP variance. On this axis, the LI breed is clearly separated in two different groups according to bird’s feather colour (black upper group and white lower group) as well as the PI and SA breeds create two separated clusters closely related. The origin of LI breed is not so clear, probably from Central Italy, obtained from the selection of light chicken reared in Tuscany region. LI is worldwide spread with different colours of livery: black, white and brown (light and dark) (Ceppolina, Reference Ceppolina2015) and selected according to colour differences for decades.
Population genetic analyses of the six Italian chicken breeds (LI=Livornese, MB=Mericanel della Brianza, MI=Milanino, PI=Bionda Piemontese, SA=Bianca di Saluzzo and SI=Siciliana): (a) Scatter plot (EV=Eigenvalues of canonical variables) from a principal component analysis analysis based on SNP frequencies. (b) Neighbour-Joining dendrogram constructed using genetic sharing distances. (c) Admixture plot for all Italian chicken breeds analysed based on different number of assumed ancestors (K).

The distinction among breeds was clearly displayed on the canonical variable plotted as x-axis representing 7.18% of the SNP variance. The SI breed is a distinct group, confirming results of F ST values. In fact, this breed appears to derive from ancient inter-breeding of local Sicilian birds with North African sock (Ceppolina, Reference Ceppolina2015). The PCA plot shows the division of SI samples in three sub-groups. The major distance was identified between MI and SI breeds.
The results of the NJ analysis (Figure 3b), are consistent with those obtained by the PCA. The NJ dendrogram suggests the presence of three distinct clusters: cluster 1 includes the closely related PI and SA breeds (originating in Piedmont), cluster 2 includes the two varieties of LI breed and SI and cluster 3 includes MI and MB breeds (originating in Lombardy).
An increasing number of assumed ancestors, from K=2 to 8 was used for global admixture analysis done by the ADMIXTURE software. The graphical representation of the estimated ancestor fractions in individual genomes is shown in Figure 3c. In fact, at K=2 two distinct ancestors are represented by SI and MB+MI, whereas LI, PI and SA genomes seem to include a major fraction of the MB+MI ancestor and a minor fraction the SI ancestor. K=3 and 4 split MB from MI, and the above three composite breeds now had a major MI and minor MB and SI ancestor components. A similar albeit more complicate figure was kept by K=5. Based on agreement with the PCA and CNV analyses, the ADMIXTURE software identified K=6 as the most probable number of common ancestors of our samples. At K=6, MI, MB and SI breeds grouped again into independent ancestors, and the LI breed appears to be divided into two genetically distinguishable sub-groups, confirming both PCA results and CNV cluster analysis.
Independently of the K number, individuals belonging to the PI and SA breeds seem to share the same ancestors composition, but when K increased to seven they separated in two distinct groups, while retaining some common genetic features. At K=8 almost all breeds (except for MB) returned to show the same genetic features identified at smaller Ks. It is interesting to note that all the grouping strategies identify the MI breed as distinct from the other genetic groups: this is representative of the selection history of the breed initiated at the beginning of 20th century by crossing Valdarnese Bianca males to Horpington females (Mosca et al., Reference Mosca, Madeddu, Mangiagalli, Colombo, Cozzi, Zaniboni and Cerolini2015).
Copy number variants and copy number variants region analyses
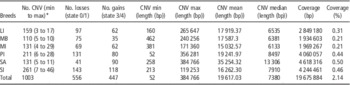
In Table 2, the frequency of CNV identified, the mean and median values, as well as the CNV coverage per each breed compared with the chicken assembly autosomes are reported. In all breeds, the number of losses (state 0 and 1) is higher than the number of gains (state 3 and 4), except for the SA breed. This is indicated by the deletions/duplications ratios calculated as the total number of losses divided by number of gains: 1.56, 2.14, 1.11, 1.63, 1.12 and 0.45 for LI, MB, MI, PI, SI and SA, respectively. The majority of CNV (i.e. 91% among all breeds) identified in this study, have a length between 1 and 100 Kb representing a proportion over the total number of CNV of 87.7% in the MI to 95.4% in the SI.
Descriptive statistics of copy number variant (CNV) identified for each breed

LI=Livornese; MB=Mericanel della Brianza; MI=Milanino; PI=Bionda Piemontese; SA=Bianca di Saluzzo; SI=Siciliana.
*Min to max=minimum and maximum number of CNV for individual.
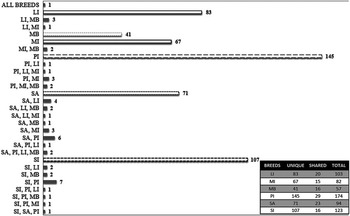
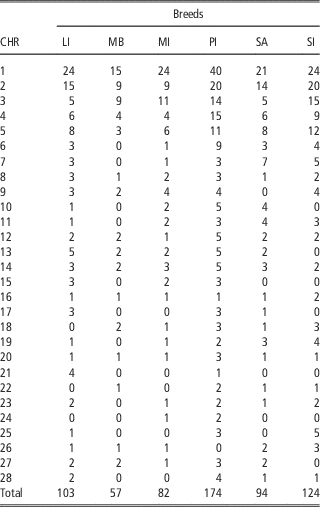
A total of 564 unique CNVR (344 gains, 213 losses and seven complex) were found among all breeds. These CNVR covered a total of 9.43 Mb of sequence length corresponding to 1.03% of the chicken galGal4 assembly autosome. The total number of CNVR detected for each breed is 103 in LI, 57 in MB, 82 in MI, 174 in PI, 94 in SA and 123 in SI (Figure 4 and Supplementary Table S3). Table 3 shows the number of CNVR for each breed by chromosome. With the exception of chr21 and chr24, which contain CNVR identified only in two breeds (LI-PI and MI-PI, respectively), all other autosomes include CNVR from at least three breeds. CNVR on chromosomes 1, 2, 3, 4, 5, 8, 12, 14, 16 and 20 have been identified in all breeds. In the PI breed, the identified CNVR map on all chromosomes, with the exception of the chr26, whereas the CNVR identified in the LI breed are distributed on only 12 autosomes.
Intra (unique) and inter (shared) breed variation of copy number variant region in the six Italian chicken populations (LI=Livornese, MB=Mericanel della Brianza, MI=Milanino, PI=Bionda Piemontese, SA=Bianca di Saluzzo and SI=Siciliana).

Descriptive statistics of copy number variant region (CNVR) identified for each breed by chromosome (CHR)

LI=Livornese; MB=Mericanel della Brianza; MI=Milanino; PI=Bionda Piemontese; SA=Bianca di Saluzzo; SI=Siciliana.
Among the identified CNVR, 426 (75%) were present in a single individual (singleton), 61 (10%) in two individuals, 23 (4%) in three individuals, 14 (2%) in four individuals and 40 (7%) in more than five individuals. The high proportion of the singleton has been previously reported by Yi et al. (Reference Yi, Qu, Liu, Yan, Xu and Yang2014) (68.8%) and by Han et al. (Reference Han, Yang, Tian, Wang, Zhang, Wang, Li, Jiang and Kang2014) (76.5%), confirming that segregating CNV exist among individuals. The CNVR on chr16 at 215 410 to 330 020 bp was identified in 31 samples across all six chicken breeds (at least two samples per breed) as well as in chicken populations analysed by the latter above-cited authors.
Comparison of the CNVR in the six breeds (Figure 4) reveals that the number of CNVR shared among the breeds ranged from 15 (MI v. others) to 29 (PI v. others), whereas the number of intra-breed shared CNVR (mainly contributed by single sample variations) ranged from 41 (MB) to 145 (PI). Considering the CNVR identified by CNV common to individuals of different breeds, the most frequent combinations are: SI-PI (n=7) and SA-PI (n=6). Adding to these combinations those including other breeds, it gives a total of 11 and 10 CNVR common to SI-PI and SA-PI, respectively (Figure 4).
Despite recent studies on CNV in chicken have showed their role in metabolic pathways and their association with innate and adaptive immunity, morphological traits, developmental defects or disease susceptibility (Wang et al., Reference Wang and Byers2014; Yan et al., Reference Yan, Yang, Cheng, Song and Qu2015), the actual knowledge on CNV and their full role in the genomic expression is still limited and do not permit to understand the specific function of CNV here found.
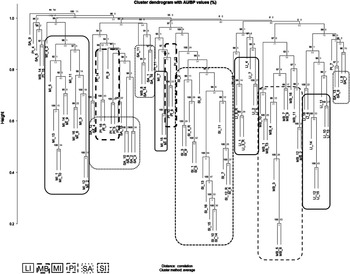
Figure 5 shows the cluster-tree built for the six chicken breeds based on CNVR similarities. In the plot, the branch length is not directly proportional to the genetic distance estimated among samples. The AU-P and Bootstrap Probability value (BP-P) were shown for each node, as well as the edge numbers. We focussed on the AU-P because the BP-P is considered less accurate than AU-P and according to Suzuki and Shimodaira (Reference Suzuki and Shimodaira2006) the cluster (edges) with AU-P >95% are the most plausible.
Dendrogram generated by clustering all individuals of the Italian chicken breeds (LI=Livornese, MB=Mericanel della Brianza, MI=Milanino, PI=Bionda Piemontese, SA=Bianca di Saluzzo and SI=Siciliana) based on their copy number variant similarities. (i) approximate unbiased (AU) P-value in dark grey colour, (ii) bootstrap probability (BP) value in grey colour, (iii) edge in light grey colour.

Edge numbers represent the order in which the clusters were built. More closely related samples have a smaller edge numbers, whereas higher edge numbers reflect clusters formed later in the breed evolutionary process. As shown in the plot, all samples of SI and almost all samples of MB were assigned to a single breed-cluster. The MI and LI samples are grouped in two distinct clusters each. Instead for PI and SA breeds, three and four clusters were identified respectively, two of which include samples belonging to both breeds.
Conclusion
This research represents a first approach to evaluate the genetic variability and diversity within and between six Italian chicken populations using SNP and CNV markers. The results highlight the existence of genetic variability and a low inbreeding coefficient in all Italian chicken breeds considered. Notably, the pairwise fixation indexes, the PCA and the NJ trees all show the clear separation of the SI breed from the others and in the LI, the presence of two distinct groups corresponding to the white and black varieties. In addition, PI and SA resulted closely related, highlighting the geographic common origin. The genetic variability found using SNP is comparable with the one reported by other authors in the same breeds, using microsatellite markers. In addition, the CNV markers analysis have well separated the breeds in terms of genetic identity, according to their breeding history.
Some of the CNV interestingly maps in chromosomal regions where important functional genes are annotated (e.g. the major histocompatibility complex region on chromosome 16). A follow-up analysis may further investigate functional association between CNV and genes.
Results of this study represent a basis for the Italian chicken population’s valorisation as an important reservoir of genetic diversity. In Italy, Avian Research Units within Academic infrastructures are currently involved in in situ conservation programmes of Italian poultry populations. Efforts to maintain genetic variability have been implemented and the small poultry flocks available need to be continuously monitored to avoid the loss of biodiversity.
As a conclusion, this manuscript confirm the existence of genetic and genomic variability in the Italian chicken populations suitable for their maintenance and genetic improvement. To enhance this process it is advisable that other researches on a larger population sample disclose the association between SNP and CNV markers with phenotype expression of quantitative traits.
Acknowledgements
This study was co-funded by project no. M01678 – Minister of Foreign affairs of Italy and Mexico.
Supplementary material
To view supplementary material for this article, please visit https://doi.org/10.1017/S1751731116002135