Implications
Despite the need to increase genetic gain in Nguni cows, accurate early selection of replacement heifers is a challenge due the lengthy time interval required to assess fertility traits, such as calving interval, age at first calving and longevity. Determination of the relationships between linear traits and fertility in heifers and cows can help achieve early indirect selection of breeding females. The relationships are used to make judgements on the reproductive ability of cows and/or heifers at an early age. Selection of heifers at an early age will help decrease generation intervals and increase genetic gain.
Introduction
Reproductive performance is the major determinant of the profitability of any cow–calf beef enterprise (MacGregora and Casey, Reference MacGregora and Casey1999). Hence, improving fertility is the prime aim of most beef producers globally. Longevity, calving interval (CI) and age at first calving (AFC) are among the most important indicators of fertility in cows (Cammack et al., Reference Cammack, Thomas and Enns2009). Cows that calve early tend to have short CIs and stay in the herd for long and produce more calves in their reproductive life. Cow fertility in extensive production systems in rangelands is strongly influenced by environmental factors such as variability in pasture quality and tropical diseases (Mackinnon et al., Reference Mackinnon, Hetzel and Taylor1989). Small-framed indigenous breeds, such as the Nguni, exhibit high reproductive fitness under poor nutritional conditions of Sub-Saharan Africa (Ndlovu et al., Reference Ndlovu, Chimonyo, Okoh, Muchenje, Dzama and Raats2007). Under the Sub-Saharan African conditions, small-framed Nguni cattle reach puberty at younger age (about 16 months) and have shorter CI (about 370 days) compared with larger framed beef breeds such as the Drakensberger and Bonsmara (Maciel et al., Reference Maciel, Amimo, Martins, Mwai, Scholtz and Neser2011). As a result of their reproductive fitness, small-framed breeds such as Nguni, Bonsmara and the Tuli have gained ground in modern Sub-Saharan beef population (Strydom, Reference Strydom2008). It is the Nguni breed which has gained enormous popularity in recent years because of its adaptive traits and multiple colours (Mapiye et al., Reference Mapiye, Chimonyo, Dzama, Raats and Mapekula2009).
The major challenge with selection for fertility traits is that the time interval required to record traits such as CI is long. This reduces the amount of available data, lengthens generation interval and decreases the reliability of the data for heifers and young cows. Increasing efficiency of cow–calf enterprises requires improvement of fertility of both cows and replacement heifers. Considering that fertility traits are expressed late in cows, predicting heifer performance at an early age is difficult. Pedigree selection requires intensive record keeping and pedigree records are difficult where artificial insemination is not used. Considering that large time interval is required to record longevity, CI and AFC, record keeping is slow, tedious, time consuming and expensive, early selection of replacement heifers is a challenge. Nguni farmers rarely record longevity and stayability mainly because they are expressed late in life. There is need to consider other ancillary traits which can be more easily measured early in the cow’s life.
The Nguni Society of South Africa encourages farmers to put accent on visual appraisal for conformation traits to maximise fertility in Nguni cows but there is no proper linear trait recording programme. Linear type traits considered by Nguni farmers when selecting cows include body depth, flank circumference, heart girth circumference, body stature and length of the cow. Linear measurements are associated with both production and non-production traits in cows, and thus with production efficiency (Berry et al., Reference Berry, Buckley, Dillon, Evans and Veerkamp2004). In dairy cows, there is both phenotypic and genetic relationship between the linear traits and reproductive performance (Larroque and Ducrocq, Reference Larroque and Ducrocq2001). Although both phenotypic and genetic relationships between linear traits and fertility traits have been established for large-framed dairy cows (Berry et al., Reference Berry, Buckley, Dillon, Evans and Veerkamp2004), no studies have been conducted in Nguni cows. Common rangeland types supporting Nguni cattle production include grassland, succulent karoo, bushveld and thornveld (Mohammed-Saleem, Reference Mohammed-Saleem1995). It is not clear how the different rangeland types affect the phenotypic relationships between linear and fertility traits. Owing to differences in frame sizes and production systems, the relationships in dairy and Nguni cows are expected to differ.
There is need to determine the relationships between linear type traits and fertility before basing selection decisions on linear traits with the intention of enhancing fertility in Nguni cows. Considering that there are no recording programmes yet, immediate determination of genetic correlations between linear traits and fertility could be a challenge since it requires accurate pedigree information. Determining the phenotypic relationships among linear traits and fertility traits can then justify investigating whether the relationships are genetically controlled.
One of the main challenges which could be faced in using linear type traits in selection programmes is the high number of linear traits that are involved and the high correlations among them. Large phenotypic correlations ranging from 0.40 to 0.81 have been reported among body linear traits such as depth, body stature, body length and flank circumference in beef and dairy cows (Mantovani et al., Reference Mantovani, Cassandro, Contiero, Albera and Bittante2010; Toghiani, Reference Toghiani2011; Mazza et al., Reference Mazza, Guzzo, Sartori, Berry and Mantovani2013). The strong correlations between most of the linear type traits suggest that there is redundancy and, thus some of these traits can be removed from possible linear type traits classification schemes. Given the apparent redundancy between the linear type traits, it is likely that all the linear traits which are considered during selection of cows do not really measure different constructs. There is, therefore, need to combine these linear traits into smaller number of variables that describe fertility. After grouping them into factors, association between the linear traits and fertility can be easily analysed without redundancy and collinearity.
Once the phenotypic relationship between linear traits and fertility traits is ascertained, the reproductive ability of cows and/or heifers can be judged at an early age. As pedigree information become available, genetic correlations will be needed, so as to estimate correlated genetic response. Coupled with the use of records to directly select for reproductive traits such as CI and AFC, use of linear traits as indirect measures for fertility facilitates the selection of heifers at an early age. The objectives of the current study were to assess the reduction in dimensionality of seven linear type traits and to determine the phenotypic relationships between extracted factors and fertility traits in Nguni cows.
Materials and methods
Study site
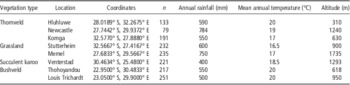
The study was conducted on Nguni cows kept under four distinct vegetation types in South Africa. Farms were selected from each vegetation type using stratified random sampling technique. Table 1 shows the identities of the vegetation types, farms, climatic conditions and the number of cows from each farm. Owing to their adaptability to the local environment, the cows were raised on natural veld without any additional feeds such as protein concentrates, minerals and feed additives. The selection of farms was based on vegetation type and the willingness of the farmers to participate in the study. For all farmers who participated in the study, bulls were left with the herd all the time.
Identities of vegetation type, climatic conditions and the number of cows from each vegetation type

Data collection
A total of 1559 cows from parity 3 to 8 were used. Trained personnel visited identified farms and measured linear type traits on each of the cows between December 2012 and November 2013. Measurements were taken between 0700 and 1000 h before cows had started grazing. The measurements taken were body stature, body depth, heart girth, flank circumference, navel height and body length. The body stature was measured from top of the spine in between hips to the ground. Body depth was measured as distance between the top of spine and bottom of barrel at last rib (the deepest point) measured from the left side of the cow. Heart girth was defined as circumference of the body taken just behind the shoulders. Flank circumference was defined as the perimeter of the body taken just in front of the hook bones. Navel height was measured from the ground to the navel of the cow. Body length was measured from the hindmost part of the animal to the valley in front of the second thoracic vertebrae just ahead of the center of the shoulders (Funk et al., Reference Funk, Hansen and Funk1991). Body condition score (BCS) for each cow was also estimated. Visual assessment of the body condition was made using the nine-point European system, in which a score of 1 was emaciated, and a score of 9 was obese.
Body depth, heart girth, body length and flank circumference were measured in centimetres using a plastic tape measure. An aluminium extending measuring stick was used to measure navel height and body stature. All measurements were taken by the same individual. Since scales of measurements of the linear traits were different, each of the six traits (body stature, body length, heart girth, navel height, body depth and flank circumference) were scored on a scale of 1 to 9, inclusive, according to extremes of the direct measurements for analysis purposes. For example, for body depth, a score of 1 meant the cow was among those with shallowest bodies and a score of 9 meant the cow was among those with deepest bodies in the sample. In addition to linear traits measurement, the following records were taken: date of birth, parity of cow and calving date. The age of the cow at classification, days to last calving (DLC), AFC and CI were computed from the collected records. The AFC was calculated as the period, in days, between the heifer’s birth date and its first calving date. Cows with AFC >540 days and <1460 days were included in the analyses. The CI was calculated as the period, in days, between two successive calvings. CIs between 300 and 730 days were considered in the analyses. The DLC was calculated as the period between the last date of calving and date of linear trait measurement. The experiment was approved by the University of KwaZulu-Natal Animal Ethics Sub-Committee (Ref 078/13/Animal).
Statistical analyses
The seven linear type traits were included using the correlation matrix between the traits to ensure that all traits were standardized in the analysis (Vucasinovick et al., Reference Vukasinovic, Moll and Kunzi1997). The matrix of partial correlations, Kaiser’s measure of sampling adequacy (MSA) and Bartlett’s sphericity test were used to determine the degree of interrelations between variables and adequacy for use in factor analysis. Factors were chosen based on the Kaiser’s eigenvalue rule which states than only factors with eigenvalues >1 are considered and Scree test. On the Scree test, the point where the graph begins to become horizontal was considered indicative of the maximum number of factors to be extracted (Hair, Reference Hair2009). Factors were rotated using varimax rotation. The factor weights of >0.58 were considered to indicate a significant correlation between traits and factors. The statistical analyses were carried out using PROC FACTOR (SAS, 2008) using the Maximum Likelihood method to reduce the dimensionality and reduce the information in a group of P original variables Z1, Z2,...Zp, to a new group of variables Y1 (F1), Y2 (F2), …, Yp (Fp). The effects of vegetation type and parity of cow on extracted factors was analysed using the GLM procedures (SAS, 2008). Days from last calving and age of cow at classification were fitted as covariates. The DLC, a good indicator of the reproductive status in Nguni cows, was used to adjust for the reproductive status of the cows at classification. The model used was:
 $$[(X{\minus}\bar{X})_{{n1}} {\plus}(X{\minus}\bar{X})_{{n2}} {\plus}\,\ldots\,{\rm }(X{\minus}\bar{X})_{{np}} )]_{{ijkl}} =\mu {\plus}P_{i} {\plus}V_{j} {\plus}\beta _{{\rm 1}} \left( D \right){\plus}\beta _{{\rm 2}} \left( A \right){\plus}E_{{ijk}} $$
where n is the observations of the p common factor scores; µ the population mean common to all observations; P i the effect of the ith parity of cow; V j the effect of the jth vegetation type; β 1 (D) the partial linear regression coefficients of the dependent variables on covariate days from last calving; β 2 (A) the partial linear regression coefficients of the dependent variables on covariate age of cow at classification; E ijk the residual error~N (0; Iσ 2).
The PROC REG (SAS, 2008) was used to test whether the phenotypic relationships between AFC and CI and extracted factors were linear, quadratic or exponential. The Pearson correlations among AFC, CI and extracted factors were computed using the PROC CORR procedure (SAS, 2008).
Results
Summary statistics and extracted factors
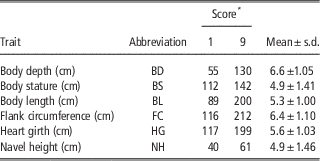
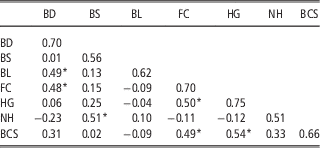
The mean values and descriptions of the ranges for each trait are shown in Table 2. The means of linear type scores varied between 6.6 for body depth and 4.9 for body stature and navel height. All traits had a Kaiser’s MSA score >0.50. Most of the partial correlation estimates were low to relatively low (Table 3).
Description and mean values (±s.d.) of linear type traits in Nguni cows
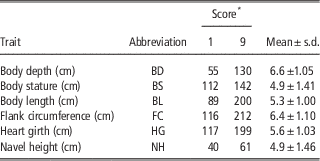
* Each trait was scored on a scale of 1 to 9, inclusive, according to extremes of the direct measurements.
Measurement of sample adequacy (MSA) and partial correlationsFootnote # between linear type traits

BD=body depth; BS=body body stature; BL=body length; FC=flank circumference; HG=heart girth; NH=navel height; BCS=body condition score.
# Measure of sample adequacy (MSA) on the diagonal and partial correlations off diagonal.
Significant partial correlations (>0.47) are flagged by an *.
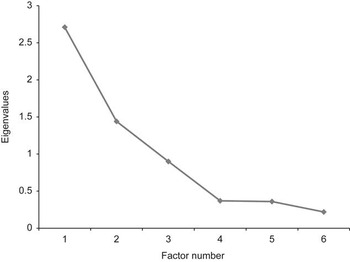
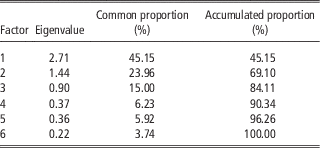
The Bartlett sphericity test showed that there were correlations between the linear traits (P<0.01). The eigenvalues had estimates between 0.22 and 2.71, but only two had estimates >1. The two factors with eigenvalues >1 had common variance for linear type traits of 45 and 24% (Table 4). Figure 1 shows the relationship between number of factors and their respective eigenvalues from the Scree test. The Scree test indicated the extraction of three factors, one more than those indicated with a critical eigenvalue >1.
Relationship between number of factors and their respective eigenvalues from the Scree test.

Eigenvalues, common variance and accumulated proportion of factors

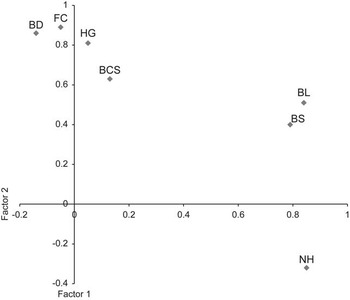
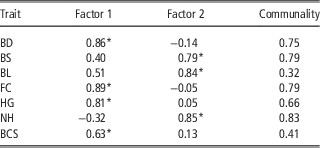
The factor weights varied from 0.40 to 0.89 for Factor 1 for body stature and flank circumference, respectively (Table 5). Most communality estimates were high, especially for navel height, flank circumference and body stature. Navel height had the highest communality (0.72). High and significant (>0.55) factor weights in factor 1 were for traits related to body capacity of the cows. Consequently, the factor was called body capacity (Table 6). The traits with higher and significant weights (>0.55) in Factor 2 were related to the frame size of the cow. In general, two well-defined factors were formed (Figure 2). Factor 1 had a common variance of 2.7 and Factor 2 had a common variance of 1.4, totalling 4.1 common variance between the traits.
Extracted factors after varimax rotation. BD=body depth; FC=flank circumference; HG=heart girth; BL=body length; BS=body stature; NH=navel height; BCS=body condition score.

Estimates of factor weights for linear type traits using varimax rotation

BD=body depth; BS=body stature; BL=body length; FC=flank circumference; HG=heart girth; NH=navel height; BCS=body condition score.
* Factor weights equal to or >0.58 were significant.
Effect of vegetation type and parity of cow on extracted factors, calving interval (CI) and age at first calving (AFC) in Nguni cows

RMSE=root mean square error; BD=body depth; BS=body stature; BL=body length; FC=flank circumference; HG=heart girth; NH=navel height; BC=body capacity; FS=frame size; BCS=body condition score.
Values of each parameter in a row with different superscript differ significantly (P<0.05); *P<0.01.
Effect of parity of cow and vegetation type on extracted factors and cow fertility
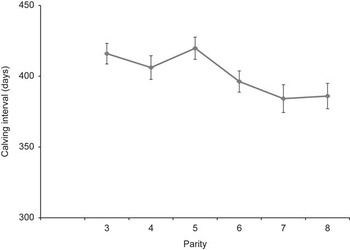
The effects of vegetation type on extracted factors and fertility traits are shown in Table 6. Cows kept under succulent karoo had the highest values for factor 1 and smallest values for factor 2 (P<0.01). Cows raised on grasslands had the smallest values of factor 1 and highest values of Factor 2 (P<0.05). Cows reared on the succulent karoo rangelands had the shortest CI while those on grassland ranges had the longest CI (P<0.05). Cows reared on the succulent karoo rangelands had the shortest AFC while those on grasslands had the longest AFC (P<0.05). The CI decreased with parity of cow from parity 3 to parity 8 (Figure 3).
Effect of parity of cow on calving interval.

Relationships between extracted factors and fertility traits
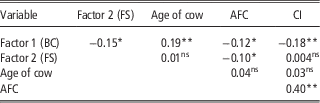
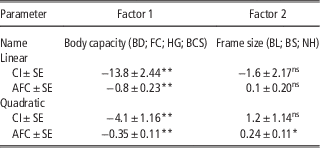
Phenotypic correlations between extracted factors, CI and AFC are shown in Table 7. The body capacity (Factor 1) had a significant negative phenotypic correlation with CI. The phenotypic correlation between AFC and body capacity was relatively weak and negative (r=−0.12; P<0.05). Small framed (Factor 2) cows had large body capacities (r=−0.15; P<0.05). Relationships between extracted factors and fertility traits are shown in Table 8. The CI and AFC decreased linearly with increase factor 1 (P<0.05). Cows with high BCS, deep bodies, wide flanks and heart girths were associated with short CI and early AFC. Factor 2 had no significant relationship with CI. There was a quadratic increase in AFC as Factor 2 increased (P<0.05). Long and tall cows with navels near the ground had late AFC.
Phenotypic correlations extracted factors and fertility traits in Nguni cows

BC=body capacity; FS=frame size; CI=calving interval; AFC=age at first calving.
*P<0.01; **P<0.05; ns P>0.05.
Regression coefficients (±s.e.) of extracted factors on calving interval (CI) and age at first calving (AFC) in Nguni cows

BD=body depth; BS=body stature; BL=body length; FC=flank circumference; HG=heart girth; NH=navel height; BCS=body condition score.
**P<0.01; *P<0.05.; ns P>0.05.
Discussion
Under rangeland Nguni cattle production, the CI and AFC are the most easily measured fertility traits compared with other direct measures of fertility such as conception rate, birth and weaning weight (Schoeman, Reference Schoeman1989). Pregnancy diagnosis is a vital tool of reproductive management of beef herds. Determining pregnancy status of cows is expensive and time consuming. Considering the fact that Nguni cows have a high re-calving rate of over 80% on natural pastures (Schoeman, Reference Schoeman1989), the DLC is a good indicator of the reproductive status of Nguni cows.
The finding that all the linear traits had Kaiser’s MSA scores >0.50 and communality values >0.05 show that there were correlations in the data set that were appropriate for factor analyses. Traits with MSA scores ⩽0.50 and/or communality values <0.05 are not acceptable for factor analysis (Hair, Reference Hair2009). The suitability of the data for factor analysis and existence of true factors was further supported by the existence of relatively low estimates of partial correlations between linear traits and significant Bartlett sphericity test.
The observed contradiction that the Scree test pointed to the extraction of three factors, while only two factors had eigenvalues >1 which is critical value was unexpected, though not strange. It is common to have situations where the Scree test designates two to three factors more than factors designated by the Kaiser’s eigenvalue >1 rule (Hair, Reference Hair2009). Two factors were retained based on the rule that the Kaiser’s eigenvalue was >1 (Ledesma and Valero-Mora, Reference Ledesma and Valero-Mora2007). The Scree test is not affected by number of variables, while Kaiser’s eigenvalue rule can be affected by number of variables (Ledesma and Valero-Mora, Reference Ledesma and Valero-Mora2007). A few variables were available for the current study. As such, both the Scree test and Kaiser’s eigenvalue >1 rule were used to complement each other.
Body depth, flank circumference and heart girth, which were composites of Factor 1, represent body capacity of the cow. Cows which are wide at the flanks with deep bodies in addition to wide, well-sprung ribs are said to have a large body capacity (Hansen et al., Reference Hansen, Cole, Marx and Seykora1999). The BCS could have been grouped with body depth, flank circumference and heart girth because of its influence on the traits. Body depth, flank circumference and heart girth influenced by fatness of the cow. The finding that factor weights of flank circumference, body depth and heart girth did not differ shows that they equally represent body capacity of the cows (Factor 1). Nutt et al. (Reference Nutt, Holloway and Butts1980) reported that body depth and flank circumference of a cow are strong indicators of its body and rumen capacity. The body stature, navel height and body length factor weight values were close to each other, showing that all the three traits had a high correlation with Factor 2.
Cows on succulent karoo rangelands had the shortest CI, and calved at the youngest age, and this was attributed to the fact that they had large body capacities. The finding that cows on succulent karoo had the shortest CI and calved at the youngest age is unexpected. The succulent karoo has exceptional diversity of plants dominated by species unpalatable to domestic livestock (Bosing et al., Reference Bosing, Haarmeyer, Dengler, Ganzhorn and Schmiedel2014). Thus, reproductive performance is expected to suffer since lack of adequate nutrients reduces ovulation rates and age at puberty. Grassveld has higher production potential for beef cattle due to the existence of grasses and dwarf shrubs that are sweet, providing palatable forage throughout the year (Rook et al., Reference Rook, Dumont, Isselstein, Osoro, WallisDeVries, Parente and Mills2004). There are positive phenotypic and genetic correlations between body capacity and gut capacity in cows (Hansen et al., Reference Hansen, Cole, Marx and Seykora1999).
Large body capacity in cows is associated with plenty of space for the rumen and respiratory organs, which, in turn, affects the food ingestion, digestion and assimilation capacity (Dubey et al., Reference Dubey, Mishra, Khune, Gupta, Sahu and Nandanwar2012). Deep wide bodies with wide open ribbing provide lots of room for the rumen to expand and digest large amounts of high-fibre; lower protein feeds along with plenty of water. Cows with large body capacities are capable of using low quality forage efficiently due to potentially longer passage rates and, consequently, more thorough digestion compared with those with shallow bodies. This suggests that large body capacities may account for shorter intervals in cows bred under succulent karoo ranges, implying that body capacity may have very important biological advantages for adaptation to poor nutrition.
The observation that CI and AFC decreased as Factor 1 increased indicates that large body capacities are required for optimum fertility for cows raised under natural rangelands. In a comparable study in dairy cows, Forabosco et al. (Reference Forabosco, Groen, Bozzi, van Arendonk, Filippini, Boettcher and Bijma2004), using phenotypic data, found that body capacity was a strong indicator of fertility traits such as longevity. This finding agrees with our finding, which is that as body capacity increases CI and AFC decreases, in the sense that the cows would stay in the herd for a long period probably because they had desirable reproductive traits such as early calving and short CI. The relationship between body capacity and AFC and CI could be because of the interactions between body capacity, rumen capacity, rumen fill and nutritional demands of the cow.
Cows with little body capacity are more likely to struggle to meet nutritional requirements during pregnancy when fed on natural pastures of poor nutritional value. This is because the gut size is limited by the abdominal capacity. During pregnancy, as the foetus is growing in the uterus it fills a large portion of the cow’s body cavity, thus displacing rumen capacity. Thus reduced forage intake during late gestation could be partly a result of restricted rumen capacity caused by space limitations in the abdominal cavity due to the presence of the foetus, placenta and associated fluids. Under-nutrition because of limited feed intake during late gestation (prepartum) has detrimental effects on subsequent reproductive efficiency. Reproductive performance is closely linked to the amount of available energy reserves a cow has especially during gestation (Olson, Reference Olson2005). Reduced forage intake during pregnancy impairs energy balance hence foetal growth and BCS of the cow at calving will be affected. Nutritional status of the cow at the time of calving determines when it will return to oestrus hence CI (Drennan and Berry, Reference Drennan and Berry2006). Thus, cows with large capacities tend to have sufficient body cavity for forage intake to meet nutritional requirements during pregnancy. This shortens the lactation anoestrous period hence CI is reduced. When including the traits of Factor 1 in selection decisions, cows are expected to have deep bodies, wide flanks and heart girths so as to optimise body capacity.
A plausible explanation for the favourable negative relationship between body capacity and AFC is that, under rangelands with poor nutrition, heifers with large body capacities hence large rumen capacities may be more willing and able to consume their forage more rapidly than those with small body capacities. Moreover, large body capacity is associated with plenty space for the rumen and digestive system, and this, in turn, affects the food ingestion, digestion and assimilation capacity of animal (Dubey et al., Reference Dubey, Mishra, Khune, Gupta, Sahu and Nandanwar2012). Heifers with large body capacities are, therefore, more likely to meet their nutritional requirements while those with small body capacities are more likely to struggle to meet nutritional requirements. Considering that poor nutrition prolongs pubertal development and reduces conception rate in heifers (Diskin et al., Reference Diskin, Mackey, Roche and Sreenan2003), heifers with small body capacities are likely to take more time to calve than heifers with large body capacities.
The finding that CI decreased with increasing parity of cow confirmed the work of Werth et al. (Reference Werth, Azzam and Kinder1996) who argued that since first calvers will still be growing, they compete with their foetuses for available nutrients for their growth and maintenance during pregnancy. This could, adversely, influence foetal growth and development during gestation, thus extending the CI.
Conclusions
The dimensionality of the group of linear type traits studied was reduced, forming two distinct factors, one linked to body capacity and the other to the frame size of the cow. Vegetation type affected linear traits, CI and AFC. Cows raised on the succulent karoo rangelands had shortest CI, calved earliest and largest body capacities. Frame size and body capacity were significant predictors of fertility in Nguni cows under extensive conditions. As body capacity increased, AFC and CI decreased linearly. As frame size increased, there was a quadratic decrease in AFC. Small-framed cows with large body capacities have shorter CI and AFC. Thus, selection of small-framed animals with large body capacities could possibly lead to increased fertility. This could be a starting point to incorporating linear traits and/or visual appraisal for fertility improvement programmes for beef cattle under extensive production. There is need to determine the genetic relationships between the linear traits and fertility in Nguni cows. There is also need to explore more on the relationship between these linear traits and other important component traits of fertility such as longevity and mothering ability.
Acknowledgements
The authors acknowledge the farmers who provided the data on linear measurements. Financial assistance for the study was provided by the University of KwaZulu-Natal.