Introduction
Echinorhynchus gadi Zoega in Müller, 1776 is an acanthocephalan parasite with a wide range of teleost fish hosts in the North Atlantic and North Pacific. It has been most frequently reported from marine gadid fish, particularly Atlantic cod Gadus morhua L., but can also infect brackish and freshwater fishes (Bauer, Reference Bauer1987). It is the most common parasite of cod in the southern Baltic Sea (Möller, 1975; Pilecka-Rapacz & Sobecka, Reference Pilecka -Rapacz and Sobecka2004), where its prevalence of infection can reach 100% (Studnicka, Reference Studnicka1965).
The wide geographical and host ranges of E. gadi have prompted the question of whether it is a single cosmopolitan species or a complex of morphologically similar sibling species. Shostak et al. (Reference Shostak, Dick and Szalai1986) found the morphological features of three species of Echinorhynchus, including E. gadi, in northern Canada, to be highly variable. Ghichenok (Reference Ghichenok1995) also described morphological and phenotypic variability between samples of E. gadi from two species of fish in the White Sea that suggested the existence of more or less isolated groups of this parasite in the area. Väinölä et al. (Reference Väinölä, Valtonen and Gibson1994) used allozyme electrophoresis to show that E. gadi from cod caught in the Baltic Sea, Norwegian Sea and North Sea, and whiting Merlangius merlangus (L.) caught in the North Sea, comprise three, partly sympatric, sibling species. These authors did not try to distinguish their specimens of E. gadi morphologically, but Wayland et al. (Reference Wayland, Gibson and Sommerville2005) again used allozyme electrophoresis to confirm the existence of two reproductively isolated sympatric species of E. gadi from four gadid host species, including cod, in the northern North Sea, and further showed that the two species could be discriminated morphologically by analysis of proboscis hook morphometrics.
The aim of the present study was to follow up and extend those earlier studies by using a combination of DNA analysis and morphometrics to investigate the differences between samples of E. gadi from cod caught at a larger number of stations spread over a wider geographical range than in those of Väinölä et al. (Reference Väinölä, Valtonen and Gibson1994) and Wayland et al. (Reference Wayland, Gibson and Sommerville2005).
Materials and methods
Collection of material and descriptive statistics
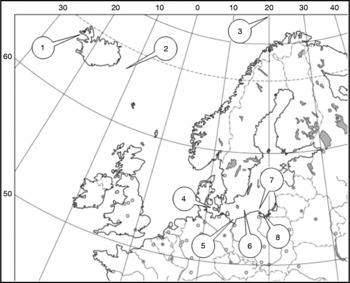
Cod were caught by Polish commercial trawlers at five fishing grounds in the Baltic Sea and one each to the north-west of Iceland, near Bear Island in the Barents Sea and in the Irminger Sea to the south-east of Iceland (fig. 1). Most of the samples were from winter fisheries. Specimens of E. gadi were isolated from the intestines, washed in distilled water, and identified to species under a light microscope on the basis of morphological characters (Petročenko, 1956). Specimens for morphological examination were deep-frozen at sea and later defrosted in the laboratory, apart from those from Władysławowo and the Gulf of Gdansk, which were examined fresh. Specimens for molecular analysis were frozen at − 20°C or stored in 70% ethanol for later processing in the laboratory. Molecular examination was made on 99 individuals of E. gadi; all of them were studied by polymerase chain reaction-restriction fragment length polymorphism (PCR-RFLP), and selected PCR products were sequenced.
Sampling locations for E. gadi. 1, North-west of Iceland; 2, Irminger Sea; 3, Barents Sea; 4, Kattegat; 5, Pomeranian Bay; 6, Kołobrzeg; 7, Władysławowo; 8, Gulf of Gdansk.

The descriptive statistics of E. gadi infections were calculated separately for each sampling site and 95% confidence intervals were calculated to show the accuracy of the estimations (Rozsa et al., Reference Rozsa, Reiczigel and Majoros2000; Reiczigel, Reference Reiczigel2003).
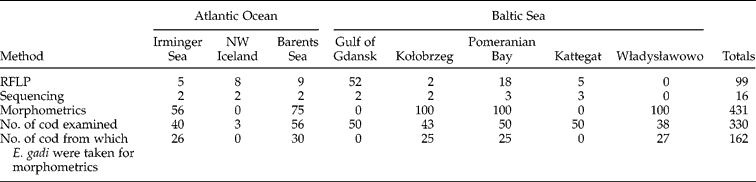
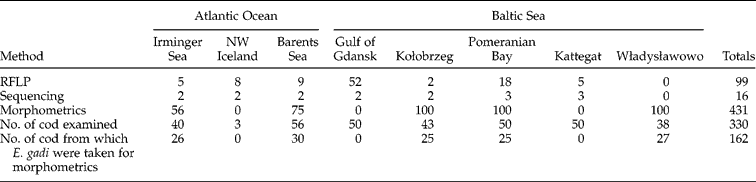
For morphometrics, only individuals with the spiny proboscis fully everted were selected. These were placed on a slide with lactic acid to clear and covered with a glass coverslip. Samples for both genetic and morphological analyses were taken from the same individual cod. Only 11 specimens of E. gadi from the Barents Sea and 10 from north-west of Iceland were subjected to both methods. Numbers of specimens examined by each method are given in table 1. All measurements were done by the same person.
Numbers of E. gadi used for genetic studies and morphometrics from cod caught at different sampling sites.
DNA analysis and amplification
DNA was extracted from specimens of E. gadi using ‘Genomic Mini’ Kit (A&A Biotechnology, Gdynia, Poland) for universal genomic DNA isolation, according to the manufacturer's recommendation. The target of molecular studies was the fragment of ribosomal DNA (rDNA) embracing the 3′ end of the gene coding the 18S rRNA, ITS-1, gene coding 5.8S rRNA, ITS-2 and 5′ end of the gene coding 28S rRNA. This DNA fragment characterizes the significant conservatism of coding nucleotide sequences and, at the same time, high polymorphism of internal transcribed spacers even among closely related species. For these reasons, molecular analysis of rDNA has been systematically used in studies of relationships between closely related species of helminths and other organisms.
The nuclear DNA fragment embracing a part of ribosomal DNA (rDNA) was amplified. Primers were located at the conserved sites so that they would flank a large region of DNA, convenient for PCR-RFLP analysis. The following PCR primers were used (Gasser et al., Reference Gasser, Chilton, Hoste and Stevenson1994; Campbell et al., Reference Campbell, Gasser and Chilton1995):
18SF1 (forward): 5′-GCG AAG CAT TTG CCA AGA A-3′, located in the conserved region coding the 18S rRNA (unpublished); and
NC2 (reverse): 5′-TTA GTT TCT TTT CCT CCG CT-3′, located in the conserved region coding the 28S rRNA.
The use of this pair of primers enabled us to obtain a relatively long PCR product, convenient for RFLP analysis.
DNA amplification was carried out in a 50 μl reaction mixture composed of 5 μl of PCR buffer (10 × concentrated), 5 μl of deoxynucleotide triphosphate (dNTP) mixture (concentration of each dNTP was 2.5 mm), 2 μl of each primer (concentration 10 μm), 1 U of RUN polymerase (A&A Biotechnology), 2 μl of DNA template and 33 μl of distilled water.
PCR reaction conditions were as follows: initial denaturation at 93°C for 3 min followed by 35 cycles of denaturation at 93°C for 1 min, annealing at 48°C for 1 min and extension at 72°C for 2 min, followed by a final extension step at 72°C for 3 min, and finished with a hold step at 4°C. DNA amplification was performed in the GeneAmp PCR System 2400 or 9700 Gold thermocyclers (Applied Biosystems, Foster City, California, USA). In each amplification run a sample with water instead of DNA template was included as negative control. Also DNA-control samples derived from fish muscle and liver were subjected to the same amplification procedure to ensure that fish tissue did not give an unspecific PCR product with the primers used.
PCR products were subjected to electrophoresis on 1% agarose (Sigma, St. Louis, Missouri, USA), and visualized following ethidium bromide staining.
Restriction fragment length polymorphism (RFLP) analysis
PCR products were digested with the following restriction endonucleases: AluI, HaeIII, HinfI, MboI, PvuII and TaqI (Promega, Madison, Wisconsin, USA), according to the manufacturer's recommendation. The digestion products were separated by gel electrophoresis using 2% (HaeIII, AluI, TaqI, PvuII) or 3% (HinfI, MboI) agarose (Sigma, St Louis, Missouri, USA or Invitrogen, Groningen, The Netherlands, respectively), and visualized following ethidium bromide staining.
DNA sequencing and analyses
The PCR products selected for sequencing were purified using Clean-Up Kit (A&A Biotechnology). Cycle–sequencing was performed using BigDye v. 3.0 terminator cycle sequencing kit (Applied Biosystems) in the GeneAmp PCR System 2400 or 9700 Gold thermocyclers (Applied Biosystems), in both orientations. Sequencing reaction products were purified by using ExTerminator Kit (A&A Biotechnology), denatured and sequenced using the ABI Prism 310 DNA sequencer (Applied Biosystems). Sequences were analysed with the use of ABI PRISM DNA Sequencing Analysis v. 3.7 for the Windows NT Platform (Applied Biosystems) and GeneStudio Pro Software (GeneStudio Pro Software, GeneStudio Inc., Suwanee, Georgia, USA).
Morphometrics: measurements and analyses
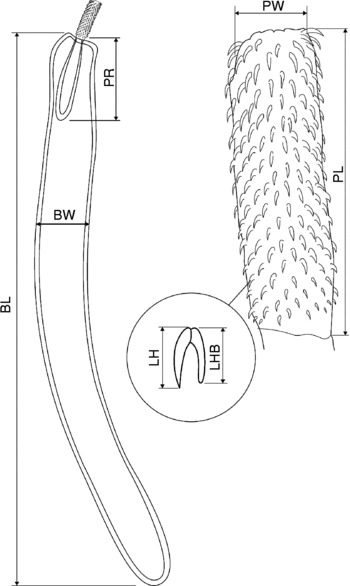
The total of 431 specimens of E. gadi examined included 184 males and 247 females. For all specimens the features measured (fig. 2) were: body length (BL), maximum body width (BW), proboscis length (PL), proboscis width (PW), length of the largest hook (LH), length of the base of the largest hook (LHB), length of the proboscis sheath (PR), the number of rows of hooks (NH) and number of hooks in each row (NHL). In addition, for males the number of cement glands (NCG) was recorded, and for females the maximum body width at the level of the uterus (BWU), the length of the eggs (LE) and the length of the acanthors (LA). Measurements were made under a compound microscope at a magnification of × 200, and under a stereomicroscope at × 40.
Morphometric features of E. gadi measured.

The influence of sampling site and sex of E. gadi on the parameters of the morphological features of E. gadi was evaluated by multivariate analysis of variance. To order the results of measurements of the morphological features and calculations into structures referring to particular fishing areas, a cluster analysis was performed preceded by rescaling of the measurements. For the rescaling of morphometric data the minimax of data conversion was used. The rescaling was applied in order to harmonize the observations and reveal the proportional contribution of the results from particular sampling sites in the comparative analysis. The Euclidean distance between the objects (results of measurements and calculations of particular features) in the multidimensional space was assumed.
Results of the measurements and analyses of the morphological features of E. gadi were used to discriminate between hosts from different sampling sites. For those measurements whose distribution diverged from normal, the root transformation was applied. The value of the function of classification determined for the objects analysed was compared with the reference standard describing the classification of the objects into classes. The quality of the classifying criteria of individual variables was evaluated by the Wilks Lambda parameter, partial Wilks Lambda and tolerance coefficient, Fisher statistics and determinant coefficient (Dobosz, Reference Dobosz2004). The species diversity index (H) was used to compare the number of all cod intestinal parasite species (nematodes and E. gadi) at each sampling site and their relative abundance.
The Spearman rank-correlation coefficient was used to investigate: (1) the effect of E. gadi infrapopulation size on the morphological measurements, and (2) possible relationships between the weight, age and sex of the host and the number of endoparasites present on the one hand, and sampling site and water salinity on the other.
Statistical calculations were made using the programme STATISTICA 7.0 (Statsoft Polska Sp. z.o.o., Krakow, Poland).
Results
Infection statistics
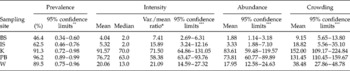
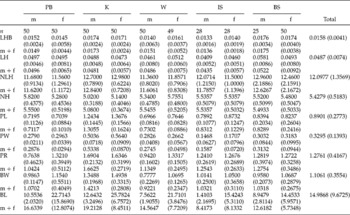
The descriptive statistics (table 2) show that the highest prevalence of E. gadi was in cod from Pomeranian Bay, whereas mean intensity, abundance and crowding were all highest at Kołobrzeg.
Descriptive statistics for E. gadi from cod at different sampling sites. BS, Barents Sea; IS, NW Iceland; K, Kołobrzeg; PB, Pomeranian Bay; W, Władysławowo.

* Variation/mean ratio calculated including infected hosts.
** Confidence limits for prevalence calculated using Sterne's exact method up to n = 1000, adjusted Wald method for n>1000.
*** Bootstrap (BCa) confidence limits.
PCR analysis
The length of the PCR products obtained was nearly 1500 base pairs (data not shown). Clear, well-defined sequences were a little shorter and were 1368 nt in length because they did not embrace peripheral fragments of PCR products. No signal was detected in the reaction of PCR with DNA isolated from cod tissue (muscles, liver), which means that the starters and PCR reaction conditions were correctly selected and possible contamination of the material studied with cod tissue would not interfere with the results obtained by the method used. None of the six restriction endonucleases used detected differences in the sequences of rDNA among E. gadi originating from different collection sites.
The enzymes used digested the PCR product giving characteristic electrophoretic patterns, the same for all the acanthocephalans, irrespective of the fishing ground of origin of their hosts. Only PvuII did not digest the PCR product obtained.
Sequence analysis
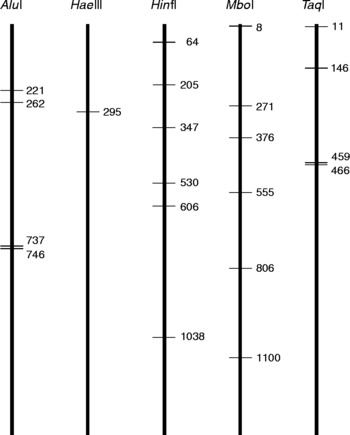
Sequences of 1368 nt in length were obtained. These covered the 3′ terminal of the 18S gene, ITS-1, gene coding 5.8S, ITS-2 and 5′ terminal of the 28S gene. The nucleotide sequences of the studied rDNA fragment isolated from E. gadi from the Baltic Sea (Gulf of Gdańsk, Pomeranian Bay, Kołobrzeg), Irminger Sea, Barents Sea and Western Baltic (Kattegat) were identical. The only exceptions were: one transition A instead of G at the alignment position 996 in one of two specimens from the north-west of Iceland and two transversions: G instead of T at the alignment position 1219 and T instead of A at the alignment position 1250 found in one of the three specimens from Kattegat. The comparison of sequences of all analysed isolates confirmed in each of them the presence of 24 sites digested by the restriction enzymes used. The restriction maps of the rDNA of E. gadi obtained for endonucleases used in the studies are shown in fig. 3.
Restriction fragments of rDNA of E. gadi obtained after digestion with different endonucleases.

Nucleotide sequences of ribosomal DNA obtained are available in the GenBankTM, EMBL and DDBJ databases under accession numbers EF107643, EF107644, EF107645, EF107646, EF107647 and EF107648.
Morphometrics
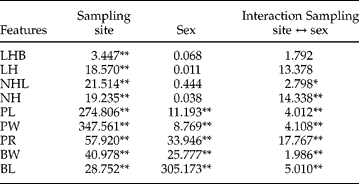
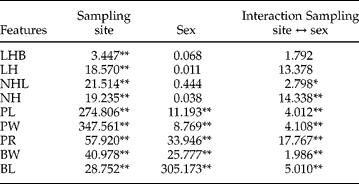
The mean values of the features measured are given in table 3. Statistical analyses of the effects of sex, sampling site, and these two factors together, on the morphological features of the parasites showed the significant effect of sampling site on all the E. gadi features studied and of parasite sex on five features. The interaction of area of capture and parasite sex were significantly correlated with seven of the nine features studied (table 4).
Mean values and standard deviations (in parentheses) of the morphological features of E. gadi measured. m, Males; f, females; n, number of specimens; LHB, length of the base of the largest hook; LH, length of the largest hook; NHL, number of hooks in the row; NH, number of hooks in the ring; PL, proboscis length; PW, proboscis width; PR, length of the proboscis sheath; BW, maximum body width; BL, body length. See table 2 for key to sampling sites.

Effect of sampling site and parasite sex on the morphological features measured. *P<0.05, **P<0.01. See table 3 for key to morphological features.
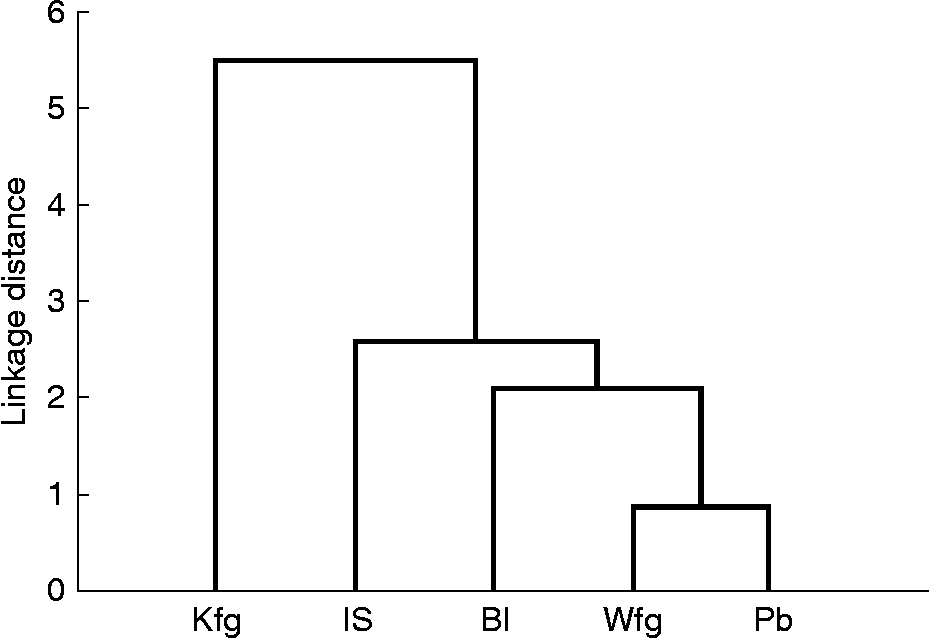
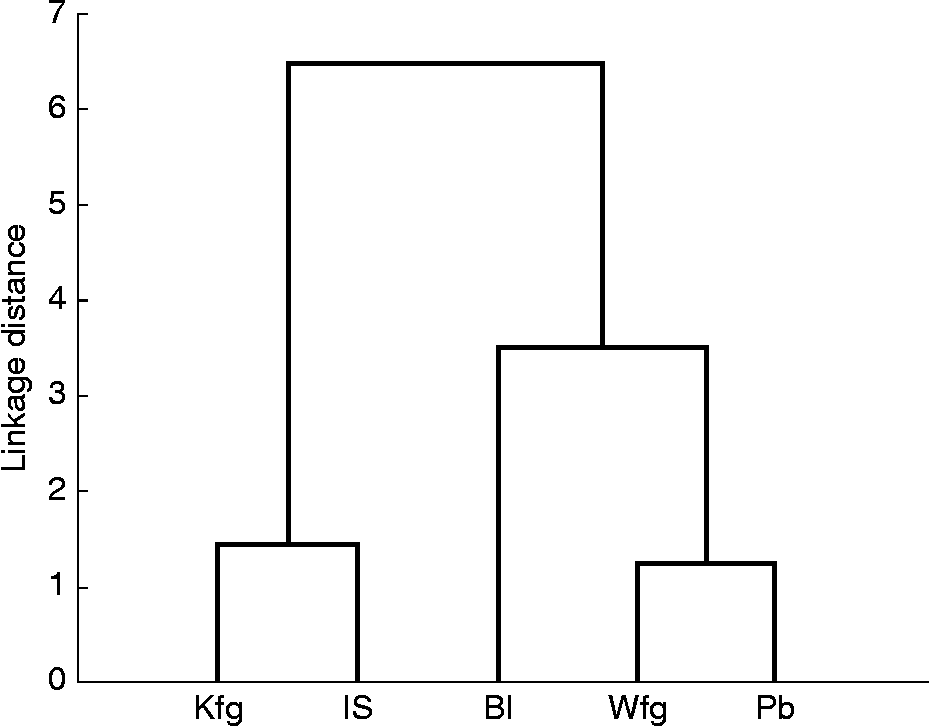
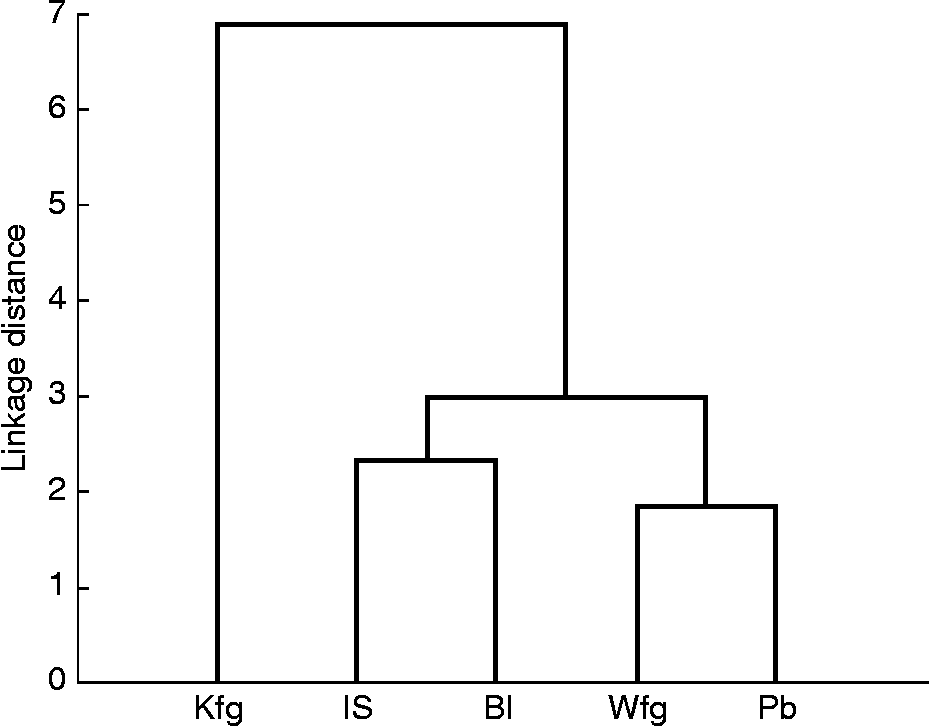
The cluster analysis diagram obtained on the basis of the results of the morphological features measured indicates the greatest morphological similarity between parasites from the fishing grounds at Władysławowo and Pomeranian Bay (fig. 4). The link between the other metapopulations is looser but the similarity between the metapopulations of E. gadi from the fishing grounds in the open ocean is more pronounced. By far the most distant is the metapopulation from the Kołobrzeg fishing ground, which is most similar to that from the Irminger Sea. Analogous diagrams were constructed taking into consideration the same morphological features and parasite sex (figs 5 and 6). These show a closer link between Kołobrzeg and the Irminger Sea for female than for male E. gadi.
Cluster analysis of the average values of morphological measurements taken from all specimens of E. gadi from five fishing grounds: Kfg, Kołobrzeg; IS, Irminger Sea; BS, Barents Sea; Wfg, Władysławowo; Pb, Pomeranian Bay.

Cluster analysis of the average values of morphological measurements taken from female specimens of E. gadi only from five fishing grounds. See fig. 4 for key to fishing grounds.

Cluster analysis of the average values of morphological measurements taken from male specimens of E. gadi only from five fishing grounds. See fig. 4 for key to fishing grounds.

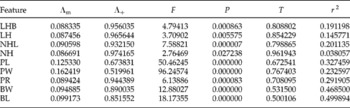
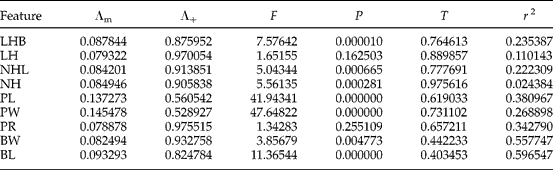
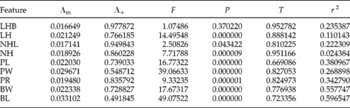
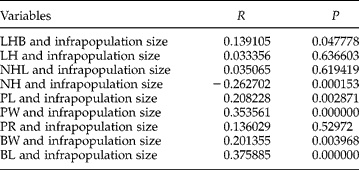
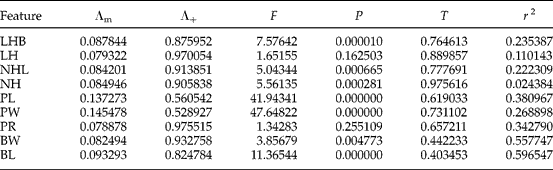
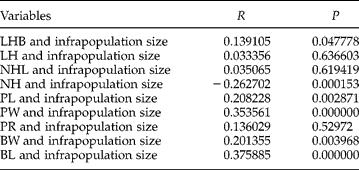
The discriminant analysis showed that the measurements of all morphological features used for discrimination of E. gadi from cod collected at the different sampling sites were significant, while none of the variables were (table 5). The values of the Λ coefficients and the tolerance coefficient T indicate that the parameters of greatest significance for discrimination purposes were: (1) the number of rows of hooks (NH), (2) the length of the longest hook (LH) and (3) the length of the base of the longest hook (LHB). The significance of the other features was less. For female E. gadi the parameters of greatest discriminatory value were LH and length of proboscis sheath (PR) (table 6), while for males it was number of hooks in each row (NHL) and LHB (table 7). The E. gadi infrapopulation size had a significant effect on the values of some morphological features (LHB, NH, PL, BW and BL), but not on others (LH, NHL and PR) (table 8).
Results of discriminant analysis of morphological features of E. gadi, including males and females (see table 3 for key to features). Λm, Lambda Wilks partial; Λ+, Lambda Wilks; F, Fisher statistics; P, P value; T, tolerance coefficient; r 2, determinant coefficient.

Results of discriminant analysis of morphological features of female E. gadi only (n=227).
Results of discriminant analysis of morphological features of male E. gadi only (n=203).

Effect of infrapopulation size on the morphological characters of E. gadi (Spearman's rank correlation coefficient significant at P<0.050).
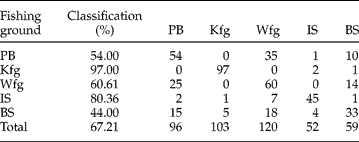
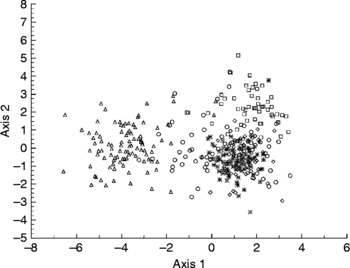
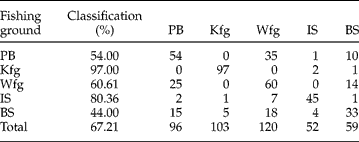
The above results were used for verification of the classification of the fishing grounds (table 9). The mean value of the correct classifications for the whole set was 67.21%, and the best discrimination was obtained for the Kołobrzeg fishing ground (97% of classifications correct). The least number of correct classifications was obtained for the Barents Sea fishing ground, linked in the cluster analysis to those of Władysławowo and Pomeranian Bay (fig. 7).
Verification of the classification of the fishing areas. PB, Pomeranian Bay; Kfg, Kołobrzeg; Wfg, Władysławowo; IS, Irminger Sea; BS, Barents Sea.
Results of discriminant analysis of morphological features of E. gadi from different fishing grounds. Circles, Barents Sea; squares, Irminger Sea; diamonds, Władysławowo; triangles, Kołobrzeg; asterisks, Pomeranian Bay.

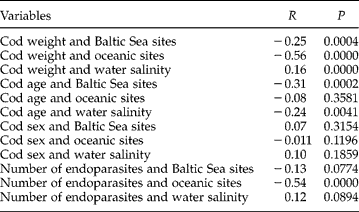
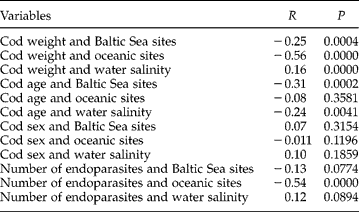
Weight and age of cod were significantly correlated with sampling site and water salinity, while sex of cod showed no correlation (table 10). Number of endoparasites and area of capture were positively correlated for the Irminger Sea sample only.
Effect of sampling site and water salinity on cod weight, age, sex and number of endoparasites (Spearman's rank correlation coefficient is significant at P<0.050).
The highest parasite (nematodes and E. gadi) diversity indices were in the samples from the Irminger (H = 0.9372) and Barents seas (H = 1.3485). The index value was lowest on the Władysławowo (0.0065) and Kołobrzeg (0.0481) fishing grounds. In the Gulf of Gdansk and Pomeranian Bay the influence of the freshwater fauna was evident and the H index values were 0.2334 and 0.3289 respectively. In the Kattegat, which is a transition zone between two different hydrographical areas, the index value (0.3573) was higher.
Discussion
Echinorhynchus gadi was the dominant intestinal parasite species found in cod from all geographical locations sampled. Prevalence and intensity of infection was significantly higher in the Baltic Sea samples than in any of the others. Heavy infections in this area result from heavy infections in intermediate hosts and a high level of egg production by the acanthocephalans (Nordenberg, Reference Nordenberg1963). Adult Baltic cod also feed on a variety of other food items, including young cod already infected with E. gadi (Buchmann, Reference Buchmann1986, Reference Buchmann1995). The influences of eutrophication and pollution in Baltic coastal waters may also be important (Thulin et al., Reference Thulin, Höglund and Lindesjöö1989).
The molecular analyses showed nucleotide sequences of E. gadi rDNA from cod caught in the southern Baltic Sea, and in three fishing areas in the North Atlantic, to be identical. The only exceptions were a small difference found among the E. gadi from cod caught in the Kattegat, geographically belonging to the Baltic Sea, and from cod caught to the north-west of Iceland. Studies of the population structure of cod in the transition area between the North Sea and the Baltic Sea by Nielsen et al. (Reference Nielsen, Hansen, Ruzzante, Meldrup and Grønkjær2003), using microsatellite markers, showed the presence of a hybrid zone for cod in the transition area, which covers the Belt Sea and Sound. Perhaps a similar situation exists for E. gadi, but no studies aimed at its detection have yet been made. Further genetic investigations of E. gadi from the same collection sites are desirable, with analyses of more variable DNA regions, for example mitochondrial or microsatellite DNA, which may help to explain the population structure of E. gadi.
In contrast to the genetic study, the comparative morphological study of E. gadi from different fishing grounds revealed significant differences. According to the results of the cluster analysis, the most similar parasites were those collected from cod caught at Władysławowo and Pomeranian Bay, while the cluster closest to these two is from the Barents Sea. The same tendencies were indicated by the discrimination analysis, which also linked these two fishing areas in the Baltic Sea with the Barents Sea. The infrapopulation size of E. gadi was shown to have a significant effect on the values of some of the morphological features, but did not appear to significantly affect those shown to have the greatest discriminatory value.
The location of E. gadi in the intestinal lumen varied and depended on the numbers of both E. gadi and other parasites present. In the oceanic and Kattegat fishing grounds, E. gadi was usually found in the posterior third, whereas in the Baltic Sea fishing grounds it was found throughout the intestine. Interspecific competition between nematodes and E. gadi and intraspecific competition when large numbers of E. gadi were present may have contributed to the some of morphological variations observed. It is also possible that variations in local environmental conditions affect the growth and development of local populations of E. gadi.
The periodic inflows of saline water from the North Sea into the Baltic Sea and the inflow of fresh water into the Sounds have created an unstable zone of mixing influxes from the North Sea and the Baltic Sea. The effects of the changing hydrographic conditions on the genotype mixing of cod populations in the area are amplified by those caused by cod migration. Results from the molecular study with PCR and microsatellite techniques conducted by Nielsen et al. (Reference Nielsen, Hansen, Ruzzante, Meldrup and Grønkjær2003) showed that the waters of this area are a region of cod hybridization between Atlantic (G. morhua morhua) and Baltic (G. morhua callarias) cod populations. Therefore, besides the two main host populations co-existing in the waters of the western Baltic Sea and Sounds, there is also a population of hybrids. Studies of the migrations of cod from the Belt Sea have shown that the range of the migration is limited by the Bornholm Deep and surrounding waters (Otterling, Reference Otterling1985), represented in our study by the Kołobrzeg sample. In this region two cod populations mix, that from the Belt Sea and that from the Baltic Sea (Müller, Reference Müller2002). Our sample from the Kołobrzeg fishing ground may therefore have consisted of a mix of these two populations.
The results of the present study must be considered in the context of the history of the Baltic Sea formation and the origin of the Baltic cod. After the last glacial period, the melting waters of the Scandinavian glacier formed the Baltic Ice Lake. With increasing sea levels about 9500 years ago the North and Barents Seas joined the Ice Lake to form the Baltic Sea, called in this period the Yoldia Sea (Łomniewski et al., Reference Łomniewski, Mańkowski and Zaleski1975; www.io-warnemuende.de). During this period the marine fauna from the North Atlantic colonized the area of what today is known as the Baltic Sea. It was supposedly also the beginning of the Baltic cod (Magaard & Rheinheimer, Reference Magaard and Rheinheimer1974), which, together with its parasites, colonized the new waters. After most of the ice cap had melted, about 8000 years ago, and as a result of isostatic uplift of the land, the Baltic was cut off from the Atlantic again and became a freshwater lake once more. The existing Baltic population of cod probably survived this period, known as the Ancylus. The final rise in sea level about 4500 years ago outpaced the slowing isostatic uplift to reopen the connection with the North Sea and form what was known as the Littorina Sea, which eventually became the Baltic Sea as we know it today. During this period the North Sea cod population was again able to colonize the western part of the Baltic Sea. Cod haemoglobin studies have shown that cod populations in the western and eastern parts of the Baltic Sea are genetically different (Sick, Reference Sick1965).
Väinölä et al. (Reference Väinölä, Valtonen and Gibson1994) used allozyme electrophoresis to show that E. gadi from cod in the north-east Atlantic comprises three, partly sympatric, sibling species, which they designated species I–III. Species I was the only species common to all the areas sampled and was found in the North Sea, Norwegian Sea and Baltic Sea, their sample from the Baltic Sea coming from off the south coast of Finland. Väinölä et al. (Reference Väinölä, Valtonen and Gibson1994) did not try to distinguish their specimens of E. gadi morphologically. Later, Wayland et al. (Reference Wayland, Gibson and Sommerville2005), also using allozyme electrophoresis, confirmed the existence of two reproductively isolated, sympatric species of E. gadi in the northern North Sea, and further showed that the two species could be discriminated by analysis of proboscis hook morphometrics. They were also able to compare the material of Väinölä et al. (Reference Väinölä, Valtonen and Gibson1994) from the northern Baltic Sea morphometrically with their own material and concluded that their E. gadi sp. A might be considered conspecific with E. gadi sp. I of Väinölä et al. (Reference Väinölä, Valtonen and Gibson1994).
Neither Väinölä et al. (Reference Väinölä, Valtonen and Gibson1994) nor Wayland et al. (Reference Wayland, Gibson and Sommerville2005) examined E. gadi from other parts of the Baltic Sea, including the grounds sampled in the present study, so it is not possible for us to relate our specimens of E. gadi to the groups identified by these authors. Our analyses show the separation of E. gadi into two groups corresponding approximately to the systematic classification of cod into the two subspecies Atlantic G. morhua morhua and Baltic G. morhua callarias, with samples from the Gulf of Gdansk and Pomeranian Bay fishing grounds representing the Baltic cod, the North Atlantic samples representing the Atlantic cod, and the Kołobrzeg ground probably representing a mixed population of Atlantic and Baltic cod, together with hybrids between the two subspecies. The most surprising result is that the Kołobrzeg sample had the highest discrimination rate (97%) of all our samples, which may indicate a diverging population of E. gadi in the hybrid host population there.
A new software tool for detecting acanthocephalan morphotypes was recently developed by Wayland (Reference Wayland2010). The new software was trialled on the data from Wayland et al. (Reference Wayland, Gibson and Sommerville2005) and confirmed the existence of the two morphologically distinct groups previously identified. Application of this new tool to further samples of E. gadi should help considerably to clarify the current uncertainty concerning the number of morphotypes of this acanthocephalan and their geographical distributions.
Acknowledgements
We are indebted to Marcin Lemieszko for technical support with the morphometrics examinations, and to Artur Antoszek for support with the graphics. We also thank the anonymous reviewers for their valuable comments and suggestions for improving the manuscript.