


1. INTRODUCTION (S. G. Garanin)
This review will concentrate entirely on the target research and development at the Russian Federal Nuclear Centre–All-Russia Research Institute of Experimental Physics (RFNC–VNIIEF). The recent progress in target technology at other laboratories engaged in fusion research with laser and particle beams is documented in an impressive amount of detail (Aleksandrova et al., Reference Aleksandrova, Belolipeskiy, Koresheva and Tolokonnikov2008; Borisenko et al., Reference Borisenko, Bugrov, Burdonskiy, Fasakhov, Gavrilov, Goltsov, Gromov, Khalenkov, Kovalskii, Merkuliev, Petryakov, Putilin, Yankovskii and Zhuzhukalo2008; Chatain et al., Reference Chatain, Perin, Bonnay, Bouleau, Chichoux, Communal, Manzagol, Viargues, Brisset, Lamaison and Paquignon2008; Cook et al., Reference Cook, Kozioziemski, Nikroo, Wilkens, Bhandarkar, Forsman, Haan, Hoppe, Huang, Mapoles, Moody, Sater, Seugling, Stephens, Takagi and Xu2008; Fernandez et al., Reference Fernandez, Hegelich, Cobble, Flippo, Letzring, Johnson, Gautier, Shimada, Kyrala, Wang, Wetteland and Schreiber2005; Koresheva et al., Reference Koresheva, Aleksandrova, Koshelev, Nikitenko, Timasheva, Tolokonnikov, Belolipetskiy, Kapralov, Sergeev, Blazevic, Weyrich, Varentsov, Tahir, Udrea and Hoffmann2009; Meyertervehn et al., Reference Meyertervehn, Witkowski, Bock, Hoffmann, Hofmann, Muller, Arnold and Mulser1990; Tahir et al., Reference Tahir, Kim, Matvechev, Ostrik, Shutov, Lomonosov, Piriz, Cela and Hoffmann2008; Yang et al., Reference Yang, Nagai, Nakai and Norimatsu2008).
Research on the physics of high-temperature laser plasma with respect to laser fusion has actively been carried out at the RFNC–VNIIEF since 1970. Experiments in the following basic directions (Il'kaev & Garanin, Reference Il'kaev and Garanin2006) are being developed at high-power monopulse laser installations ISKRA-3 (Gaidash et al., Reference Gaidash, Kirillov, Cormer, Lapin, Shemyakin and Shurygin1974), ISKRA-4 (Cormer, Reference Cormer1980), ISKRA-5 (Annenkov et al., Reference Annenkov, Bagretsov, Bezuglov, Vinogradskii, Gaidash, Galakhov, Gasheev, Guzov, Zadorozhnyi, Eroshenko, Il'in, Kargin, Kirillov, Kochemasov, Krotov, Kuz'michev, Lapin, L'vov, Mochalov, Murugov, Osin, Pankratov, Pegoev, Punin, Ryadov, Senik, Sobolev, Khudikov, Khrustalev, Chebotar', Cherkesov and Shemyakin1991), BEAM (Besnasiuk et al., Reference Beznasyuk, Galakhov, Garanin, Grigorovich, Eroshenko, Il'kaev, Kirillov, Kochemasov, Murugov, Rukavishnikov and Sukharev2002), FEMTO (Andreev et al., Reference Andreev, Bespalov, Bredikhin, Garanin, Ginsburg, Dvorkin, Katin, Korytin, Lozhkarev, Palashov, Rukavishnikov, Sergeev, Sukharev, Freidman, Khazanov and Yakovlev2004): (1) dynamics of compression of direct and indirect irradiation fusion targets; (2) influence of target irradiation asymmetry on output parameters (three-dimensional (3D) compression of fusion fuel, temperature of compressed deuterium-tritium (DT) gas, and neutron output); (3) X-radiation transfer into the indirect irradiation targets; (4) the equation-of-state of substances; (5) influence of the turbulent mixing; and (6) physics of X-ray laser operation.
One of the key problems in the realization of these research directions is the problem of precision specialized targets of various types. The characteristic area sizes of focused laser radiation, the conditions needed for research in the physics of high density energy are created, are in the range from tens of microns up to several millimeters. Thus, for reception of the detailed information on dynamics of shells acceleration, evolution of gas dynamic instabilities, physics of generation, and translation of X-radiation, the accuracy of manufacturing of laser target components at a level of about 10 nm and a roughness of 1 to 5 nm are necessary. Moreover, rigid demands are needed for density homogeneity of materials, which targets are produced from. Creation of compound targets, inclusion of their structure of elements with controllable asymmetry of size and heterogeneity of layers, represents special complexity.
The above explains the importance of the development of technology of targets manufacturing for laser experiments and creation of precision quality monitoring of their parameters. It is necessary to also note the increasing rate of fire of laser installations and the need in quantity of produced targets.
Research at the RFNC-VNIIEF is based on the development of modern technologies for the creation of various types of targets (Veselov et al., Reference Veselov, Drozhin, Druzhinin, Izgorodin, Ilyushechkin, Kirillov, Komleva, Korochkin, Medvedev, Nikolaev, Pikulin, Pinegin, Punin, Romaev, Sumatokhin, Tarasova, Tachyaev and Cherkesova1995; Andramanova et al., Reference Andramanova, Veselov, Zhidkov, Ivanin, Ignat'ev, Izgorodin, Kirillov, Komleva, Makarov, Medvedev, Moroovov, Nikolaev, Pinegin, Romaev, Solomatina, Tatsenko, Tenyaev, Cherkesova and Yukhimchuk1999). Manufacturing techniques of spherical shells, filled with DT, manufacturing of indirect irradiation spherical, and cylindrical targets, various multi-layered film targets etc. have been developed. Taking into account the development of a new generation installation, ISKRA-6 (Galakhov et al., Reference Galakhov, Garanin, Eroshenko, Kirillov, Kochemasov, Murugov, Rukavishnikov and Sukharev1999), the creation of “targets factory,” which will provide researchers with demanded targets for experiments is planned on the basis of existing technologies. A number of technologies developed at the RFNC-VNIIEF are presented below.
In Section 2, nondestructive control of transparent shell thickness is given. This method is based on a simultaneous measurement of external and internal surface positions, by means of scanning white light interferometer. In Sections 2.1 and 2.1, results of spectral X-ray application techniques for the control of target parameters are presented. In Section 3, the substantiation use of fluorescence and absorption methods for measurement of thickness of multi-layered and multicomponent films, and the analysis of a mistake, and the sensitivity of measurements are given. Results of fluorescence analysis for definition of gas structure in targets and T concentration are summarized. In Section 4, the illustration of application of measurements of the X-ray characteristic and braking radiation caused by β-radiation of T for the definition of its surface concentration in materials is given. This method can be used for studying processes of hydrogen saturation and desorption in construction materials.
Section 5 is devoted to manufacturing techniques of targets. In the first of the procedures of target manufacturing for the research of substance equation-of-state at high pressures by influence of a powerful laser impulse on a sample surface is described. One of the main requirements to such targets is a high accuracy of layers thickness measurement and small surfaces roughness. Results of work in these directions are given for manufacturing targets from Al, Cu, Pb, and polymeric films. In Section 6, results of activities on creation of a target from the condensed rare gases (Ar, Kr, and Xe) are described. The target was prepared in the form of a continuous liquid jet and can be used for the influence of the pulse-periodic laser with frequency up to hundred Hertz. Exited X-ray radiation can be used in microelectronics for illumination of nanolithography.
2. NONDESTRUCTIVE CONTACTLESS CHARACTERIZATION OF AN INTERNAL SURFACE OF TRANSPARENT SHELLS (A. V. Veselov, A. G. Golubinsky, E. Y. Solomatina)
For inertial confinement fusion, it is important to know power spectra of inner and outer radii of shell surfaces. Usually, atomic force microscopy is used for measurements of outer surface (Cook, Reference Cook1994). However, this method is not acceptable for nondestructive measurements of the inner surface. In this section, we present a method of simultaneous measurements of inner and outer surfaces of transparent shells by profiler based on scanning white light interferometry.
2.1. Surface Measuring Instrument
3D scanning interferometry of white light is widely described (Deck & de Groot, Reference Deck and de Groot1994; Freischlad & Koliopoulos, Reference Freischlad and Koliopoulos1990; de Groot et al., Reference de Groot, Colonna de Lega, Kramer and Turzhitsky2002). In our research, we used a device based on the Linnik interferometer for shell measuring. Construction of such a device is shown in Figure 1. The use of this construction allows partially compensate dispersion of light in the shell material in the case of large thickness. Measuring is carried out by vertical shell displacement. Interference figures are recorded by camera where the interferometer arms are approximately equal. Light intensity produces a signal in every pixel of the figure, like the signal in Figure 2. From the peak location of the signal envelope, it is possible to reconstruct the outer and inner surface of the transparent shell. The typical shape of the shell is shown in Figure 3.
Schematic diagram of the profiler based on scanning white light technique and the Linnik interferometer MII-4.

Intensity from single pixel during scan.

Reconstructed shell surfaces (100 µm × 70 µm). (a) The interference pattern on external and internal surfaces of the shell of 330 µm diameter and 3.1 µm thick wall. (b) 3D image of a segment of the shell with 330 µm diameter and 3.1 µm thick wall. (c) 3D image of a segment of the shell with 310 µm diameter and 3.6 µm thick wall.

2.2. Results
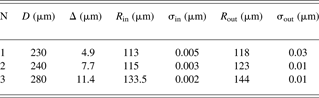
Shells of different diameters (D) and thicknesses (Δ) were used for measurements (Table 1). Nonuniformity of thickness was less then 5%. After reconstruction of outer and inner shell surfaces radii (R), centers and roughness (σ) of surfaces were calculated. The difference between sphere centers of inner and outer surfaces was less then 0.2 µm. It was less then the nonuniformity thickness of the shells. Thus, we have shown the possibility of the characterization of inner surface of the transparent shell. Further device improvements will be needed to increase the range of the measured parameters.
Parameters of shells
3. MEASUREMENT OF LASER FUSION TARGETS PARAMETERS BY X-RAY SPECTRAL METHODS (M. G. Vasin, A. V. Veselov, Yu. V. Ignat'ev, V. M. Izgorodin, A. E. Lachtikov, A. P. Morovov, V. V. Nazarov, A. V. Pinegin, V. N. Romaev)
X-ray spectral techniques possess a number of advantages and are applied in various measurements of element composition, optical thickness of substance, geometrical parameters, etc. Practically, all methods of the analysis can be applied to the problem of characterization of spherical, cylindrical, and flat targets used in experiments with laser plasma. For universal certification, it is optimal to use the techniques of the analysis developed on the basis of fundamental parameters (Mantler, Reference Mantler1987). X-ray spectral techniques allows us to define simultaneously element composition and thickness of a film (Laguiton & Parrich, Reference Laguiton and Parrich1977; Nazarov, Reference Nazarov1991), to develop the analysis of multi-layered samples in view of inside- and inter-layer matrix effects (Mantler, Reference Mantler1986; Huang & Parrich, Reference Huang and Parrich1986), to measure composition and component quantity of a gas mix in spherical targets (Weinstein & Weir, Reference Weinstein and Weir1980; Ignat'ev et al., Reference Ignat'ev, Vasin, Veselov, Izgorodin, Lakhtikov and Moroovov2002), and composition of the shells. At its realization, it is not required to have plenty of standard samples.
3.1. Measurement of Gas Amount in Spherical Targets
The measurement scheme of gas amounts in microspheres is presented in Figure 4. At measurement with external excitation of fluorescence, the microsphere is placed in a two-channel vacuum chamber for exclusion of parasitic fluorescence of air. Exciting radiation of the X-ray device can serially pass through both of the channels. One of the channels is intended for background measurements, and the second channel is the worker, the investigated microsphere is placed on its axis in the chamber. For removal of fluorescent radiation from the detector, the hole in the center of a face wall of the chamber is prepared. All holes were closed by a thin lavsan film. If the target contains T, the X-ray device is not required as fluorescent radiation is excited by the β-electrons of T.
The scheme of measurements of gas amount in microspheres.

3.1.1. Targets Filled with T
Spectra of X-ray radiation of glass microsphere containing T and Ar are presented in Figure 5. Peaks of Si, K, Ar, and a braking spectrum are visible in the figure. Si and K are components of the glass shells.
Spectrum of X-ray radiation of the target filled with T and argon.

The quantity of T is based on the knowledge of glass composition, geometrical measurement, and literary data about an electron energy distribution, section of excitation of X-ray radiation, and its absorption in substance. As a base expression, the expression for the quantum amount of the analytical falling-line of a microsphere wall on the detector in time units are shown below,

where X is the radius of a reception platform of the detector, x, Φ are the polar coordinates of the detector platform, r 0 and d are the internal radius and wall thickness of a microsphere, r, θ, φ are the spherical coordinates for microsphere volume, L and l are the distances from the microsphere center up to the center of the reception platform of the detector and between any points of the microsphere and detector, l i, μi are the length of i-th part of a way and factor of absorption in gas, microsphere wall, air, and a material of the detector window. The intensity of radiation generated in a microsphere wall is equal to
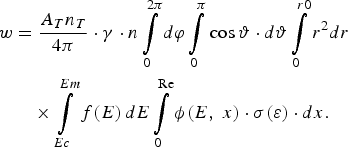
Here A T and n T are a constant of decay and density of T particles in the microsphere, γ is the efficiency of fluorescence, n is the density of atoms of measured element, f(E) is the function of energy distribution of β-electrons, ϕ(E, x) is the function considering elastic scattering of electrons and loss of its energy at movement in the environment (Reed, Reference Reed1975; Pavlova et al., Reference Pavlova, Belozerov, Paradina and Suvorov2000), σ(ε) are the cross-section of ionization from a corresponding electron shell (for example, K-shell) at collision of atom with β-electron having energy ε; E C and E m are the boundary energy of ionization and maximal energy of β-electrons, R e is the distance on which the electron energy decreases up to E C.
In Table 2, results of calculation of gaseous DT (0.5:0.5) pressure for two microspheres on spectral data of K-lines of Si and K with the use of Eqs. (1) and (2) are presented. Values of parameters for calculation have been made (Reed, Reference Reed1975; Pavlova et al., Reference Pavlova, Belozerov, Paradina and Suvorov2000; Nemets & Hofmann, Reference Nemets and Hofman1975; Mukhin, Reference Mukhin1974; Krause, Reference Krause1979). The values of pressure obtained experimentally by the method of optical interferometry (Veselov et al., Reference Veselov, Dudin, Komleva and Pukhov1981) are here given.
Definition of gas pressure in microspheres
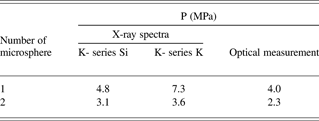
From Table 2 it is visible that there is a significant difference in the calculated value of pressure from the value obtained by an optical method. Therefore, calculation on fundamental parameters can be used today only for an estimation of the value. For more exact determination, calibration of all measuring scheme as a whole is required. Comparison of calculated and experimental spectra of brake radiation has shown their coordination with accuracy of 30–40%.
The amount of Ar in microspheres containing T is based on the comparison of intensity of Ar characteristic peak and intensity of peak of a reference element (for example, Si), or continuous radiation in the power range of Ar peak. In both cases, the T amount almost does not influence the result. In the second case, for the definition of Ar pressure p in the microsphere, a simple formula (Weinstein & Weir, Reference Weinstein and Weir1980) is used

where Q is the ratio of intensity of Ar line to intensity of continuous radiation in a spectral range of this line. Factor C is a constant in small limits of change of r 0 and d, and at small amount of Ar. Its value can be defined in the calibration experiment. For use of Eq. (3) in a wider range of r 0, d, and p, it is necessary to remember that C is a function of these parameters and Eq. (3) becomes a nonlinear equation.
Except for the examples specified here, the spectral measurements of intensity of X-ray radiation can be used for studying solubility of T in various materials. Base expressions are Eqs. (1) and (2) with some changes.
3.1.2. Targets without T
The spectrum of the microsphere filled with sulfur hexafluoride is presented in Figure 6. In spectrum, peaks of Si and K are a part of the glass microsphere, and sulfur is a part of the SF6 molecule. Other peaks relate to the scattered radiation of the X-ray tube with a vanadium anode. It is visible that there is practically no background radiation.
Spectrum of X-ray radiation of the shells filled with sulfur hexafluoride (SF6).

The determination of gas amount in microsphere is made by comparison of intensity of characteristic radiation of the element, which is part gas, and a reference element of shell. The quantity of sulfur hexafluoride was defined by the intensity of the sulfur K-line. As a reference element, the Si in the glass shell is taken. The partial pressure of gas p in a target can be defined by expression

where S g and S Si are the areas under corresponding peaks of a gas element and Si, and d, r 0 are the wall thickness and radius of shell, accordingly. The factor k is or in calibrating experiment or by calculation determined.
Fundamental equations for calculation k are equations for power of characteristic lines radiation of elements of gas S g and glass S Si. Division of S g into S Si gives Eq. (4) with factor

Q(r, d, p) is a complex function of radius, wall thickness of the shell, and gas pressure, and within limits of their change of 0–0.5 mm, 0–10 µm, and 0–10 atm., its value is in the range of 0.6–2.5.
Results of the comparison of calculated and experimental values of the actor k are shown in Table 3. It is visible that the difference between them does not exceed 10%. The analysis of the influence of the measurement scheme parameters has shown that the main influence on the results of the measurement exerts the spectrum of exciting radiation. For example, carrying out during a measurement series, a change of the intensity or a full disappearance of the continuous spectrum of the exciting radiation a mistake of up to 20% may occur if these changes are not considered. Therefore, the stabilization of the spectrum of exciting radiation improves considerably reproducibility and accuracy of measurements.
Results of comparison of calculated and experimental value of factor k

3.2. Measurement of Composition and Thickness of Flat and Profile Film Samples
The fullest and adequate description of properties of multi-layered films, the combination of X-ray absorption, and fluorescence (RFA) techniques of the analysis can be given. They allow defining composition and mass thickness of layers of a film. The X-ray absorption method has the minimal mistake of measurement at greater film thickness while the RFA method gives the minimal mistake at small thickness (Fig. 7). Use of a probing beam of small diameter allows to carry out scanning on the area of the sample and to develop not destroying control of finished multi-layered and multistage targets.
Dependence of a relative mistake of film thickness measurement by RFA (1) and absorptive (2) methods.

The scheme of film parameter measurements with use of both methods is shown in Figure 8. Radiation of X-ray tube 1 goes through diaphragm 7 on the secondary targets and excites in it probing radiation in the form of line spectra of the elements, which is a part of the secondary target. Probing radiation passes through collimator 5 and scanning diaphragm 6, through sample 4 and detector 3 and fluorescent radiation—to detector 3a. Enclosed by shaped lines area 8 containing scanning diaphragm and the sample should be evacuated down to an entrance window of the detector.
Scheme of measurement of film parameters. (1) the X-ray tube, (2) secondary target, (3, 3a) X-ray detectors, (4) sample, (5) collimator, (6) scanning diaphragm, (7) diaphragm.

At definition of film thickness by RFA method, it used the comparison of intensity of an analytical line of measured film and the massive sample. At excitation of the film sample by characteristic radiation of a secondary target, the equation for definition of mass thickness of a film m may be given by

where I mi and I ∞i are intensity of fluorescence of i-th element of a film and massive standard sample; I (E r) is the intensity of quantum with energy E r of characteristic radiation of secondary target material; r is the index of summation on all lines of fluorescence of target material; τi (E r) is the section of photo effect for a quantum with energy E r on atoms' i-th element; m = ρ · d is the mass thickness of the sample; ρ is the density of the sample; d is the thickness of the sample; Кi (Еr) is the factor considering absorption in a material of film for a quantum of exciting radiation and fluorescence of chemical elements of a film, and also geometry of measurements;

μ(E) is the mass factor of absorption in the sample for a quantum with energy Ẹ;  , ψ are the angles of sliding of exciting and registered radiation, accordingly. The bottom boundary of a range of film thickness values measured by method RFA is caused by a limit of detection of analytical peaks of film fluorescent radiation on a background substrate of a registered spectrum.
In X-ray absorption analysis, the dependence of transmission spectral factor of X-ray radiation from thickness and element structure of an investigated material is used, and at known element composition of a multi-layered film, its thickness is defined by means of the following equations set
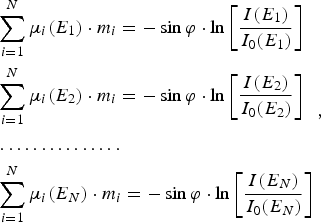
where I(E j) and I 0(E j) are measured intensities of quantum with energy Еj past by sample and in absence of the sample, accordingly; μi(E j) are factors of loss of quantum with energy Еj in films consisting from i-th elements; m i is the mass thickness of a film from i-th element. The solving of Eq. (8) gives thickness of each homoelementic film of which the multi-layered sample is made.
The analysis of profile films is carried out by a transparent X-ray beam with small cross-section size created by diaphragms, collimators, and X-ray lenses. Moreover, the use of X-ray charge-coupled camera with high resolution is possible.
The distribution of intensity of Pb film fluorescence with thickness of 5 µm in the form of a strip with a width of 2 mm (the top curve) on an Al substrate by thickness 20 µm in Cu mandrel (the bottom curve) on a surface coordinate is presented in Figure 9. Results of scanning by the method of local X-ray absorption analysis of the sample made of a Cu and Al film with a thickness of 5 and 20 µm accordingly, are presented in Figure 10. The diameter of the scanning beam was 0.2 mm; the step of scanning is 0.1 mm.
Intensity of fluorescence of a Pb film (1) and copper mandrel (2) in various points of scanning (excitation from side of Pb film).

Intensity of characteristic radiation quantum of a secondary target past the Cu-Al sample depending on scanning coordinates. (1) target from germanium (ЕКa = 9.88 кэВ), (2) target from nickel (ЕКa = 7.47 кэВ).

The 4% inhomogeneity of the intensity of Pb L-band fluorescence in the scanning coordinate visible in Figure 9 is caused mainly by a surface roughness which makes 0.1–0.2 µm. The heterogeneity of the intensity of the radiation transmitted to the Cu-Al sample with respect to the coordinate of scanning in Figure 10 does not exceed 1–2%.
3.3. Conclusion for Measurement of Laser Fusion Targets Parameters by X-Ray Spectral Methods
Measurement of composition of the targets containing T is possible with the RFA method. The definition of the amount of any element including T with use of only fundamental parameters gives a greater mistake and allows receiving only a qualitative value of the measured parameter. It is connected with difficulties of the adequate description of β-electron passage in the plural-component multi-layered environment. The use of reference elements or data about brake radiation allows improving the accuracy of measurements considerably.
Definition of composition of targets without T by means of RFA with use of a reference element allows receiving accuracy up to 10%. Application of monochromatic radiation for fluorescence excitation (secondary target) gives a reduction of the mistake of measurement by two to five times.
The complex application of RFA techniques and absorption analysis allows defining element composition and thickness of both single-layered and multi-layered films applied to micro targets manufacturing. By a choice of optimum energy of the quantum raying the sample or exciting fluorescence, it is possible to achieve the beautiful accuracy of optical thickness measurement for film samples in a wide range. The RFA method gives greater sensitivity and high accuracy for small thickness, and the absorption method has high accuracy at average and greater thickness. Their joint use allows to measure mass thickness of films in a range of 10−6–0.1 g/cm2 (10−3–100 µm) with accuracy of 1–2%. The use of a probing exciting X-ray beam of small diameter or a beam with the slot-hole form allows developing scanning measurements on the sample area.
4. RESEARCH OF STEEL SATURABILITY AND DESORPTION OF HEAVY HYDROGEN ISOTOPE (V. M. Izgorodin, A. P. Pepelyaev, Yu. V. Ignat'ev, E. Yu. Solomatina)
Lately, the method of registration of the secondary radiation (fluorescence) caused by β-electrons of T (Matsuyama et al., Reference Matsuyama, Murai and Watanabe2002; Shmayda et al., Reference Shmayda, Shmayda and Kherani2002), is being developed intensively and used for various purposes. The feature of the given method is that the X-ray radiation generated in a thin (0.5–25 µm) near-surface layer of a sample is registered. Actually, the attenuation factor of X-ray radiation with the energy concluded in a power range of T β-electrons is about 20000–400 cm−1 (Nemetc & Hofman, 1975). Therefore, the fluorescence analysis is an effective method for studying absorption and desorption of T, and its thickness distribution in samples of various materials. The results of research can be assigned to all other isotopes of hydrogen and applied in many hydrogen technologies (hydrogen energetic, hydrogen engines, nuclear fusion, etc.), and at environment pollution research also.
4.1. Experimental
We carried out experiments on saturability with T and kinetics of its desertion for some materials. Those materials were steel 30, stainless steel 12H18N10Т, and also alloy EP543U-ID. Three sets of cylinder samples were made. Samples of one set were coated with Au of about 1 µm thick. Samples with T-charging were conducted at temperature 250°С within 5 days in a special chamber filled with DT mix (0.5:0.5), up to a pressure of 0.4 MPa (the first set of samples) and 4 MPa (the second and third sets, the latter was coated with Au). In the samples of the first set aperture 8 mm in length and 2 mm in diameter was drilled along an axis of the cylinder.
After saturation relative activity monitoring of the samples was performed by means of a proportional gas counter, which registers energy integrated quantum intensity of the X-ray radiation exited by T β-electrons. Besides X-ray spectra of the samples were registered by means of Si (Li) detector. For an estimation of the absolute value of T concentration in near-surface layer of the samples hollow glass microspheres were filled with DT mix and spectra of their X-ray radiation were registered.
4.2. Results
The quantity of impulses for the fixed interval of time received by an integrated gas counter for all the samples depending on time of storage at room temperature are presented in Figures 11 to 13. The figures indicate the monotonous decrease of sample activity. The reduction of the samples activity can be described as follows:

Values of a, b, c, τ1, τ2 are given in Table 4. We can conclude that the activity decline process can be divided into two processes—a galloping one with small time constant τ1 and a slow one with big time constant τ2. We could not determine the value of τ2 for the sample of steel 30 because of small observation time.
Impulse number dependence on time received by the counter (sample set 1).

Impulse number dependence on time received by the counter (sample set 2).

Impulse number dependence on time received by the counter (sample set 3).

Factors values in Eq. (9)

The dispersion of experimental point's values is caused by the impossibility to control the sample position relative to the detector precisely. In case of Au coating, the dispersion increases because of Au layer imperfection and corrosion plays a great role in case of steel 30.
It is clear from the table that the time constants of activity decay τ1 and τ2 decrease from steel 30 to alloy EP543U-ID for not coated samples. For the samples saturated with T at 0.4 MPa, τ1 and τ2 are greater than for the sample coated at 4 MPa. In case of the samples coated with Au, the constants of time τ1 and τ2 weakly differ from each other.
Energy spectra of samples radiation of sets 2 and 3 (covered with Au and uncovered) are shown in Figures 14 and 15. One can see from the figures that it is possible to identify a lot of elements, which form steels: for steel 30 it is Fe, Mn; for 12H18N10T it is Fe, Cr, Ni, Ti; for alloy EP543U-ID it is Fe, Cr, Ni, Ti, Mo. In the spectra of sample set 3, the powerful peak of Au M-band is visible as well as steel elements radiation weakened by the Au layer. All spectra are accompanied by a continuous background of braking radiation.
Radiation power spectrum of sample set 2 (not covered).

Radiation power spectrum of sample set 3 (covered).

4.3. Discussion of Results
Using the method of fundamental parameters at fluorescence analysis (Mantler, Reference Mantler1987), it is possible to estimate T density in radiating area of the sample depending on spectral lines intensity and known steel composition. The intensity of the analyzed element peak of the cylindrical sample, which lateral surface is parallel to a reception platform of the detector, is possible to express in the form of

where X is the radius of a reception platform of the detector; x, Φ are the polar coordinates of the detector platform, r 0, l 0 are the radius and length of the cylinder; r, y, α are cylindrical coordinates of the sample, α1 and α2 are boundary corners of detector visibility from a point of the sample surface, L and l are the distances from the center of the sample up to the center of a reception platform of the detector, and from any point of the sample up to a point of the detector; l i, µI are the length of i-th segment of a way and factor of absorption in the sample, air, and window material of the detector. Intensity of radiation generated in the sample is equal to

Here A T and n T are the decay constant and density of T particles in the sample, γ is the fluorescence efficiency, n is the density of atoms of an analyzed element, f(E) is the function of β-electrons energy distribution, σ(ε) is the ionization cross-section of a corresponding shell (for example, K-shell) during atom collision with β-electrons with energy ε; E C and E m are the boundary energy of ionization and maximal energy of β-electrons, dε/dR is the energy loss speed of electron during its passage in the sample.
Similar calculations for two microspheres filled with DT mix were made in order to check these calculations' correctness. Eqs. (1) and (2) were used. The results of the calculations were compared with values of gas pressure obtained by the method of optical interferometry (Veselov et al., Reference Veselov, Dudin, Komleva and Pukhov1981). Results of calculations and measurements by an optical method are presented in Table 2. Pressure values are calculated using intensity of Si and K peaks. It is visible that the value of pressure obtained by an X-ray method is 1.2–1.8 times larger than the optical one. Therefore, data found by an X-ray method for concentration of T may be accepted to be correct by a factor of two.
A calculated value of T concentration in the samples is a result of intensities of separate peaks elements in spectra and thickness of near-surface layer from which radiation was registered (Table 5). The thickness of this layer is understood as distance where radiation with the given energy is weakened three times. Thus, the T concentration presented in the table is the near-surface areas' average value. Literary data about β-electrons energy distribution runs and factor of electron elastic dispersion, ionization sections and fluorescence efficiency, and also spectral factors of X-ray radiation weakening from (Nemetc & Hofman, 1975; Reed, 1979; Pavlova et al., 2000; Mukhin, Reference Mukhin1974; Krause, Reference Krause1979) were used for the calculations.
Calculated values of T concentration in the samples (1018 sm−3)
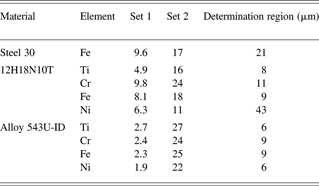
Table 5 shows that the dispersion of T concentration calculated using characteristic peaks of various elements is not so great. Average values of T concentration for different samples and average scattering are given in Table 6.
Average T concentration values for different samples (1018 cm−3)
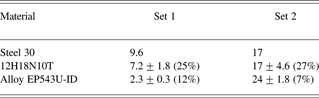
Table 6 indicates that the T concentration in the near-surface layer is 1.8 times greater for steel 30 at increase in saturation pressure from 0.4 MPa up to 4 MPa. At the same time, the T concentration increases 2.4 times in 12H18N10T and 10 times in alloy EP543U-ID at the same increase in saturation pressure.
As the gas-discharge counter was energy integrated, the quantity of counted impulses is defined by both characteristic and a continuous spectrum of radiation. Calculated and experimental spectra of braking radiation of one of the microspheres are given in Figures 15 and 16.
Experimental and calculated spectra of β-electrons braking radiation in microsphere.

For the calculation of the braking radiation intensity generated in microsphere, Eq. (1) was used. In this equation, w was defined as follows

where k is energy of X-ray quantum; n i and dσi(k, ε)/dk are atoms density and cross-section of X-ray quantum radiation with energy k at braking of electron with energy ε for an i-th element of substance (Pratt et al., Reference Pratt, Tseng, Lee and Lynn1977). Here, the consent between calculated and registered spectrum is good enough.
Thus, course of time dependence of samples activity registered by the gas-discharge counter is possible to use for quantitative estimations of absolute value of T concentration and to estimate this value at the moment of time right after saturation.
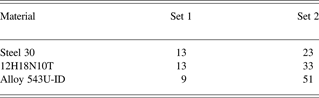
Results of such estimation are shown in Table 7. Here, values of T concentration from Table 6 as reference values and time dependences of activity are shown in Figures 11 and 12. The registration of spectra was carried out for samples from the first set on day 191 and the second sets on day117 after saturation. Figures 11 and 12 and Table 6 show that the quantity of the counted activity decreased for steel 30 about 1.3 to 1.4 times, for 12H18N10T about 1.8 to two times, and for alloy EP543U-ID about four and two times in set 1 and set 2, accordingly, for these time intervals.
Estimated concentration of T in time right after saturation (1018 cm−3)
4.4. Conclusion for “Research of Steel Saturability and Desorption of Heavy Hydrogen Isotope”
The kinetics of T desorption from samples of three types of steel: steel 30, stainless steel 12H18N10T, and alloy EP543U-ID was experimentally investigated. The desorption-character can be described by two declining exponential functions with small and large time constant τ1 and τ2. When the saturation pressure was 0.4 MPa, time constants τ1 and τ2 came to 260 and ∞ days for steel 30, 60, and 930 days for stainless steel 12H18N10T and 25 and 200 days for alloy EP543U-ID. With increase of saturation pressure up to 4 MPa, the time constants became equal to 45 and 600 days for steel 30, 25, and 250 days for stainless steel 12H18N10T and 15 and 150 for alloy EP543U-ID. For samples, coated with Au τ1 and τ2 are 20–30 and 700–900 days, respectively, for all materials. Desorption in that case is determined by gas diffusion through Au.
It is shown that the use of fundamental parameters method at fluorescence analysis allows performing measurements of T concentration and studying of its evolution in the near-surface layer in various saturated samples with change of time. Specification of fundamental parameters values, careful fixing of measurement geometry, and development of the account of non elastic electron dispersion in a calculation technique, will allow improving the accuracy of measurements considerably. Computation estimations of T concentration absolute value in near-surface layer of samples with use of experimental peak intensities of characteristic radiation gave the following values: 13 × 1018, 13 × 1018 and 9 × 10¹⁸ см−3 at the moment of time right after saturation at pressure 0.4 MPa, and 23 × 1018, 33 × 1018 и 51 × 1018 см−3 at pressure 4 MPa for steel 30, stainless steel 12H18N10T and alloy EP543U-ID accordingly.
5. TARGETS FOR STUDYING THE EQUATION-OF-STATE (A. P. Balyaev, A. V. Veselov, S. G. Garanin, A. G. Golubinsky, V. M. Izgorodin, E. Yu. Solomatina, I. N. Cherkesova, V. V. Chulkov)
The target for studying the equations of state target consists of an Al base plate with a thickness of 50–100 µm, two Al layers in the form of steps, and an investigated material. Steps are put on one of the surfaces of a base plate and divided by an interval of 50–150 µm (Fig. 17). The height of the steps is 4–10 µm. Investigated materials are Pb or Cu. In some cases, the side of a target with steps is coated with 0.3–0.6 µm layer of Al. This is done for alignment of intensity of the light radiation arising at an output of a shock wave on a target surface. Sometimes the other side of the target, which a laser impulse influenced, is covered with a layer of polyparaxylilene (parylene) with thickness of 8–10 µm. All this assembly is placed on the flat steel holder opposite to a diagnostic aperture with a diameter of 1 mm. The additional aperture for the target adjustment with diameter of 30–40 µm is done on the holder that is 6 mm from the diagnostic aperture.
The scheme of EOS target. On the left is an arrangement of layers, on the right is disposition of a target on the holder: (1) the holder, (2) target, (3) aperture for adjustment.

The accuracy of the hock wave velocity measurement is defined in particular by the quality of target manufacturing, therefore, accuracy requirements for working layers in equations of state targets are high (Koenig et al., Reference Koenig, Bondenne, Batini, Benuzzi, Bossi, Temporal and Atzeni1995). The nonuniformity of layers thicknesses should be <1% and a base plate of <0.4%. The target deviation is formed from surface roughness, nonuniformity of thicknesses of a base plate, and step layers, and also inaccuracy for these sizes measurements.
5.1. Manufacturing of a Base Plate and Steps by Pressing Method
Originally, the base plate was an industrial Al foil with the thickness of 50–100 µm and made by a rolling method. On the surface of the foil were characteristic inhomogeneities in the form of strips. The amplitude of surface inhomogeneity runs up to 0.5–0.6 µm (Fig. 18a). Besides a Cu industrial foil with a thickness of 30–50 µm was used. Its surface inhomogeneity was two to three times less. Steps of investigated metals were deposited by resistive evaporation in vacuum, or magnetron sputtering. At Al steps deposition by magnetron sputtering, the surface of a layer was opaque, and did not give a fringe pattern. Resistive sputtered Cu films were the best (their surface repeated a structure of a substrate surface almost precisely). Resistive coated Pb films were rough.
Microinterferograms of base plate surface ((a) before pressing, (b) after pressing).

An industrial foil pressing has been applied to receive smoother surface of a base plate (Krasnikov, Reference Krasnikov1976; Gunn et al., Reference Gunn, Yakovlev, Prudkovskij, Galkin, Ryzhov, Golovin and Brunilin1974). For this work, a foil piece was pressed out between polished surfaces of steel plates. The amplitude of foil surface inhomogeneity was 0.1–0.2 µm (Fig. 18b).
Moreover, we attempted to make steps by foil pressing to reduce the roughness and intermediate layer width. For that, a good matrix was necessary. Attempts to make matrixes of high quality have shown that the best results turns out to be an assembly of a matrix from the polished details. By development of a matrix and mirrors design, pressing conditions have allowed to receive at press of Al foil steps with height up to 10–20 µm and width of transitive layer 1–3 µm, with small roughness (~0.01 µm), and good parallelism of surfaces. Technological advancement enables to make the adjustable step size. The 3D image of a step made with scanning interferometer is presented in Figure 19.
3D image of a step surface with height 11.2 µm .

The variant two steps production by means of one matrix has been tested too. The prototype of such a matrix has been made. It enables to assemble three variants of steps. 3D images of steps on Al foil made by means of such a matrix are presented in Figure 20. The two-stage targets on a Cu foil have been received too.
The further update of a matrix design from the point of view of rigidity, convenience of adjustment of the demanded height of steps, durability will allow to receive good repeatability of target parameters and an opportunity of their mass manufacturing.
3D images of steps on Al foil made by means of two-level matrixes, the width of a mean plane is 100 µm, steps heights are: (a) 9.7 and 16.5 µm, (b) 7.4 and 6 µm, (c) 3 and 10 µm.

5.2. Manufacturing of Metal Steps by Vacuum Evaporation
Manufacturing of metal step layers was carried out by resistive evaporation in vacuum through a mask, close-fitting to a substrates surface. In this case, the sharpest step border is obtained, and the width of a transitive zone is 5–15 µm. At magnetron sputtering, this size was in two to four times more.
5.2.1. Manufacturing of Cu and Pb Step Layers
The resistive sputtering from tape heater was used for Cu and Pb steps deposition. The height of steps was up to 10 µm. It is possible to manufacture multi-stage (3–4 steps) targets from one material by mask shifting. The interferogram received on micro-interferometer МII-4 two-step target Al/Cu (height of 7 and 5 µm) on a Cu substrate with thickness of 40 µm is shown in Figure 21. The width of a transitive zone of steps does not exceed 10 µm.
Interferogram received on micro-interferometer MII-4 of the target with Al and Cu steps (heights 7 and 5 µm ) on a Cu base plate (thickness 40 µm ).

The condition of a Cu layer surface is good. The Pb surface becomes very rough at a thickness above 0.5 µm. The surface profiles of a Cu layer and the Pb layer are represented in Figure 22. They were measured with an atomic force microscope Solver P47. The root-mean-square roughness is about 80 nm for Pb, and 10 nm for Cu. The cross-section size of grains was about 30 nm for Cu and 300–400 nm for Pb.
Surface structures of the copper film (a) and the Pb film (b), measured with an AFM.

5.2.2. Al Layers Manufacturing
Films of Al in a range of thickness up to 10 µm were produced by sputtering in vacuum on installation VUP-5 with oil-free pumping and working vacuum about 10−3 Pа. Sputtering was fulfilled by means of an evaporator in which the pyrolitic boron nitride crucible was used. Thermometry of crucible bottom and automatic temperature level control were realized during sputtering. The working temperature of a crucible bottom was preset to a range of 1150–1200°C with accuracy ±2°C. Clearing of substrate surfaces and chamber walls before film deposition were realized by ionic etching in an Ar atmosphere, warming up and prolonged pumping.
In these conditions, it was possible to produce thick Al film much more smooth, than at magnetron sputtering. The interferogram of surface of 12.6 µm Al film is represented in Figure 23. It has been deposited on a glass substrate and a substrate from polished NaCl. A presence of enough precise interference fringes enables to prove that the amplitude of a roughness does not exceed 0.1 µm. Measurements of these films roughness with scanning white light interferometric profilometer are received in both cases about identical values of 0.05–0.06 µm.
Interference fringes received by micro-interferometer МII-4 on a surface of an Al layer with thickness12.6 µm deposited on a glass substrate (a) and polished NaCl substrate (b).

Measurement of a film roughness with atomic force microscope (AFM) has given 70 nm for average amplitude of surface roughness at the cross-section size of grains of 20 nm. The structure of this film surface measured with AFM is represented in Figure 24.
Surface profile of an aluminum layer with thickness 12.6 µm on NaCl substrate, measured with AFM.

Single- and multi-stage targets were made using the crucible evaporator. The first step was deposited on a polished Al base plate with a thickness of 50 µm, and then consecutively two to three steps of Al were deposited with shift of a precision mask on 50–100 µm. The example of resulting surface profiles is represented in Figure 25.
A three-stage target manufactured by crucible evaporating aluminum with consequent precise displacement of mask.

Measurement of geometrical parameters for two-step (Al/Cu) targets by means of optical interference profilometer have shown that the characteristic sizes of targets are: step height (up to 10 µm) with a surface roughness for Al, 0.05–0.2 µm, for copper, 0.02–0.04 µm, distance between steps, 50–150 µm, and width of a transitive zone, 3–5 µm. The surface roughness of a Cu layer is almost completely defined by the surface roughness of a base Al plate.
5.3. Development of Optical Measurement of Step Height and Layer Roughness
Originally, the thickness of a layer and an estimation of a surface roughness were realized with Linnik micro-interferometer МII-4. The layer thickness of opaque materials was defined by interference fringes shift at simultaneous supervision of a substrate surface and the deposited layer surface. For a continuous film, it was necessary to do a scratch to observe the substrate. If the film was transparent with a known refraction index, its thickness could be measured without presence of a sharp step or a scratch. The shift of fringes was defined visually, and the precision of the measurement could be not worse than 0.05 µm at high quality of fringe pattern.
However, micro-interferometer МII-4 was developed in 1937, and ever since, these methods of surface structure measurement advanced forward. The developments in computer technologies, in charge-coupled-device-camera manufacturing, and the achievements in the exact mechanics have enabled to raise considerably the precision of measurements, their visualization, to be released from usual “operator's error” at measurement of surface imperfections. Scanning white light interferometric profilers provides vertical resolution <0.1 nm with the lateral resolution 0.43 mcm.
In our laboratory, we attempted to modernize the micro-interferometer by adding on a model for scanning white light interferometer (Deck & de Groot, Reference Deck and de Groot1994; Sinclair et al., Reference Sinclair, de Boer and Corwin2005). The micro-interferometer МII-4 has been taken as a basis for the given device. A number of basic constructive changes have been made. Automatic moving of the optical system with a step of 0.01 µm has been introduced, that has permitted to apply the scanning interferometric techniques (de Groot & Colonna de Lega, Reference de Groot and Colonna de Lega2004).
This variant was described previously when talking about not destroying control of the structure of spherical shell surfaces. By means of the described device, 3D images of surface structures are shown in Figures 19, 20, 25. Now, the device allows making measurements of step height with accuracy of ±0.1 µm and measurements of a roughness with accuracy of ±0.01 µm at the resolution in a cross-section direction 0.5–1 µm.
5.4. Measurements of Film Thickness by X-Ray Spectral Methods
The combination of X-ray absorption and fluorescence (RFA) techniques of the analysis can give the fullest and adequate description of properties of multi-layered film samples. They permit to define the composition and optical thickness of the films. The X-ray absorption method has the minimal measurement error at greater thickness of film samples (more than 1–3 µm), while the X-ray fluorescent method gives the minimal error at smaller thickness. Furthermore, the fluorescent method enables to make the element analysis in multi-layered film samples. Use of a probing beam with small diameter enables to carry out scanning on the area of the sample and to develop not destroying control of finished multi-layered and multistage targets (Vasin et al., Reference Vasin, Ignat'ev, Lachtikov, Morovov, Nazarov and Trahtenberg2007). As an illustration, there is a fluorescence intensity distribution on a surface of Pb film (the top curve) on Al substrate in Cu mandrel (the bottom curve) in Figure 26. Diameter of a scanning beam is 0.2 mm.
Fluorescence intensity of Pb film (the top curve) and copper mandrel (the bottom curve) in various points of scanning (excitation from side of Al film).

In Figure 27, there are presented the results of scanning by a local X-ray absorption method for sample made from Pb and Al films. The step of scanning is 0.1 mm. Evidently, uniformity of film thickness on surface region ~1 mm is within the limits of 1–5%.
The combined application of X-ray techniques of fluorescence and absorption analysis permits to measure optical films thickness in a range of 6 × 10⁻⁷–0.1 g/cm2 (6 × 10⁻⁴–100 µm) with accuracy of 1–2% (Vasin et al., 2007).
Intensity of characteristic radiation of a secondary target passed through the Pb-Al sample versus scanning coordinate. The bottom curve – a nickel target (ЕКa = 7.472 KeV), the top curve is a zirconium target (ЕКa = 15.746 KeV).

5.5. Measurement of Film Thickness with Alpha-Spectrometry Method
Determination of layers and films thicknesses (self-supported and on a substrate) is carried out without destruction of the sample by measurement of energy losses in the sample for passing α-particles (Bethe & Ashkin, Reference Bethe, Ashkin and Segre1953). At measurements by this method, the investigated sample is located in the vacuum chamber, where it is irradiated by α-particles of Pu-239 source, which spectrum is registered by the Si surface-barrier detector. The thickness is measured on the displacement value of the peak center for α-particles (5155.4 keV energy). To control the spectrometer path characteristics, the detector is in addition highlighted (sideways, passing the sample) by Pu-238 α-particles with energy of 5456.5 and 5499.2 keV. The method provides reliable registration of displacement from 15 keV.
Instrumental spectra are represented at thickness measurements for different Cu films in Figure 28. It is clear from the figure that there is a tendency of line width increase of α-particles' power spectrum with film thickness increase. This effect for a case of a Cu film is caused mainly by straggling. However, in case of a Pb film, the roughness of a surface gives the appreciable contribution in broadening of the displaced peaks.
Instrumental energy spectra of alpha particles at copper film measurement (FWHM is line width on half-height).

Thus, by this manner, it is possible to accept the ranges of thickness registration of 0.1–15 µm for Al, 0.01–8 µm for Cu, and 0.05–12 µm for Pb. The measurement error is 4–5%. Unlikely, the measurement accuracy can be raised appreciably. However, received instrumental spectra enable to make estimations of the sample uniformity on thickness, density and composition, and also to define the presence of cracks and chips. All these imperfections and damages Pb to a spectrum line spreading and to occurrence of additional peaks.
5.6. Conclusion for Targets for Studying the Equation-of-State
Now, the following methods are applied for equation of state targets manufacturing: (1) pressing of industrial Al foil has enabled to reduce the height of the surface roughness from 0.5–0.7 µm down to 0.1–0.2 µm; (2) surface polishing for Cu industrial foil permits to receive base plates with a surface roughness 0.05 µm; (3) the pressing method has enabled to produce single- and multi-stage targets from a homogeneous material, Al or Cu, with surface roughness less than 0.05–0.1 µm, and width of a transition zone for steps no more than 3 µm; (4) the vacuum sputtering method at corresponding processing of the base plate surface gives the possibility to make Cu and Pb steps with a root-mean-square surface roughness of 10 nm and 80 nm, accordingly, and with transitive zone width no more than 10 µm. The average lateral dimension of roughness is 30 nm for Cu and 300–400 nm for Pb; (5) we succeeded in sputtering deposition films of Al with 10 µm thickness and RMS surface roughness of 50–70 nm, using the crucible evaporator and corresponding substrate processing.
Developments of measuring methods enable to register the parameters of targets with sufficient accuracy: (1) using of industrial white light optical interferometer MII-4 permits to measure a step height up to 10 µm with an accuracy of 0.05 µm and with lateral resolution of about 0.5 µm. On the basis of this device, the scanning white light interferometer has been created. It enables to receive the 3D image of surface structure in the 150 × 190 mcm2 field-of-view and to measure a step height up to 50 µm with an accuracy of 100 nm; (2) development of X-ray spectral methods has enabled to measure film thickness with accuracy of 1–2% and by scanning to build a one-dimensional profile of layer thickness for films with various element structure; (3) τηε α-spectrometry method permits to receive a qualitative value of film thickness heterogeneity on the chosen area of a target; (4) τηε use of an industrial atomic-power microscope enables to receive a 3D image of a film surface with accuracy of 0.1 nm and the lateral resolution of 1–10 nm. Measuring of the surface with a height step up to 5 µm is possible.
6. CONDENSED GASES JET GENERATOR FOR NANOLITHOGRAPHY (F. M. Abzaev, A. V. Bessarab, V. G. Gogolev, A. G. Golubinsky, V. M. Izgorodin, D. A. Irinichev, G. P. Nikolaev, I. M. Rojz, D. Ju. Fenoshin)
Development of lithographic devices using super hard ultraviolet radiation (nanolithograph) is carrying out in many micro-electronics centers at present. A source of such radiation is the laser plasma. The most preferable is the plasma activated in condensed noble gases, especially in Xe (Diefendorff, Reference Diefendorff2000; Hansson et al., Reference Hansson, Bjorn, Rymell, Berglund, Hemberg, Janin, Thoresen, Mosesson, Wallin and Herz2002).
The jet of condensed Xe as a source of ultraviolet radiation possesses some advantages. They are a rich spectrum of radiation in demanded area with the large efficiency of transformation of laser radiation and absence of contamination of a surface of optical details of nanolithograph during its work. However, at use of Xe there are also a number of problems. The main things from them are high cost and need of powerful system of evacuation.
6.1. Theory and Estimations
Functionally, the jet generator consists of four basic parts: the pipeline bringing gas, the condenser, the store of liquid Xe, and the nozzle (Fig. 29).
The block diagram of the jet generator. (1) the pipeline, (2) condenser, (3) store of liquefied gas, (4) nozzle, (5) jet.

Gas moves in the condenser on the pipeline and is preliminary cooled. Walls of the condenser are at constant temperature T w. In the condenser, gas is cooled up to the temperature close to the wall temperature and condensed, if T w is below the temperature of condensation T K. In the store, the homogeneous velocity field of a liquid is formed on an input in nozzle, therefore the stability of the outflow in direction is provided. The expiration of a liquid occurs in the evacuated chamber.
6.1.1. Calculation of Parameters of Flow and Condensation
For the calculation of the mean of cross-section flow parameters in the jet generator, the equations for velocity, temperatures, pressure and the consumption of a liquid and gas, and also for the area of cross-section of a liquid phase were used. A basis of the equations was the conditions of continuity and conservation of energy and impulse. The flow was supposed to be one-dimensional and stationary. At transition from a mode of only gas flow to a mode of gas-liquid flow, it was supposed that at excess of pressure above the pressure of condensation, the liquation of gas part occurs in steps with conservation of weight and energy (Samoilovich, Reference Samoilovich1990; Altshul et al., Reference Altshul, Zhivotovsky and Ivanov1987).
Results of calculations of gas flow parameters without condensation (pressure, velocity and temperature of gas, and also its density, Mach number and the mass consumption) are presented in Table 8. There the temperature of a condenser wall becomes equal to 80 K, and the temperature of the pipeline linearly decreases with distance from 300 K down to 80 K. A nozzle was thin enough (a length was much more less then a diameter).
Results of gas flow parameters calculations without condensation

It is clear that the Mach number is close to 1 on the exit of the nozzle, and the mass consumption is constant. It is the confirmation of calculations' correctness.
Dependences of the liquid consumption and gas velocity on distance in the condenser are resulted at liquation presence in Figure 30 as a sample of calculation for the case T w < T K.
Dependences of the liquid consumption (a) and gas velocity (b) on distance in the condenser. The curves 1, 2, 3, 4, 5 correspond to temperature of condenser wall of 160, 155, 150, 145 and 140 K.

6.1.2. Problem of Liquid Boiling-up in a Jet at Pressure Reduction
At movement of a liquid in the nozzle channel, the pressure decreases from initial pressure p 0, and reaches the value of the saturated vapor pressure p S on the length of the way l. At the further movement, the pressure continues to decrease, and the liquid becomes overheated. As a result, there are conditions for fast growth of bubbles on small solid inclusions, and the liquid boils in all the volume (Frenkel, Reference Frenkel1975).
The minimal radius of bubble is the radius of the nuclear particle formed by molecules of gaseous impurity (H2O, CO2). The radius of the nuclear particle grows constantly due to sticking to it of impurity molecules. Then in absence of solid particles of an impurity, at the beginning of condensation, the condition of not boiling-up of the liquid can be written in the form of

where n d/n Xe is the atomic concentration of impurity, σ is the factor of surface tension, D is the coefficient of molecule diffusion of an impurity in liquid Xe, and t is the time interval from the beginning of condensation. For the nozzle unit working temperature of 170 K and the time from the beginning of condensation of 10 min, an estimation gives the maximal maintenance of impurity 0.4 at.%.
If the liquid leaves the channel in vacuum before volumetric boiling-up, then after an output of a jet in vacuum, a strong evaporation begins on the surface. It leads to cooling of a liquid and suppression of volumetric boiling-up. Further, the liquid moves in the form of an integral jet that gradually solidifies. If the growth of bubbles occurs to the big velocity then at an output in vacuum the jet is sprayed in the form of vapor-liquid suspension losing the integrity.
Therefore, to provide the outflow of a jet without spraying it is necessary: (1) to work with well cleared gas; (2) at possibly low temperature; (3) at large velocity of the liquid outflow; (4) at probably smaller length of nozzle capillary.
6.1.3. Problem of Jet Stability
The development of the instability of a jet direction is connected with turbulence. It arises mainly at excess of the Reynolds number over the critical value equal to 2000. Moreover, turbulence can be initiated by formation of large bubbles, gas cavities on capillary wall at liquid boiling-up and solid microparticles. The greatest velocity of liquid movement is in a capillary. For short capillaries, jet instability arises mainly because of the presence of the solid microparticles that have adhered to the wall of the nozzle.
6.1.4. Behavior of a Jet in Vacuum
At an output of a jet in vacuum, it is cooled because of intensive evaporation of a liquid from its surface. The process of cooling is described by the equation of balance of power flow in cylindrical jet with radius a:

Here, ρ is the density of the liquid, C V is the heat capacity, T is the average of radial temperature, L is the heat of evaporation, G is the speed of evaporation of liquid, Q R is the heat leakage due to radiation of chamber wall, Q T is the heat leakage due to heat conductivity of gas, and Q S is the thermal emission at liquid solidification.
In Figure 31, dependences of the average temperature and radius of a jet on time for all cooling stages are presented. At calculation, the heat leakage has been taken as minimally as possible. In the figure, it is visible that within (15–25) × 10−6 s (depending on diameter) after an output from the nozzle, the jet freezes completely. At characteristic liquid velocity of 10–20 m/s, the section of the jet that is on an output nozzle will depart on a distance of 0.15–0.5 mm. If the liquid velocity will be less, the front of solidification can come inside of the channel. The resistance to the movement of a jet, as a result, will increase, that else more will reduce the velocity. If the heat exchange with a wall of the channel will be insufficient, the process can end with full freezing of the channel. It is visible also that at full freezing of a liquid in a jet its diameter decreases by about 15%.
Dependences of average temperature (a) and relative radius (b) of a jet on time for initial diameters 20 µm (1) and 40 µm (2).

6.2. Experiments with a Jet. Choice of a Working Mode
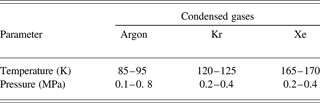
Experiments on studying the behavior of a jet were realized at test of nozzle unit variants and for a choice a thermophysical mode at which the stable existence and the greatest stability of a jet are provided. Experiences were carried out for three inert gases – Ar, Kr, and Xe. As a result of experiments, the operating conditions of the nozzle unit for different gases have been certain. They are summarized in Table 9.
Operating conditions of nozzle unit for different gases
6.2.1. Experiments with a Vertical Arrangement of a Jet
The view of a jet of liquefied gases is shown on Figure 32. In these experiments, the nozzle variant with the long channel was used. The diameter of the jet is 20 µm, the length of the capillary is 1 mm. During the work, the outflow of the jet was unstable in a direction; it chaotically changed the angle up to ±15°. Perfection of nozzle design has allowed improving the stability of the jet: the deviation of the jet direction on a distance of 1 mm did not exceed its diameter. On a distance of 0.5 mm, the deviation is not appreciable. On a distance of 4 mm from the nozzle, the deviation of the jet can reach ±1 mm. These deviations have chaotic character. On some frame, it is visible that a jet is bent. It is said that the jet is solid.
A view of a condensed noble gases jet under vertical arrangement. (1) Ar, (2) Kr, (3) Xe.

6.2.2. Experiments with a Horizontal Arrangement of a Jet
In Figure 33, photos of a jet of liquid Kr and Xe are presented. In this case, it used a shorter nozzle (diameter of 10 µm, length of 30 µm) than in case of vertical arrangement. The velocity of the liquid equals about 10 m/s. The jet is straight but changes the direction within the angle limits of 15°. These changes in the direction are connected mainly with the solid microparticles getting in the nozzle.
A looks of jet of 20 mcm diameter under horizontal arrangement. (a) Kr (temperature 130–140 K, pressure 0.4–0.5 MPa), (b) Xe (temperature 170–180 K, pressure 0.4–0.5 MPa).

Research on the character of liquid jet outflow depending on temperature and pressure was carried out at cyclic change of temperature. The character of the outflow varied as shown in Figure 34. Thus, pressure was supported to be constant. In experiments, the nozzle with a capillary of a diameter of 15 µm and a length of 30 µm was used, the working gas was Xe. The temperature slowly changed, the average value was nearly 181 K with amplitude of modification of ±2 K. At pressure of 0.3 MPa and temperature above 181 K, the jet was liquid and moved with high velocity. At temperature below 181 K, the jet solidified and moved with small speed. Both cases are shown in Figure 35.
Schematic image of temperature fluctuations of nozzle unit and states of jet. The shaded area is transitive when there is a change of aggregative state of jet substance.

Photos of a Xe jet in liquid (a) and solid (b) state.

At increase of pressure, the time of finding the jet in solid state decreases and at a pressure larger than 0.8 MPa, the jet remained liquid always. Thus, the direction of a jet quickly and chaotically changes within the limits of a cone with angle nearby 10°.
Studying the work of the nozzle containing three capillaries was performed. The capillaries had a diameter of 10 µm and were located on one straight line at a distance of 20 µm from each other. The image of the liquid Xe outflow from such a nozzle is shown on Figure 36. It is visible that the jets deviate from each other. A parallel arrangement of all three jets was not successful.
Photo of the liquid Xe outflow through nozzle with three apertures.

Research of jet behavior at various variants of nozzle unit with the condenser has allowed to choose an optimal operating mode and to create a design with short nozzle. By means of such device, it was possible to generate a liquid Xe horizontal jet, which was stable during tens of minutes.
6.2.3. Experiments on Influence of the Laser Radiation on a Jet
Experiments on influence of the laser radiation on a vertical jet have shown that during an irradiation of a jet by powerful laser impulse on a distance of 1–1.5 mm from a capillary, the failure of the jet is observed. The jet was solid and had a small velocity. Therefore the shock wave arising at formation of the laser plasma had a strong influence. The jet is restored within 1–2 s. This process is shown in Figure 37.
Video of jet failure under action of single laser pulse. (1) jet before pulse, (2) impact of a laser pulse on jet, (3) failure of jet, (4) beginning of jet restoration, (5) restored jet.

At research of the influence of the pulse-periodic laser radiation on a horizontal jet, such a long failure was not observed. The jet was liquid and had greater velocity. The video in Figure 38 shows the outflow of three jets on which laser radiation influences from top. The frequency of shooting was 30 frames per second with time of exposition nearby 0.001 s, the frequency of laser pulse repetition is 25 Hz. The energy of radiation in an impulse was 0.05 J, the pulse duration was 10 ns.
Picture of action of the laser radiation on three liquid jets.

From this frame, it is visible that the laser pulse breaks off the jet too or, at least, changes the direction (the jet becomes curved). Besides, it is visible that the plasma is displaced downward. However, the time of the jet restoration is much less than for the previous case. It makes value much less than 0.01 s. This value will limit the frequency of laser pulses repetition at use of jet as a target. To increase the frequency of laser influence it is required to increase the jet velocity.
6.3. The Conclusion for Condensed Gases Jet Generator for Nanolithography
As a result of experiments, the efficiency of systems of cooling, evacuation and maintenance of working temperature, and pressure has been shown. The optimum design and an operating mode have allowed receiving a jet of liquid Xe that was stable during several tens of minutes. The study of the influence of laser pulses has shown that the time of a jet restoration after the impact of the laser pulse is much less than 0.01 s.
ACKNOWLEDGMENT
This work was financially supported by project ISTC #991.



