I. INTRODUCTION
The efficiency of a thermoelectric (TE) material is measured by the dimensionless figure of merit ZT = S 2σT/κ, where S, σ, T, and κ stand for the Seebeck coefficient, electrical conductivity, absolute temperature, and thermal conductivity, respectively.Reference Goldsmid1 The total thermal conductivity, κ, includes two parts: the electrical contribution, κ e, and the lattice contribution, κ L, the latter of which can be tuned almost independently of other parameters. Filled skutterudites are typical materials for the phonon glass electron crystal paradigm,Reference Slack and Rowe2 and they have been shown to exhibit much lower κ L than their parent compounds. Filler atoms, such as rare earth,Reference Morelli and Meisner3, Reference Nolas, Slack, Morelli, Tritt and Ehrlich4 alkali,Reference Pei, Chen, Zhang, Shi, Bai, Zhao, Mei and Li5 or alkaline earthReference Chen, Kawahara, Tang, Goto, Dyck, Chen and Uher6 elements have been utilized to fill the cages of the open-host skutterudite structures to cause localized rattling, superimposed on the collective motions of lattice plane waves, leading to the scattering of heat-carrying acoustic phonons. In addition to filling parent compounds, nanostructuring has been shown to play an important role in reducing the thermal conductivities of a variety of TE materials.Reference Wu, Zheng, Zhou, Li, Yang and Zhu7–Reference Poudel, Hao, Ma, Lan, Minnich, Yu, Yan, Wang, Muto, Vashaee, Chen, Liu, Dresselhaus, Chen and Ren9
Nonequilibrium synthesis techniques such as rapid solidification and fast sintering are known for producing materials with nanostructures. Recently, a nonequilibrium synthesis method combining melt spinning with subsequent spark plasma sintering (SPS) or hot press has been successfully used in the preparation of filled skutteruditesReference Li, Lin and Zhou10–Reference Li, Tang, Su and Zhang12 and several other TE materials.Reference Tang, Xie, Li, Zhao and Zhang13–Reference Yu, Zhu, Xiao, Shen, Yang and Zhao15 Nonequilibrium-synthesized n-type Yb0.2Co4Sb12+y samples with excess Sb have shown dispersion of nanoscale secondary phase on the grain boundaries.Reference Li, Tang, Su and Zhang12 These nanostructures were believed to have reduced κ L and improved the electrical properties at the same time.
Nonequilibrium synthesis provides a fast and economical way of processing bulk TE materials with superior properties. In this article, we report our combined high-resolution transmission electron microscopy (HRTEM) imaging with chemical composition, lattice mismatch, and strain field analysis of nanoprecipitates (NPs) in the nonequilibrium-synthesized CeFe4Sb12 samples.
II. EXPERIMENTAL PROCEDURE
A. Nonequilibrium synthesis of CeFe4Sb12 polycrystals
High purity element pieces of Ce (99.8%), Fe (99.98%), and Sb (99.9999%) at stoichiometric amounts were loaded into boron nitride tubes, which were then sealed under Ar pressure. The raw materials were molten at about 1450 °C for 30 s in an induction furnace and then cooled down to room temperature in 30 min. The obtained ingot was placed into a quartz tube with a 0.5-mm-diameter nozzle, molten and injected under an Ar pressure of 0.067 MPa onto a copper wheel rotating at a linear speed of 30 m/s. The absolute temperature of the stoichiometric mixture was not measured directly, but this was not necessary as it was fully molten before melt spinning.
The melt-spun ribbons were subsequently subjected to SPS to form dense pellets. The final SPS temperature and pressure utilized were 620 °C and 50 MPa, respectively. The samples were heated up to 620 °C in 2 min and then held at this temperature for 3 min. The power was then shut off, and the densified pellet was cooled to 200 °C in 10 min and subsequently cooled down to room temperature.
The phase composition of the sintered bulk samples was examined by a Philips XRG 3100 X-ray diffractometer using Cu Kα radiation (λ = 0.15418 nm).
B. High-resolution transmission electron microscopy
Samples for transmission electron microscopy (TEM) observation were prepared by a traditional dimpling method. After mechanical polishing and dimpling to a thickness of about 20 μm, the samples were thinned to electron transparency using an ion mill system at low milling angles (6–12°). The specimen stage of the ion mill system was cooled with liquid nitrogen, which helped avoid overheating of local specimen during the milling process to reduce damage to the sample. All TEM samples were ion milled below −90 °C. HRTEM was performed on a JEOL JEM 2100F TEM equipped with a Schottky field emission gun and two exchangeable objective lens pole pieces. The ultrahigh resolution pole piece has a 0.19-nm point-to-point resolution and a ± 20° sample tilt, and the high resolution pole piece has a 0.23-nm point-to-point resolution and a ± 40° sample tilt. It is also equipped with an Oxford energy dispersive X-ray spectrometer (EDS) for chemical analysis.
The local distribution of the strain field around NPs was retrieved using the geometric phase analysis (GPA) software. GPA is capable of generating quantitative deformation and strain maps from standard HRTEM images based on the geometric phase algorithms originally developed by Martin Hytch.Reference Hÿtch, Snoeck and Kilaas16 The first step was to calculate the Fourier transform of the HRTEM image.Reference Wu, Zheng, Zhou, Li, Yang and Zhu7 Phase images were obtained by centering a small aperture on a strong reflection spot g, followed by an inverse Fourier transform. The phase component P′g(r) of the phase image is related to the lattice displacement u(r ) by

where g is the reciprocal lattice vector from the undistorted reference lattice. The two-dimensional displacement field can be derived by applying the method to two noncollinear Fourier components, e.g., g 1 and g 2.


where g 1x, g 1y, g 2x, and g 2y are the x and y components of the g 1 and g 2 vectors, respectively. ux(r ) and uy( r) are the x and y components of the displacement field u(r ) at the position r = (x, y) in the image, respectively. The strain field is then calculated by

III. RESULTS AND DISCUSSION
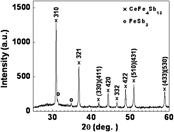
Strong and sharp reflection peaks were observed in the x-ray diffraction (XRD) patterns of the experimental samples (Fig. 1). The reflection peaks were indexed as the majority of the CeFe4Sb12 phase with trace amount of FeSb2, indicating the complete conversion and crystallization of bulk materials from melt-spun ribbons by the very short-duration SPS process.
An x-ray diffraction pattern of CeFe4Sb12 bulk samples synthesized by the nonequilibrium method.

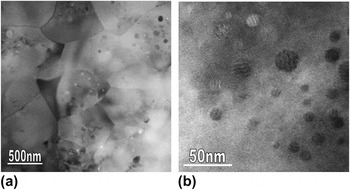
The grains of the experimental samples have been reported to vary from several hundred nanometers to around 1 μm.Reference Zhou, Jie, Li, Tuller, Baniecki, Snyder and Malen17 Individual grains containing abundant NPs were readily observed in the samples, as shown in Fig. 2(a). The TEM image in Fig. 2(b) shows the kind of NPs that are most typically observed. They have spherical shapes with coarse fringes. Further HRTEM imaging shows that they are typically coherently embedded in the matrix. The size of this kind of NPs varies from a few nanometers to <20 nm.
Transmission electron microscope images at (a) low and (b) high magnifications showing nanometer-sized grains of the nonequilibrium-synthesized CeFe4Sb12 samples containing abundant nanoprecipitates (NPs).

EDS analysis suggests that there is no appreciable difference between the sample stoichiometry before and after melt spinning. This shows that off-stoichiometry is not required to produce NPs.
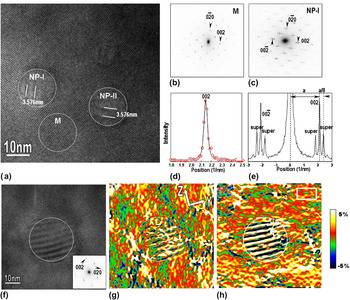
Figure 3(a) is an HRTEM image viewed along the [100] direction, showing two such kind of NPs coherently embedded in the matrix of a single grain. The two NPs are about 15 nm in diameter and show fringes with the spacing being about 3.576 nm. No obvious lattice distortion was observed on the interfaces between the NPs and the surrounding matrix. Here, we denote the two NPs as NP-I and NP-II [Fig. 3(a)]. The fast Fourier transform (FFT) diffractograms from the circled matrix area M and the NP area NP-I are shown in Figs. 3(b) and 3(c), respectively. The matrix is confirmed to be the body-centered cubic–filled skutterudite structure. EDS measurements show that the concentration of Sb in the NP-I and NP-II areas is significantly higher than that of the neighboring matrix. NP-I and NP-II areas are determined to be incommensurate superstructures in the lattice in which excessive Sb atoms order along the matrix c-direction and induce superlattice reflection spots [Fig. 3(c)]. Figure 3(d) shows the line scan of the 002 peak intensity profile from the matrix (red open circles). Accurate lattice parameters were obtained by fitting the profile using a combination of a Gaussian and a Lorentzian function. The black solid line in Fig. 3(d) is the fitting of the 002 matrix peak, from which the lattice parameter of the matrix is determined to be 0.918 ± 0.003 nm. The line scan of the intensity profile from 00−2 peak to 002 peak of the FFT diffractogram [Fig. 3(c)] of NP-I area is shown in Fig. 3(e). The spacing between the main spots and the superlattice spots is measured to be 0.28 nm−1, indicating that the periodicity of the superlattice in NP-I area is about four times larger than that of the matrix. Since the matrix has a cubic structure with equivalent a-, b-, and c-axes, the ordering of Sb atoms can be along the a- or b-directions of the matrix as well. The periodicity of superlattice in NP-II area is same to that of NP-I area, as marked in Fig. 3(a), except that the ordering of the superlattice in NP-II is along the b-direction.
(a) A high-resolution transmission electron microscope (HRTEM) image of the studied CeFe4Sb12 sample viewed along the [100] zone axis, showing two NPs coherently embedded in the matrix, designated as NP-I and NP-II. The fast Fourier transform (FFT) diffractograms of the circled matrix area M and NP area NP-I in (a) are shown in (b) and (c), respectively. In (c), the presence of superlattice reflections spots is evident. (d) Combined Gaussian and Lorentzian fitting (black solid line) to the 002 peak of the matrix (red open circles). (e) Line scan of intensity profiles from 00−2 peak to 002 peak of the diffractogram of NP-I in (c). (f) An HRTEM image with a NP embedded. FFT diffractogram of the circled NP region is shown in the inset. (g, h) Strain maps of εyy and εzz, which were calculated from the HRTEM image shown in (f). The white rectangle in (h) is the reference area. The maps are shown in color for clarity. The circles in the figures outline the NP.

Strain field distribution retrieved by the GPA software is a relative strain map with respect to the reference area. Figure 3(f) shows an HRTEM image of a NP in which the FFT diffractogram from the circled NP area is shown in the inset. Figures 3(g) and 3(h) show the relative strain maps, εyy and εzz, retrieved from the HRTEM image in Fig. 2(f) with g 1 = 020 and g 2 = 002, and y- and z-axes pointing to the [010] and [001] directions, respectively. The reference area is marked by a white rectangle in Fig. 3(h). The εyy map exhibits both positive and negative strains and the εzz map shows strong positive strains in the matrix. Although the NP has a symmetric (circular) shape, εyy and εzz strains around the NP are anisotropic. There are small regions near the NP showing positive values of εxx , and εzz is larger on the bottom side than the top side. The anisotropic distribution of the strain field around the NPs with symmetric shapes has also been observed in AgPbmSbTem+2 (LAST-18) single crystals.Reference Wu, Zheng, Zhou, Li, Yang and Zhu7 One possible explanation is that strain fields are not only caused by the misfit between NPs and the matrix but also by the local fluctuations in composition. The formation of Sb-rich NPs consumes Sb, which naturally induces local compositional fluctuation in the surrounding matrix. It is also possible that the formation of Sb-rich superlattices may be caused by the Ce-filling fraction fluctuation, since a very quick sintering has been used to inhibit grain growth. The alternate contrast inside the NP areas was formed by the modulated superlattice structures.
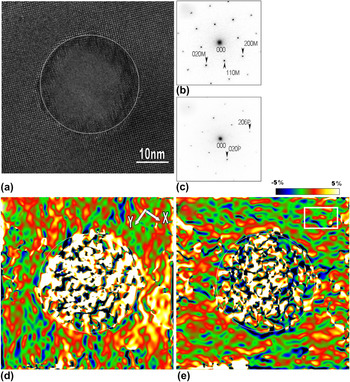
Figure 4(a) shows the HRTEM image viewed along the [001] matrix direction, showing another typical kind of NPs in the studied CeFe4Sb12 samples. It has a spherical shape and is about 30 nm in diameter. EDS analysis shows that the composition of the NP is close to CeSb2. The FFT diffractograms from the matrix and the circled NP areas are shown in Figs. 4(b) and 4(c), respectively. The NP was indexed to be a CeSb2 orthorhombic structure with lattice parameters of a = 0.6295(6) nm, b = 0.6124(6) nm, and c = 1.821(2) nm. The orientation relationship between the NP and the matrix was determined to be (010)CeSb2//(110)CeFe4Sb12 and (206)CeSb2//(1–10)CeFe4Sb12, respectively. A possible CeSb2 phase was not detected from the XRD pattern (Fig. 1) indicating that only trace amounts of it exist in the sample. In Fig. 4(a), lattice distortions and misfit dislocations were frequently observed surrounding the NP, which are possibly formed to compensate the lattice mismatch between the NP and the neighboring matrix.
(a) HRTEM image showing a CeSb2 NP embedded in the matrix of the nonequilibrium-synthesized CeFe4Sb12 sample. Corresponding FFT diffractograms from the matrix and the circled NP areas in (a) are shown in (b) and (c), respectively. Strain maps of (d) εxx and (e) εyy are calculated from the HRTEM image in (a). The white rectangle in (e) is the reference area. The circles in the figures outline the NPs.

Figures 4(d) and 4(e) show the relative strain maps εxx and εyy, retrieved from the HRTEM image in Fig. 4(a) with g 1 = 200, g 2 = 020, and x- and y-axes pointing to the [100] and [010] directions, respectively. The reference area is marked by a white rectangle in Fig. 4(e). The εxx map shows positive strain in both the matrix and the NP, which is smaller on the top left than on the bottom right. The εyy map shows positive strain in the NP and almost no strain in the matrix. The strain maps are also anisotropic, and εyy shows much less strain than εxx. The CeSb2 NPs have defects on the interfaces and produce less distinct strains on the matrix when compared to the Sb-rich NPs, which share coherent interfaces with the matrix. The possible reason may be that part of the strain caused by the CeSb2 NP has been released through the formation of dislocations and other defects on the interface.
IV. CONCLUSIONS
NPs in nonequilibrium-synthesized CeFe4Sb12 have been analyzed in detail using quantitative HRTEM. The Sb-rich NPs usually share coherent interfaces with the matrix. Large CeSb2 NPs were observed with lattice distortions and misfit dislocations on the interface with the matrix. The strain fields in the matrix around these spherical NPs have been shown to be anisotropic. Coherent interfaces between NPs and the matrix seem to induce more distinct strain fields than the interfaces with defects. The formation of defects on the interface may have released part of the strains. The high density of additional interfaces and strain fields produced by nanometer-sized grains, NPs, and defects are believed to enhance phonon scattering and result in a significant reduction in κ L. Currently, ab initio density functional theory and lattice dynamical models are being aimed at modeling the strain formation around the NPs that were observed in the HRTEM imaging of our sample and future inelastic neutron scattering measurements are planned to observe potential effects of nanostructuring on the phonon density of states in a number of filled skutterudites.
ACKNOWLEDGMENTS
We thank Dr. Jihui Yang of Materials and Processes Laboratory, General Motors R&D Center for generous help with sample preparation. We thank the Center for Functional Nanomaterials, Brookhaven National Laboratory for generous support in using its facilities. The work at Brookhaven National Laboratory was primarily supported by the U.S. Department of Energy, Office of Basic Energy Science, Materials Science and Engineering Division, under Contract No. DE-AC02-98CH10886. This research was also partly supported by the Cooperative Research and Development Agreements (CRADA) between Brookhaven National Laboratory (Q. Li) and General Motors Corporation (J.H. Yang).