1 Introduction
For life insurance companies, modelling lapse behaviour of policyholders is of critical business importance, particularly under increasing international industry regulations such as Solvency II (Cerchiara et al., Reference Cerchiara, Gambini and Edwards2009), because life policy lapse affects an insurer’s profitability and liquidity. The risks associated with high levels of policy lapse can be significant in terms of future profit or loss from lapsed policies, effects on premium flows for covering potential claims and adverse selection among others. High rates of lapse also negatively impact an organisation’s reputation. In fact, according to European Insurance and Occupational Pensions Authority’s Quantitative Impact Study (QIS5), the lapse risk accounts for about 50% of the life underwriting risks (Loisel et al., Reference Loisel, Piette and Tsai2019). By identifying and assessing lapse risks in advance, companies can not only improve their economic returns by detecting potential policyholders with a high propensity of lapsing but also can adjust their marketing actions to prevent such incidents, improve customer retention and re-evaluate customer acquisition channels.
Most studies in the literature have investigated factors driving life insurance lapse and surrender behaviour by policyholders during the life cycle of an individual policy; see Eling & Kiesenbauer (Reference Eling and Kiesenbauer2014) for a brief review. Overall, these factors can be divided into two categories. Some are related to the general economic environment, such as unemployment rates, interest rates and economic growth rates (Kim Reference Kim2005; Kim Reference Kim2006; Cox & Lin Reference Cox and Lin2006; Kiesenbauer Reference Kiesenbauer2012), while others are concerned with product and policyholder features such as gender, age, policy duration and insured amount, as per Eling & Kiesenbauer (Reference Eling and Kiesenbauer2014), Milhaud et al., (Reference Milhaud, Loisel and Maume-Deschamps2011), Cerchiara et al., (Reference Cerchiara, Gambini and Edwards2009). It is noted that the former category mostly involves publicly available data sets and therefore substantial research has been published in this area. Conversely, the empirical literature analysing lapses with respect to policy and policyholder characteristics is rather limited, in part due to the fact that insurer data sets involving such information are highly confidential, and also due to the limited amount of information insurers hold (and are allowed to hold by law) about policyholders. Some existing studies in the literature such as Eling & Kiesenbauer (Reference Eling and Kiesenbauer2014) and Kim (Reference Kim2005) have suggested that lapse behaviour can depend on additional factors beyond general economic factors – for example, additional socio-economic information such as policyholder income and home ownership (i.e. affluence) can help identify different customer groups and predict future customer behaviour. However, due to regulations and data protection, insurers are typically only allowed to collect limited customers socio-economic information relevant for risk assessment at policy inception.
Fortunately, a wealth of demographic information is available at local population level via censuses carried out by countries. In Ireland, a census is conducted at 5-year periods by the government, with the most recent census prior to this work occurring in 2016. Because the census information is at local population level at a relatively fine spatial granularity (under the unit of “small area”), integrating the census data into modelling shifts our research focus to spatial modelling of the policyholders. Therefore, the interest in this paper lies in investigating whether customer lapse behaviour in a life insurance portfolio is linked to demographic and socio-economic information such as relative affluence of the area within which a policyholder lives – i.e. whether geo-economic shifts are reflected in the behaviour of customers. We illustrate strong evidence that customer behaviour is potentially strongly correlated with customer location, implying that there is potential to improve risk models via developing spatial understanding and characterising the lapse behaviour of the policyholders spatially.
Spatial data like a census typically involve a large number of observations, meaning analysis of this nature tends to involve complex multivariate analysis and machine learning methods. For Dublin for example, there are 4,806 small areas. Furthermore, spatial features cannot be illustrated or modelled in a simple way due to their complex characteristics, e.g., size, boundaries, direction and connectivity. Hence, spatial analysis is more sophisticated than relational data processing in terms of algorithmic efficiency and the complexity of possible patterns because interrelated information at a spatial scale has to be considered. Therefore, spatial or geodemographic clustering is used for grouping and labelling geographical neighbourhoods (i.e. small areas), in terms of their social and economic characteristics, to better understand our spatially dependent data and the potential underlying associations between these data and customers’ data. Such applications allow similarities between customer structures in different small areas to be highlighted, geodemographically speaking. Therefore, this paper investigates how spatial information, via census data, can be integrated to augment internal company data for lapse prediction models. In the literature, much work has provided evidence in favour of geodemographic clustering targeting a significant degree of spatial heterogeneity in the distribution of economic activities, such as Dong et al., (Reference Dong, Chawla, Tang, Yang and Yang2017), Lamnisos et al., (Reference Lamnisos, Middleton, Kyprianou and Talias2019) and Calka (Reference Calka2019). In particular, Brunsdon et al., (Reference Brunsdon, Charlton and Rigby2018) demonstrate the application of geodemographic clustering for the Republic of Ireland using clustering techniques on the census data. There are also commercial geodemographic segmentation products available in different countries. In Ireland, Data Ireland’s OGHAM and Experian Ireland’s MOSAIC both allocate Irish households into different segments based on lifestages and affluence.
Therefore, in this paper, policyholders’ lapse behaviour in life insurance is modelled by taking spatial characteristics derived from Irish census data into consideration, i.e. the company’s internal data are augmented with extra external data about policyholders. We intend to gain insights on how customer heterogeneity can be tackled in a spatial and geodemographic way. Our approach is based on clustering spatial units into a number of different meaningful groups, based on the characteristics of the people living there in the census. To address these challenges, we propose a multi-phase model including k-medoids clustering algorithm and a logistic regression to predict lapse rates. The remainder of this paper is organised as follows: the data sets used are introduced in section 2; the proposed methodology with its associated results and discussion is presented in section 3; the paper concludes in section 4.
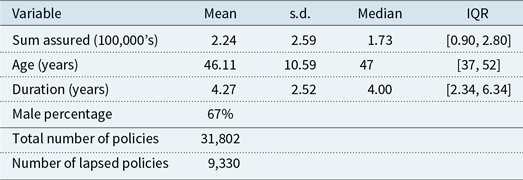
Summary information on the company provided predictor variables within the company internal data

2 Available Data
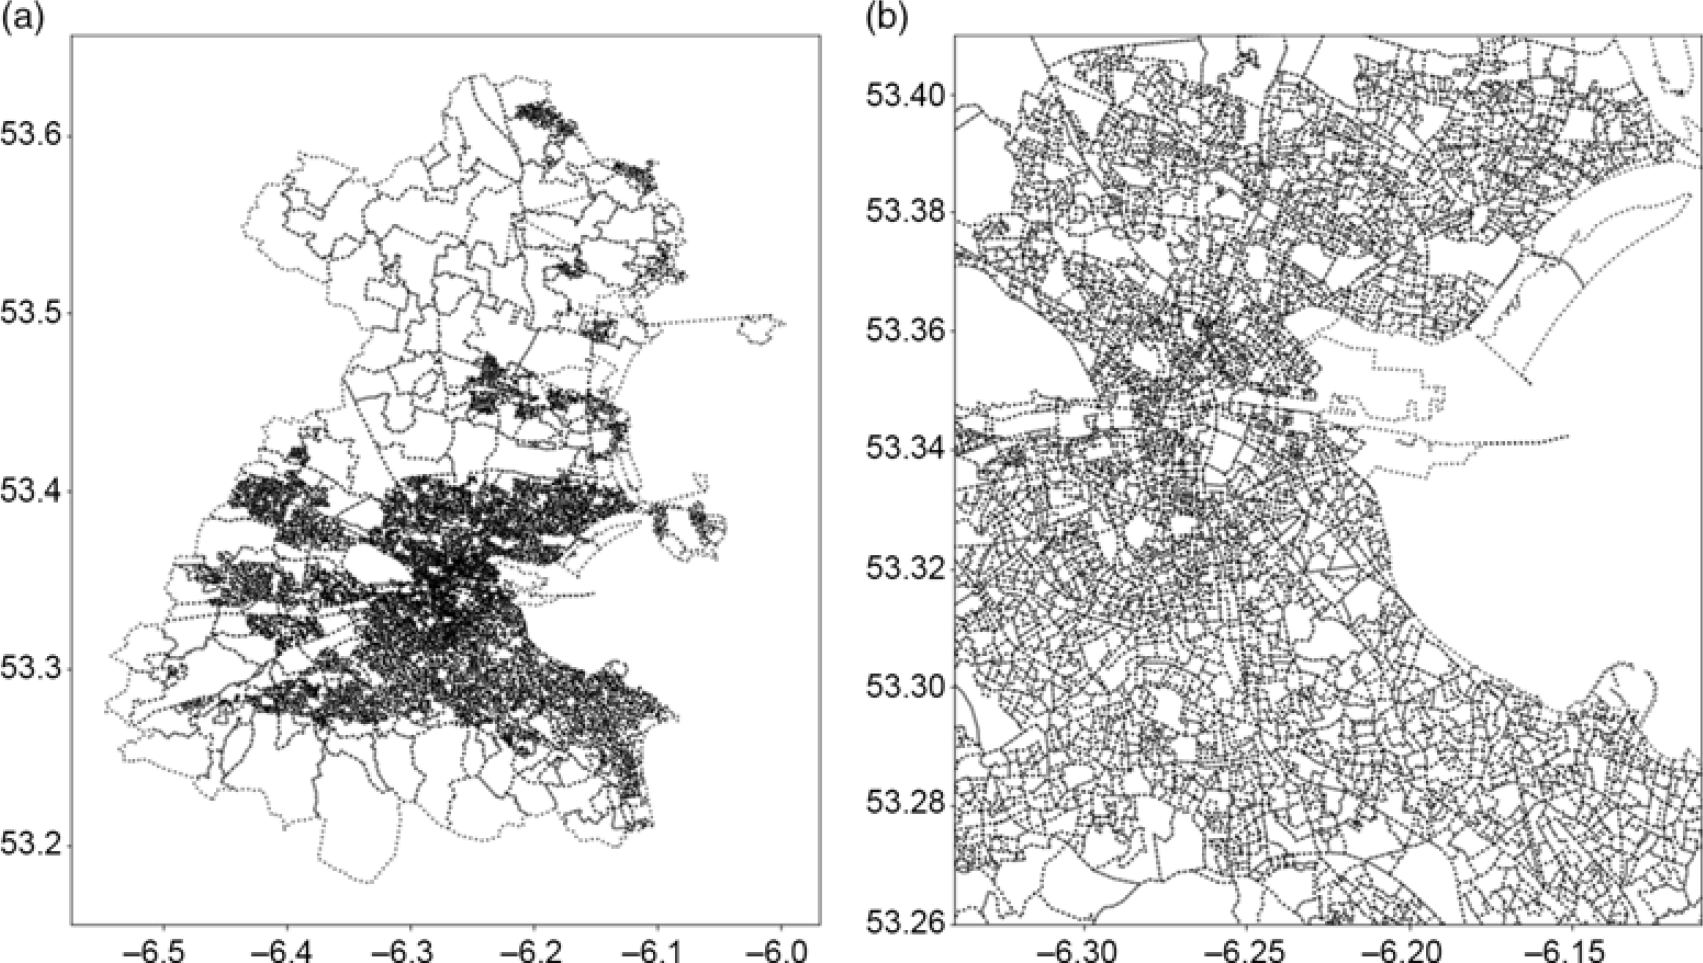
The first data set used is obtained from a global insurance company with offices in Ireland. For simplicity, analysis focuses on the Dublin county region. The industry data set consists of anonymised customer data relating to life insurance policies, including various characteristics of the policies and policyholders, and the specific Irish census small area information for where the policyholders live. The data set contains 31,802 observations (policies in Dublin) including variables such as sum-assured (in 100,000’s), age, gender (baseline male), policy duration (years) and two category classes – lapsed or unlapsed (where unlapsed includes in-force, matured or registered death). Approximately 29% of the 31,802 policies are recorded as having lapsed. A summary of the data set is presented in Table 1. These variables have been selected because they have been shown to be relevant in predicting life insurance lapse behaviour in the literature, such as Fier & Liebenberg (Reference Fier and Liebenberg2013), Eling & Kiesenbauer (Reference Eling and Kiesenbauer2014), and are commonly used predictors in this field without being overly commercially sensitive. In order to map to the spatial characteristics of the census information, we restrict our spatial information on customer location in Dublin to a small area level in order to anonymise individual policyholder data, aggregating it at a local area as opposed to a dwelling level via latitude and longitude. The small areas of populations generally comprise between 80 and 120 dwellings and are created by The National Institute of Regional and Spatial Analysis on behalf of Ordnance Survey Ireland, in consultation with the Irish Central Statistics Office (CSO). Figure 1 demonstrates the small area shapefile for the Dublin region.
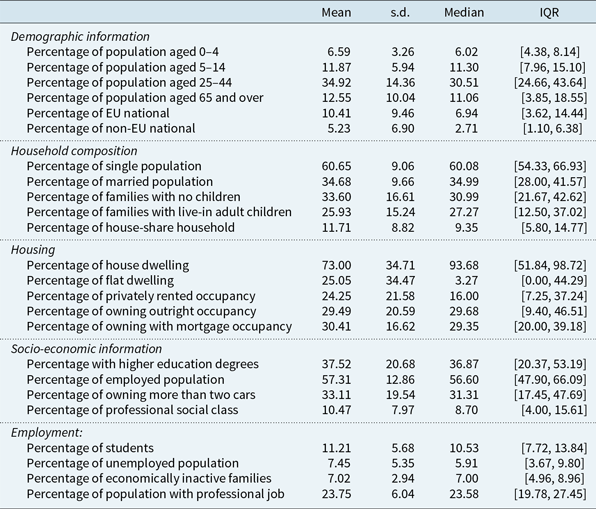
The second data set integrated into the model is the 2016 census in Ireland, which is disseminated by the CSO. This data set provides a vast amount of information at the small area level. There are 4,806 small areas in Dublin alone, and the census consists of 764 variables (relating to, e.g. age, household size, marriage status, and education levels etc.) for each of the areas. There are no missing values or outliers in the census data. Data normalisation is a data processing approach where the variables of the data are scaled or transformed so that they each make an approximately equal contribution to the results (Singh & Singh Reference Singh and Singh2019). The census data set has been filtered and normalised. For example, there are about 100 variables relating to age information in the raw census data that they are summarised into percentages of different age bands; and there are about 40 variables relating to education levels that are converted to percentages of people holding a third-level higher education degree and above for each area. In total, there are 69 variables that are synthesised from the census data and a summary of a subsets of these variables is presented in Table 2. In the interest of brevity, not all summarised census variables are presented and discussed in detail; full listings of the variables and the corresponding Python code used to produce them (in the case of derived variables) can be found on the author’s GitHub page (https://github.com/senhu/).
Shapes of small areas for Dublin, including its four local authorities (Dublin City, South Dublin, Fingal, Dún Laoghaire-Rathdown), which encompasses the geographic area of the Dublin region: (a) shows all small areas in Dublin, highlighting that the small areas are denser in city centre area and (b) shows the zoomed-in view of small areas in the city centre for clearer visualisation. The axes show the geographic coordinate of the Dublin region.

Summary information on a subset of summarised variables from the 2016 Irish census data across all small areas in Dublin

3 Modelling Approach
In the literature, various modelling approaches have been investigated for understanding and modelling the factors driving policy lapsing, such as multiple regression models (Awang et al., Reference Awang, Rahman, Ismail, Kim, Ma, Fang, Zhang and Cuzzocrea2012), generalised additive models (Coussement et al., Reference Coussement, Benoit, Van den Poel and Dato-on2015), neural network models (Tiwari et al., Reference Tiwari, Hadden, Turner, Taniar, Gervasi, Murgante, Pardede and Apduhan2010) and cluster analysis and classification and regression tree (Li & Deng Reference Li, Deng, Lei, Wang, Deng and Miao2012). In order to focus this article on the benefits of augmentation of internal company data with external data sets, we have deliberately adopted a lapse rate prediction model based on a logistic regression approach as the one in Ghahramani et al., (Reference Ghahramani, Zhou and Hon2019), as opposed to adopting more sophisticated and/or complicated machine learning approaches that are not standard in industry.
Given the company internal data set of n observations consisting of policies and policyholders features, the variable of interest can be considered as binary, representing lapsed and unlapsed policies. That is, the dependent variable
 $Y_i$
is assumed to follow a Bernoulli distribution with success probability
 $\pi_i$
,
 $Y_i \sim Bern(\pi_i)$
, and values of 1 and 0 are assigned to
 $Y_i$
with probabilities of
 $\pi_i$
and
 $1 - \pi_i$
, respectively:
 $Pr(Y_i = 1) = \pi_i, Pr(Y_i = 0) = 1-\pi_i$
, where
 \begin{equation}y_i =\begin{cases}1 & \mathrm{if}\ i^{\text{th}} \text{ } \mathrm{policy}\text{ } \mathrm{is}\text{ } \mathrm{lapsed} \\[5pt]
0 & \text{if}\ i^{\text{th}} \text{ } \mathrm{policy}\text{ } \mathrm{is}\text{ } \mathrm{not} \text{ } \mathrm{lapsed}\end{cases}\end{equation}
and
 \begin{equation}Pr \left\{Y_i = y_i \right\} = (\pi_i)^{y_i}(1-\pi_i)^{1-y_i}\end{equation}
For logistic regression models, the model set-up is
 \begin{equation}{\rm{logit}}(\pi_i) = \log \left(\frac{\pi_i}{1-{\pi_i}}\right) = \textbf{X}^\top \boldsymbol{\beta}\end{equation}
where
 $\textbf{X}^\top$
is the model design matrix corresponding to the company’s data and
 $\boldsymbol{\beta}$
represents the vector of regression coefficients. Maximum likelihood estimation is used to estimate the regression coefficients
 $\boldsymbol{\beta}$
. Based on the estimated coefficients, the model predicts the probability of policy lapse – if the probability is
 $>0.5$
, the policy is classified as lapsed.
Spatial geodemographic clustering identifies patterns through analysing and grouping different areas based on the socio-economic characteristics of their small geographical regions. Therefore, similar spatial objects are identified given their features and can provide a discrete geographic segmentation. The Irish census data set is used to reveal such insights, given that it includes geospatial features of geographic units, small areas in this case. In this paper, a machine learning-based clustering strategy, k-medoids clustering (Kaufmann & Rousseeuw Reference Kaufmann and Rousseeuw1987; Kaufman & Rousseeuw Reference Kaufman and Rousseeuw1990), is adopted in order to cluster the small areas into distinct clustering components. The k-medoids algorithm (sometimes called partitioning around medoids) detects clusters by identifying a set of medoids (typical data points in each cluster) and assigning the remaining observations to clusters on the basis of the closest medoid. In this case, the distance is defined by taking the explanatory variables for small areas that are extracted from the census as coordinates in Euclidean space and computing distances on that basis. For the Irish census data investigated, there are 4,870 small areas in Dublin that are used for the analysis. When implementing the algorithm, each observation is a small area consisting of census information; it can be regarded as a vector of length m, where m is the number of census variables. Let matrix
 $\textbf{C} \in \textbf{R}^{n \times m}$
represents the census data for all small areas in Dublin:
 \begin{equation}\textbf{C} = \begin{bmatrix}\textbf{C}_{1} \\[2pt] \textbf{C}_{2} \\[2pt] \vdots \\[2pt] \textbf{C}_{n}\end{bmatrix}=\begin{bmatrix}c_{11} &\quad c_{12} & \quad \cdots & \quad c_{1m} \\[2pt]
c_{21} & \quad c_{22} & \quad \cdots & \quad c_{2m} \\[2pt]
\vdots & \quad \vdots & \quad \ddots & \quad \vdots \\[2pt]
c_{n1} & \quad c_{n2} & \quad \cdots & \quad c_{nm}\end{bmatrix}\end{equation}
where
 $\textbf{C}_i$
is the census information (vector of length m) of the
 $i^{\text{th}}$
small area in the census data and n is the number of small areas. The k-medoids clustering is then applied to the data in this format. Initially, K observations in the data are randomly selected as the medoids, and the small areas are allocated to the closest medoids. The algorithm aims to minimise the distance between the medoids of each cluster and the associated small areas by iteratively re-calculating and changing medoids, and assigning small areas to the closest new medoids, until the lowest distance measure is achieved. A feature of this clustering approach is that it attempts to minimise sums of absolute distances rather than squared distances, and as a consequence, it is robust to outliers and less inclined to produce groupings with very small numbers of observations. Another feature of the algorithm is that it converges quickly, which is beneficial when dealing with a large number of spatial features. However, the number of clusters needs to be predetermined, and the choice of K directly affects the convergence and the result. Throughout this paper, the elbow method (via an elbow plot) is used to determine the optimum value of K. The elbow method looks at the total within-cluster sum of distance as a function of the number of clusters: the number of clusters K should be chosen such that adding another cluster does not substantially improve the total within-cluster sum of distance.
We show that considering the additional freely available census data can improve predictions of lapse rates of customers compared to utilising internal company data sets in isolation. In this paper, a range of scenarios is considered: (1) baseline model without additional census data; (2) census data clustering and (3) additional company data clustering.
3.1 Model 1: company only data for lapse prediction
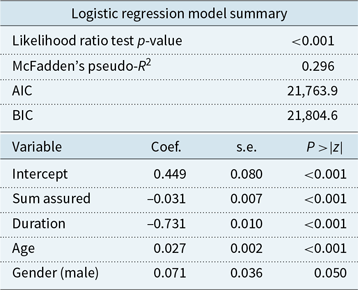
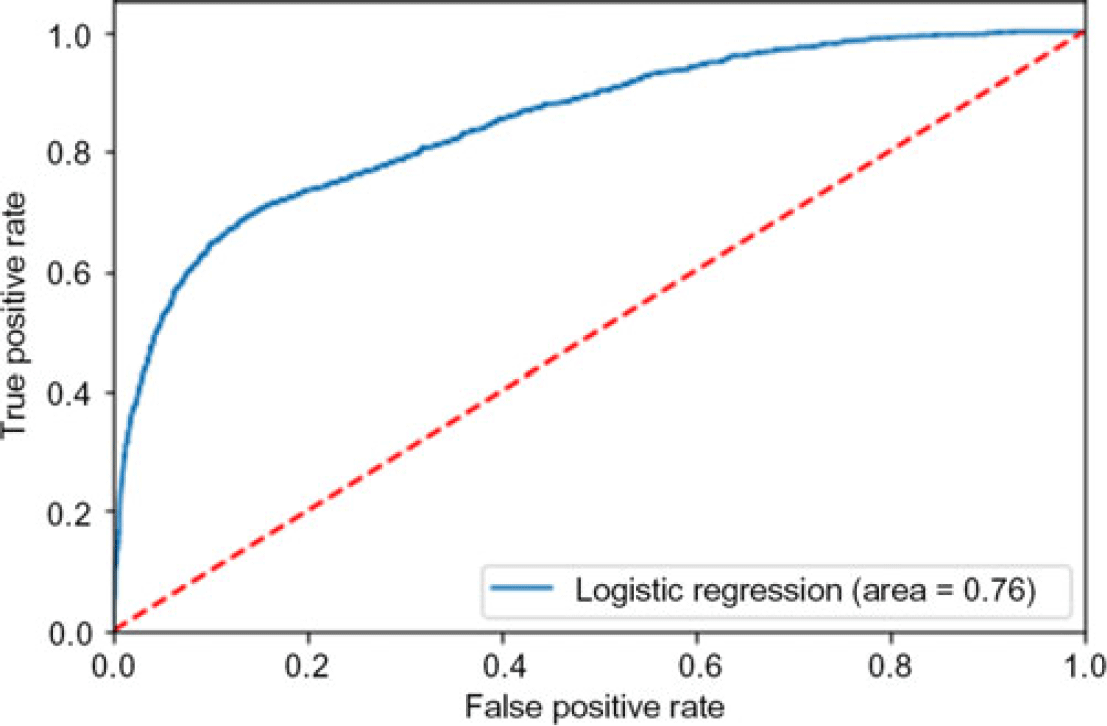
The logistic regression model fitted consists of a binary-dependent variable Y taking two values (lapsed and not lapsed). It is regressed on four independent features that are included in the internal company data: age, gender, sum assured and duration. The regression model (Model 1) is trained, and the performance is tested out of sample. The model results are given in Table 3. There are many distinct criteria for comparing the performance of classification models, amongst the most popular are prediction accuracy (i.e. one minus misclassification rate) and the area under the Receiver Operating Characteristic (ROC) curve (Hanley & McNeil Reference Hanley and McNeil1982; Bradley Reference Bradley1997; Hand & Till Reference Hand and Till2001). The ROC curve is illustrated in Figure 2. The predictive accuracy of the model, assessed using area under the curve (AUC), is 76%, and the accuracy using a prediction confusion matrix (1 – misclassification rate) is 82%. The directions of the parameter estimates presented in Table 3 are as expected: increasing sum-assured and policy duration are linked to lower propensity of policies lapsing. Increasing age and the gender of the policyholder being male are more likely to result in lapsed policies. All variables are significant at the 5% level, and it is worth noting that gender is borderline significant.
Model summary of Model 1 logistic regression

Model 1 ROC curve for predicting lapse probabilities using company data only. The area under the curve (AUC) is measured as 76%.

This isolated regression model approach to modelling lapse rates is reflective of the internal company practices of most insurers. The prediction accuracy is approximately in line with the performance of historical internal models for the Irish insurer’s data based on the presented variables. Therefore, this approach represents a baseline for comparison with the more sophisticated approaches explored in the ensuing sections.
3.2 Model 2: incorporating geodemographic census information
The first proposal to improve the standard lapse prediction model is clustering the census data. This proposal has two phases: (1) a geodemographic clustering phase based on the spatially associated census data set and (2) fitting a separate logistic regression classification model within each of the clusters identified in the first step. The principal idea is that instead of attempting to fit a lapse model to the heterogeneous company data set, lapse prediction may potentially be improved by fitting separate prediction models to more homogeneous within-cluster groups of customers, depending on the characteristics of the clusters.
3.2.1 Model 2 phase 1: clustering census data into homogeneous clusters
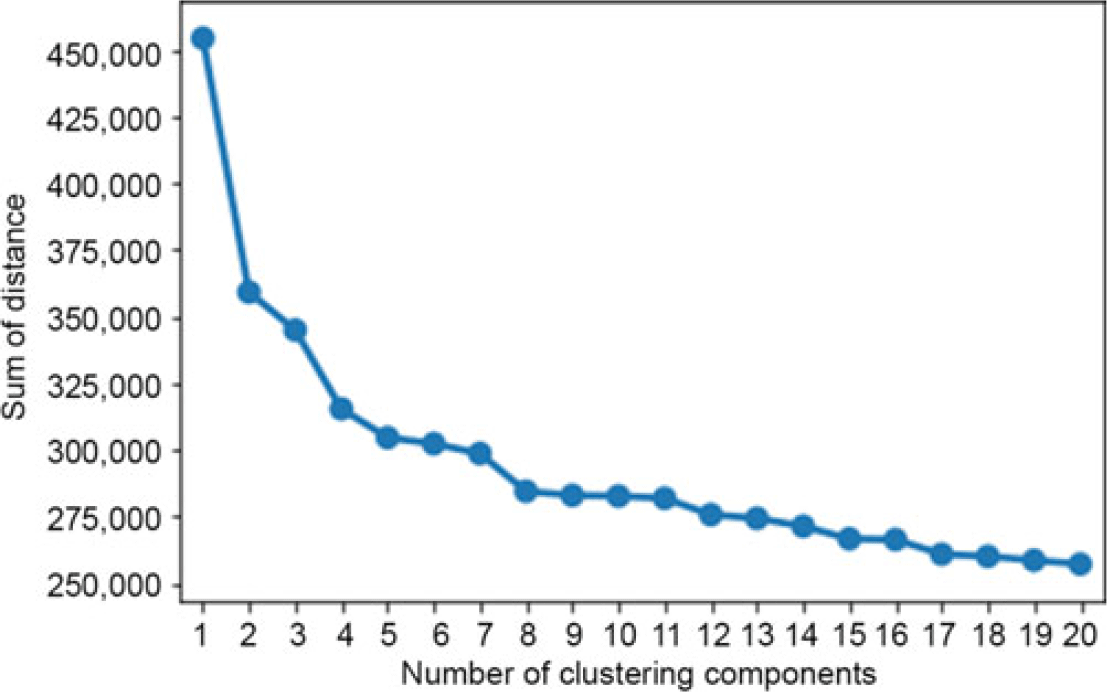
Each small area of the census data set has various features including age distribution, marital status, education level and housing status, as discussed in section 2 and Table 2. The k-medoids algorithm is used to identify clusters within these census data. To determine the optimum number of clustering components, an elbow plot is employed. First, the algorithm is run repeatedly by varying K from 1 to 20 clusters. For each value of K, the total within-cluster sum of distance is recorded. Then, the sums of distances are plotted against the number of clusters K, as in Figure 3. The location of a bend (i.e. elbow) in the plot is considered as an appropriate choice of K. Based on Figure 3,
 $K=8$
is identified as optimal, primarily because it is an obvious elbow point; the decision is also motivated by the fact that
 $K=8$
leads to the smallest cluster still having sufficient observations for robust statistical inference (here the smallest cluster has 341 small areas and 1,619 life insurance policies). Once the clusters have been identified, each cluster needs to be interpreted and profiled and cluster membership information can be aggregated into the company data set for further lapse modelling.
Elbow plot of sum of distance versus number of clustering components for the census data. The optimum value (i.e. the elbow point) is chosen as
 $K=8$
.

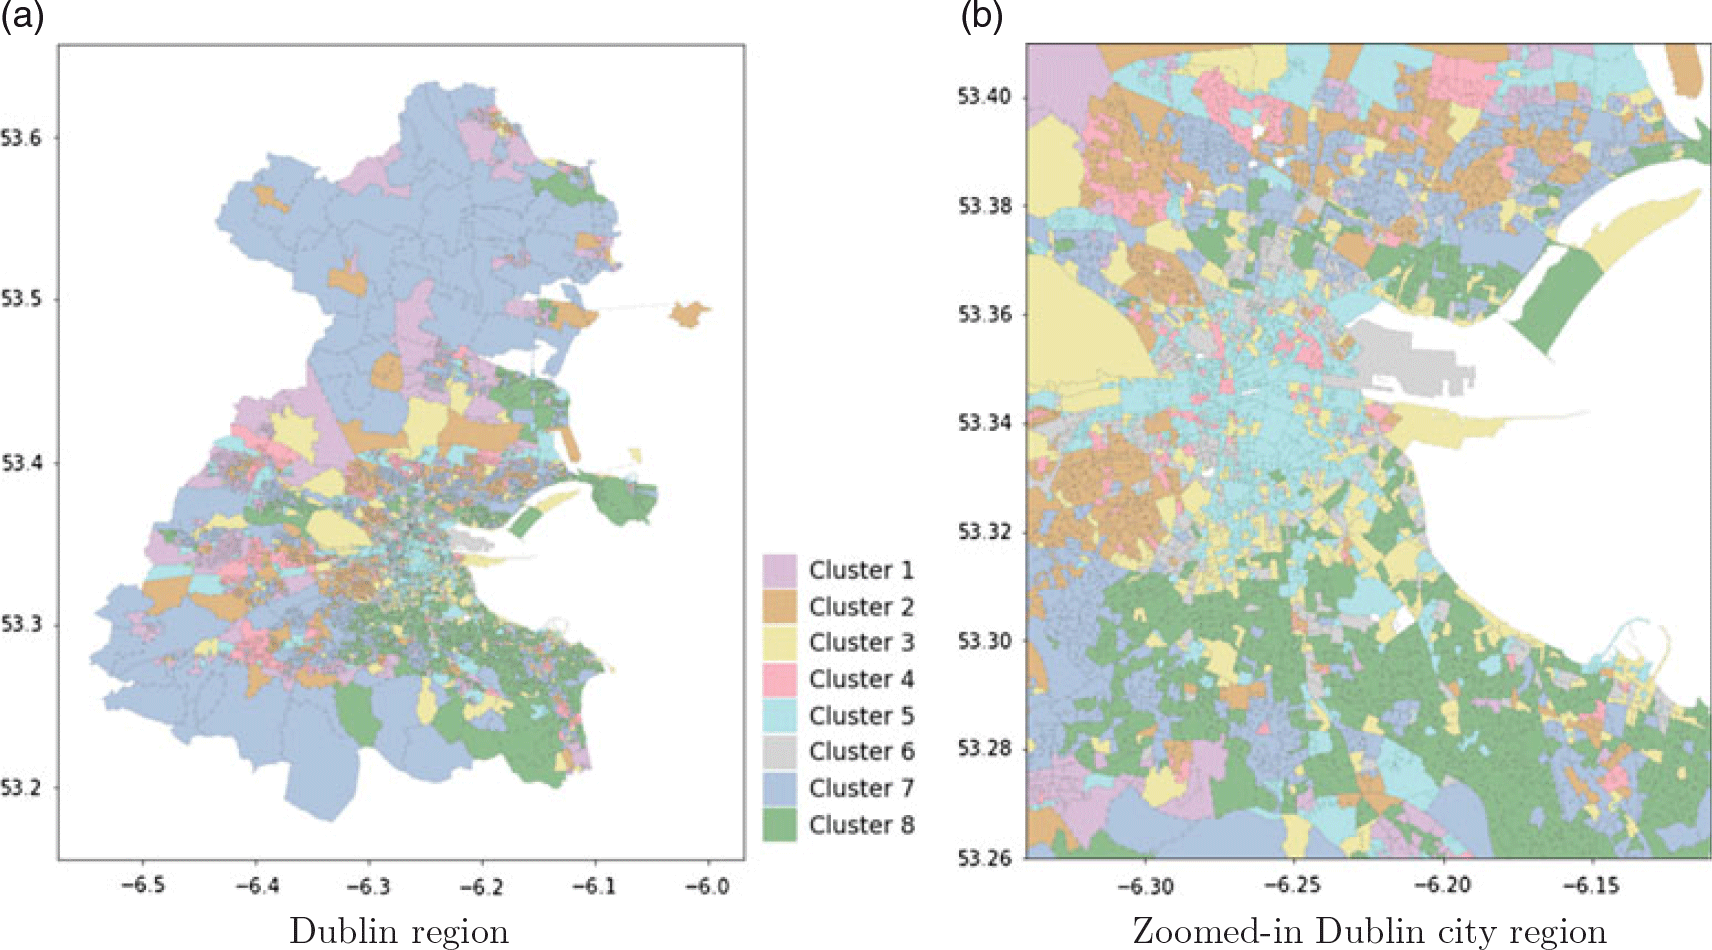
As a first step to interpret the identified clusters, all the small areas in each cluster are plotted on a Dublin region map via different colours, as in Figure 4. Figure 4(a) illustrates all the small areas in different clusters over the Dublin region. Due to the fact that the small areas outside the city centre are much larger and more sparsely populated, Figure 4(b) shows the zoomed-in view of clusters in the city centre on the map for clearer visualisation. These two figures show that, Cluster 1 mainly includes commuter town areas in the outer ring of Dublin city; Cluster 3 includes public parks, business parks and airport areas; small areas in Cluster 4 scatter around poorer areas in Dublin; Cluster 5 is mainly Dublin city centre; Cluster 7 is predominantly the suburbs and countryside of Dublin; Cluster 8 covers the most affluent areas in Dublin including Dún Laoghaire-Rathdown, Howth, Malahide and Castleknock. Appendix A provides more detailed illustrations of these clusters on a Dublin map.
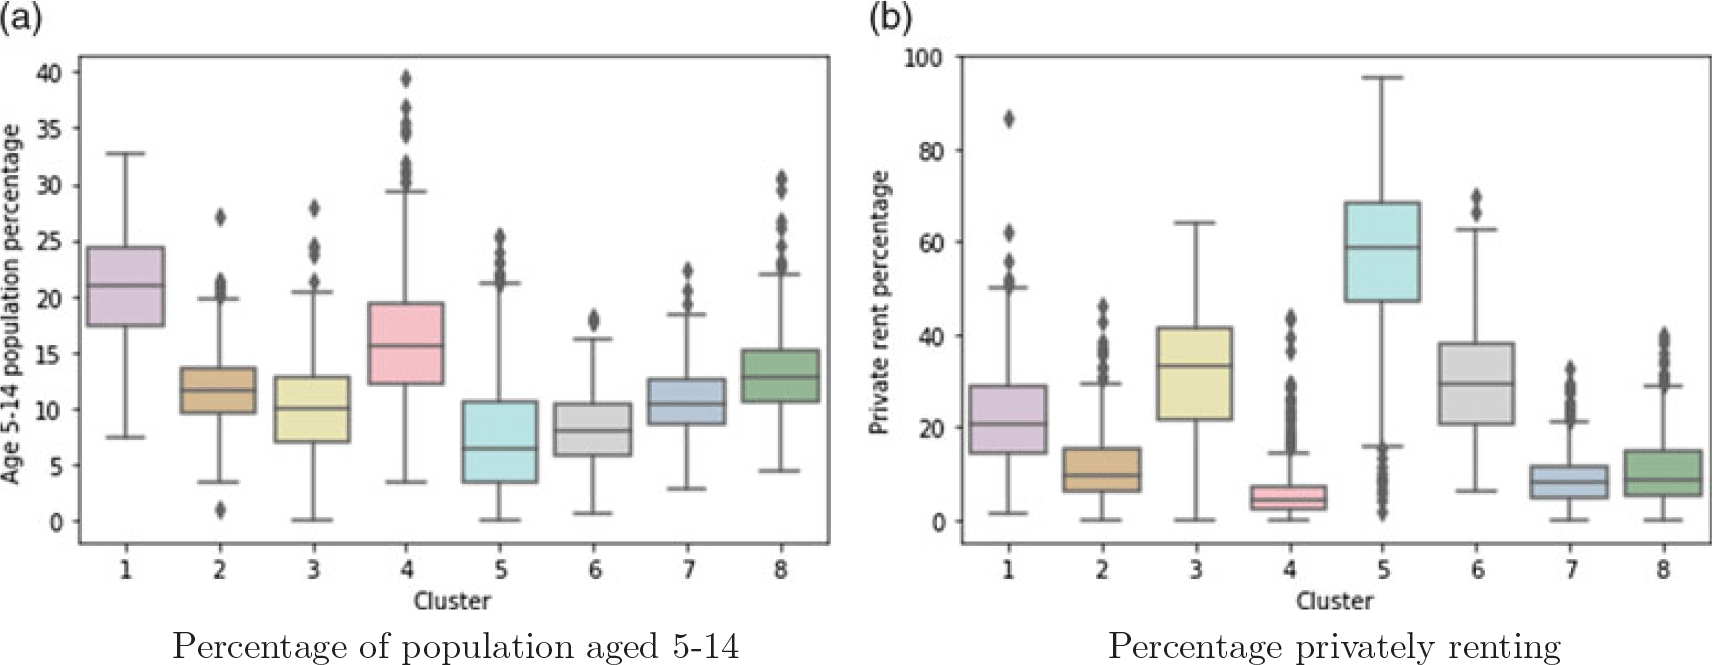
The clusters are also compared using the census information via boxplots. Figure 5 shows the boxplot of percentage of young children aged between 5 and 14 years for all the small areas in each cluster, and the boxplot of percentage of privately rented dwellings of the small areas in each cluster. Figure 5(a) suggests that Clusters 1 and 4 have higher children percentages than other clusters, while Cluster 5 has the smallest percentage of young children, which is an indicator of household/family composition. Figure 5(b) suggests that Cluster 5 has the highest private rental dwelling percentage, followed by Clusters 3 and 6. This is an indicator of household/area affluence. There are 69 variables summarised from the census data, even though some of them are not useful in separating the clusters, most of them showed important features distinguishing the areas within these clusters. Boxplots of some of the most influent variables are presented in Appendix B, giving further information on how the characteristics of each cluster are extracted.
Clustering result of Method 2 for small areas based on the census data, in which 8 clusters are detected: (a) shows the clusters over the Dublin region; due to the fact that the small areas are dense in the city centre area and (b) shows the zoomed-in view of clusters in the city centre area for clearer visualisation. The axes give the geographic coordinates of the map.

Boxplots of census variables on percentage of population aged 5–14 years and percentage privately renting across the 8 identified clusters for all Small Areas. These plots are used to profile the key characteristics of each cluster.

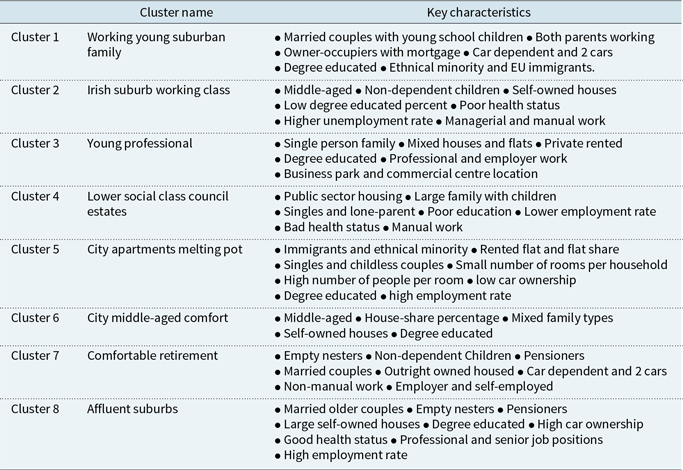
Cluster profiles based on k-medoids clustering method in Model 2

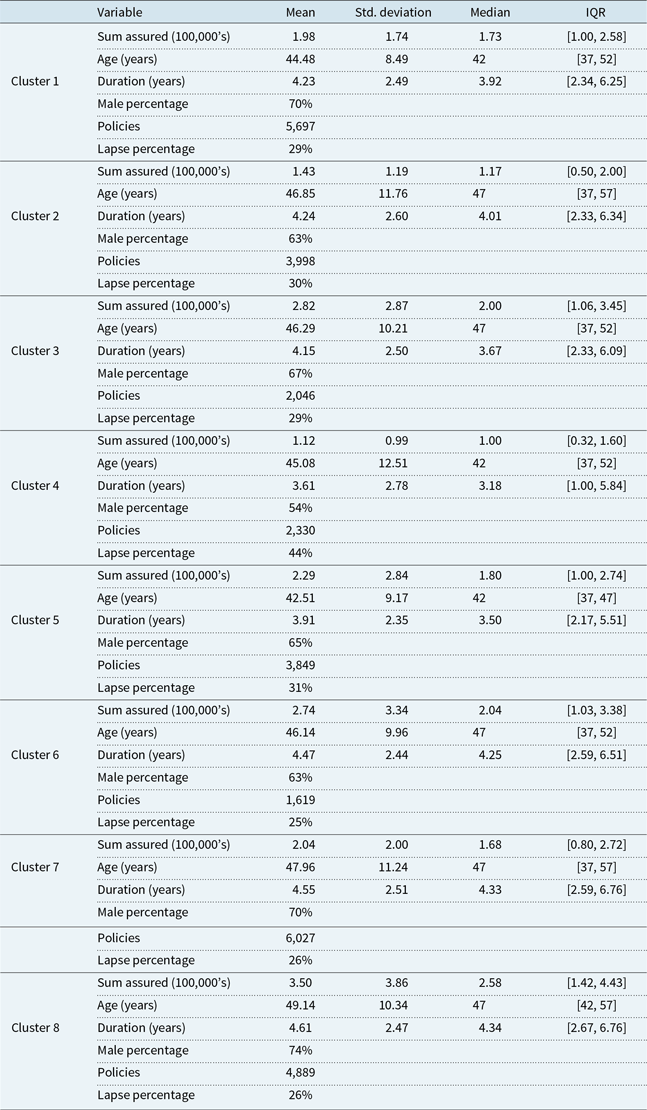
Summary information of the company variables of the policies within each of the identified census clustering components

Based on the visualisations in Figure 4, Figure 5 and in Appendix B, we can identify different key characteristics of each cluster and how they differ from other clusters. The detailed features are presented in Table 4. A coarse interpretation of the identified census clusters is that Cluster 8 captures the most affluent areas in Dublin (e.g. Dún Laoghaire-Rathdown, Howth, Malahide, Clontarf, Castlekcock); Cluster 7 is also affluent, consisting of mostly outer ring countryside areas of Dublin; Clusters 3 and 6 are relatively affluent, capturing mostly business and commercial centres where young and middle-aged professionals live, such as the airport area, Citywest, Dublin industrial estate and various business parks and campuses; Cluster 5 is mixed on the aspect of affluence, consisting of mostly city centre locations, university campuses and newly developed flat blocks in surrounding areas such as Sandyford; Cluster 1 is not very affluent, covering commuter and newly developed towns outside the city, such as Swords and Lucan. Cluster 4 is the least affluent, mapping to council estate public housing areas that scatter around the city, followed by Cluster 2, which maps to old Irish middle class areas such as Cabra, Finglas and Drimnagh.
In addition to the visualisations via maps and boxplots, Table 5 provides a summary of each of the company recorded variables for each of the census clusters, to aid in understanding the impact of the census clustering on the company data. From this perspective, the demographic policyholder information across each of the clusters appears to be more homogeneous and the differences across different clusters are more apparent, corresponding to the key characteristics of the clusters identified to date. For example, Cluster 8 has one of the lowest lapses rates of 26% (below the portfolio average), has the oldest average age, its average policy sum-assured value is the highest, and the average policy duration is the longest, which all indicate that Cluster 8 is indeed the most affluent. Cluster 6 has the smallest number of policies (1,619) and the lowest lapse rate of 25%. The policies in these areas are among the longest durations. Therefore, it also corresponds to the previous conclusion that it is a relatively affluent cluster. On the other hand, Cluster 4 has the highest lapse rate of 44%, based on 2,330 policies in total. It also contains the lowest proportion of male policyholders. The policies in this cluster appear to have the smallest sum-assured amounts, in addition to exhibiting much shorter policy duration. Similar findings can be made regarding other less affluent areas such as those in Clusters 1, 2 and 5.
3.2.2 Phase 2: prediction within census clusters
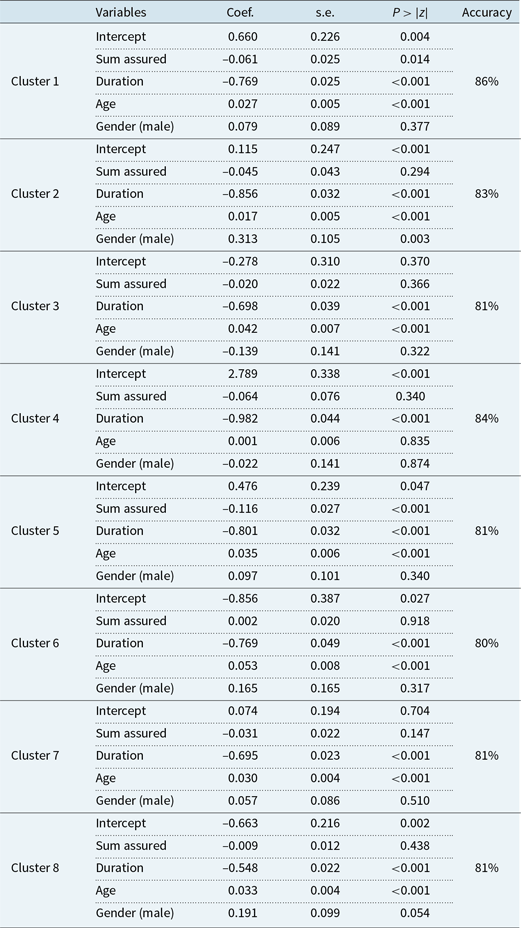
Following the detection of the 8 census clusters in the first phase, separate logistic regression classification models can be fitted within each cluster based on the company internal portfolio data (as shown in Table 5) to predict future lapse. The parameter estimates are presented in Table 6 for all 8 models. For each of the classification models, increased duration in terms of policy length is associated with lowered lapse propensity overall. This is understandable as customers are typically reluctant to give up a life insurance policy having invested over long periods previously and are slow to move life insurance between providers due to the inertia noted in many commercial settings. For all models except that for Cluster 6, the total assured sum of a policy also has a negative impact on the likelihood of lapse, with increased assured sums leading to lowered lapse propensity. This finding also makes sense – policyholders are reluctant to give up an expensive sum-assured policy because such a policy would typically have higher premiums previously invested. For Cluster 6, the coefficient of sum assured is close to zero. Interestingly, for most clusters, the sum-assured variable is not significant, despite the fact that historically it has been shown to be important for lapse prediction (Adams et al., Reference Adams, Andersson, Lindmark, Eriksson and Veprauskaite2020; Eling & Kochanski Reference Eling and Kochanski2013; Milhaud et al., Reference Milhaud, Loisel and Maume-Deschamps2011). The effect of age is positive for all clusters, with increasing age of policyholder linked to a higher likelihood of policy lapse, and in most cases is shown to be a significant factor (except for Cluster 4). Overall, gender is not identified as an important factor, except for Cluster 2 where males are identified as more likely to lapse than females.
Logistic regression model results for predicting a binary class (lapsed or in-force) among policies extracted from 5 clusters based on census data

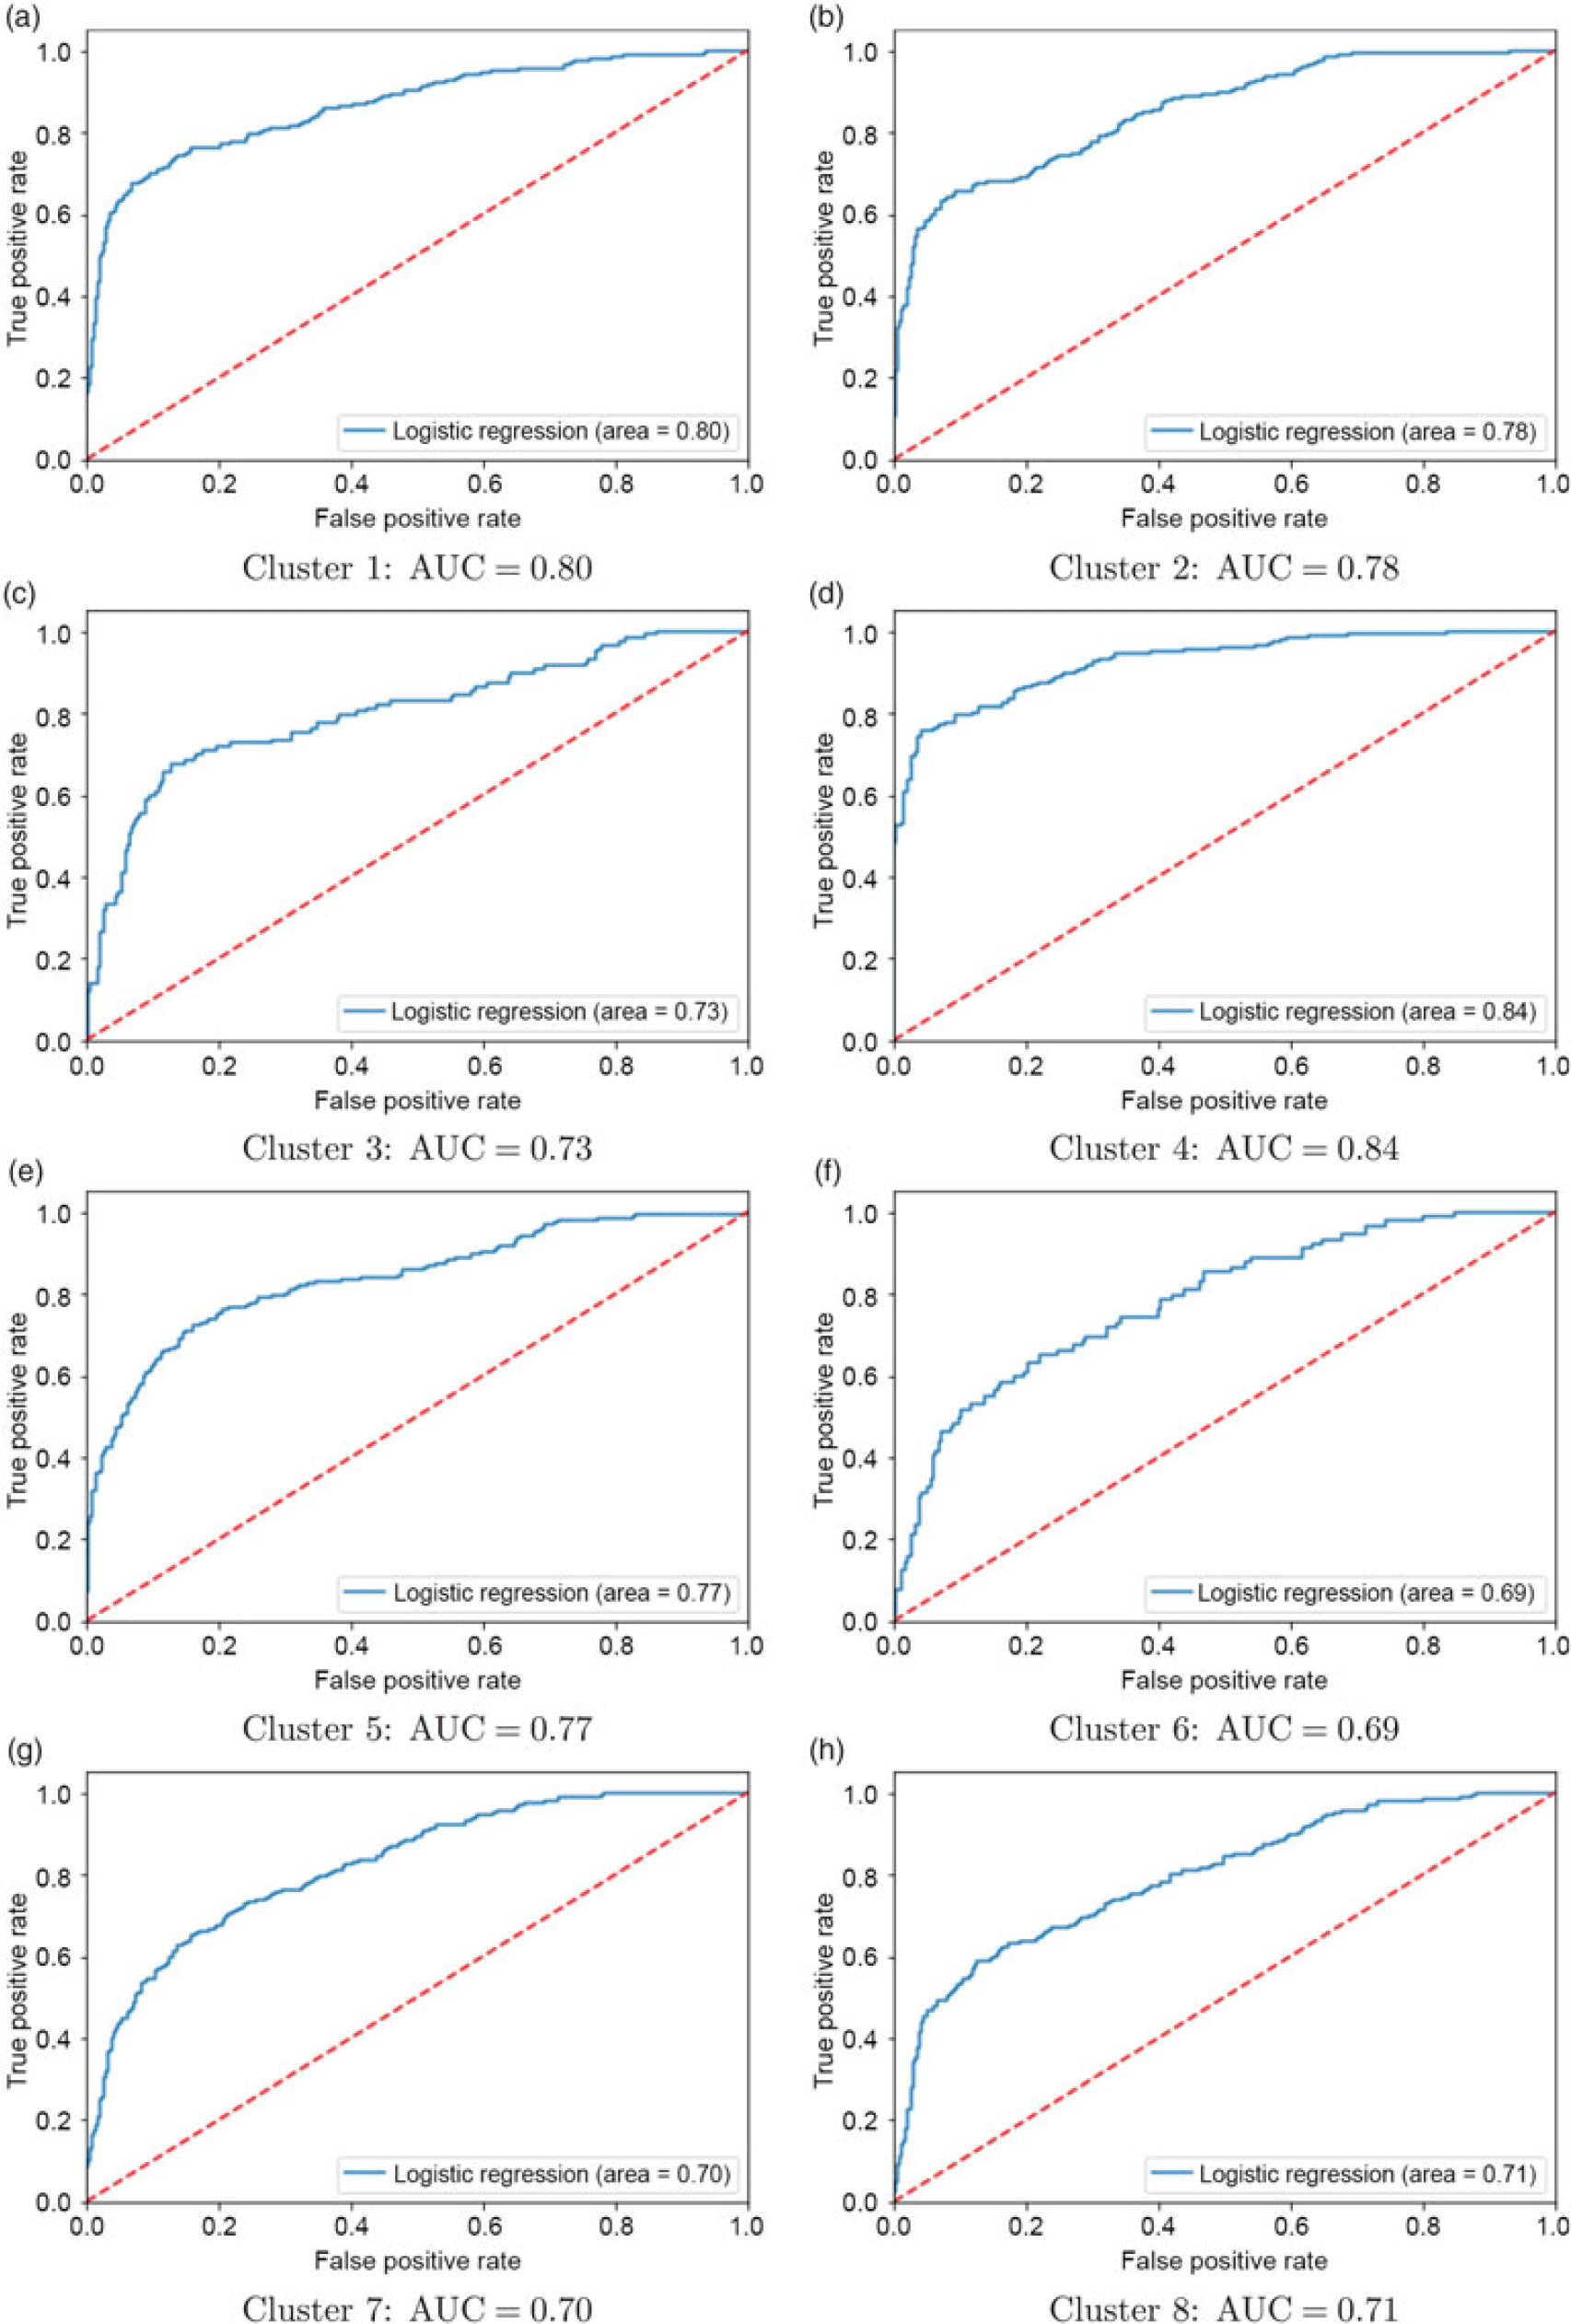
ROC curves of logistic regressions when predicting lapse probabilities given the 8 census clusters using Model 2, for (a) cluster 1, (b) cluster 2, (c) cluster 3, (d) cluster 4, (e) cluster 5, (f) cluster 6, (g) cluster 7 and (h) cluster 8. The area under the curve (AUC) measured for the 8 classification models of Model 2 are 80%, 78%, 73%, 84%, 77%, 69%, 70%, 71% respectively for the 8 clustering components.

The predictive accuracies of the eight models (via ROC) are illustrated in Figure 6. The accuracies for Clusters 1, 2, 4 and 5 are substantially higher than the rate of 76% observed for the model trained using company internal data alone (i.e. Model 1), at 80%, 78%, 84% and 77%, respectively. However, Clusters 3, 6, 7 and 8 do not exhibit an uplift in lapse prediction accuracy (73%, 69%, 70% and 71%, respectively) compared to Model 1, indicating that the demographic census data for this group of policyholders do not provide information that is predictive for the likelihood of a policy lapsing. It is worth noting that the models with improved predictions correspond to clusters that are not very affluent, as discussed in section 3.2.1; and for the affluent areas (i.e. Clusters 3, 6, 7, and 8), predictions are not improved. This suggests that, for the affluent areas, there are further characteristics associated with the lapse behaviour that have not been captured by the company’s existing data, for example, general economic performance indicators. It is also worth noting that the weighted average of all 8 AUCs is also 76%, with the weights being proportional to the size of each cluster, which is the same as the AUC of Model 1. Therefore, it can be concluded that, despite augmenting the company internal data with census clustering not improving the lapse predictions overall, predictions can be improved based on affluence of the areas – in a less affluent area prediction can be improved, whereas in a more affluent area, more information is needed to explore the drivers behind policy lapses. This identification of policy lapse tendencies can also help the formation of marketing strategies for insurance companies.
3.3 Model 3: accounting for heterogeneity between company-specific policies within census clusters
A further refinement of the model presented in section 3.2 is to explore whether there is remaining within-cluster heterogeneity between the customer policies that is attributable to (or can be identified from) the internal company data set alone. This approach consists of three phases: two levels of clustering and then a classification model for each sub-cluster identified. Phase 1 follows the same approach as Phase 1 of Model 2 in section 3.2.1, using the geodemographic census data set to cluster small areas in Dublin into homogeneous clustering components. Subsequently in the new Phase 2, the policies in the company’s internal data within each census cluster are then further clustered using the k-medoids algorithm, using the company-specific variables (as shown in Table 1). A key reason for this additional clustering step is that there is potential heterogeneity among policyholders within the same census cluster, and there may also be relationships between the demographic information of policyholders acquired by the insurance company and the policyholders’ lapse behaviour. Finally in Phase 3, separate logistic regression models are fitted for each of the sub-clusters detected in the new Phase 2.
Note that Phase 1 clustering is the same as that in Model 2 previously, i.e. the first phase of the proposed Model 3 is to cluster the small areas by applying a k-medoids method to the Dublin census demographic variables computed for each small area. As shown in section 3.2.1, there are 8 census clusters detected in Phase 1, each with different affluence levels, with the results presented in Figure 4.
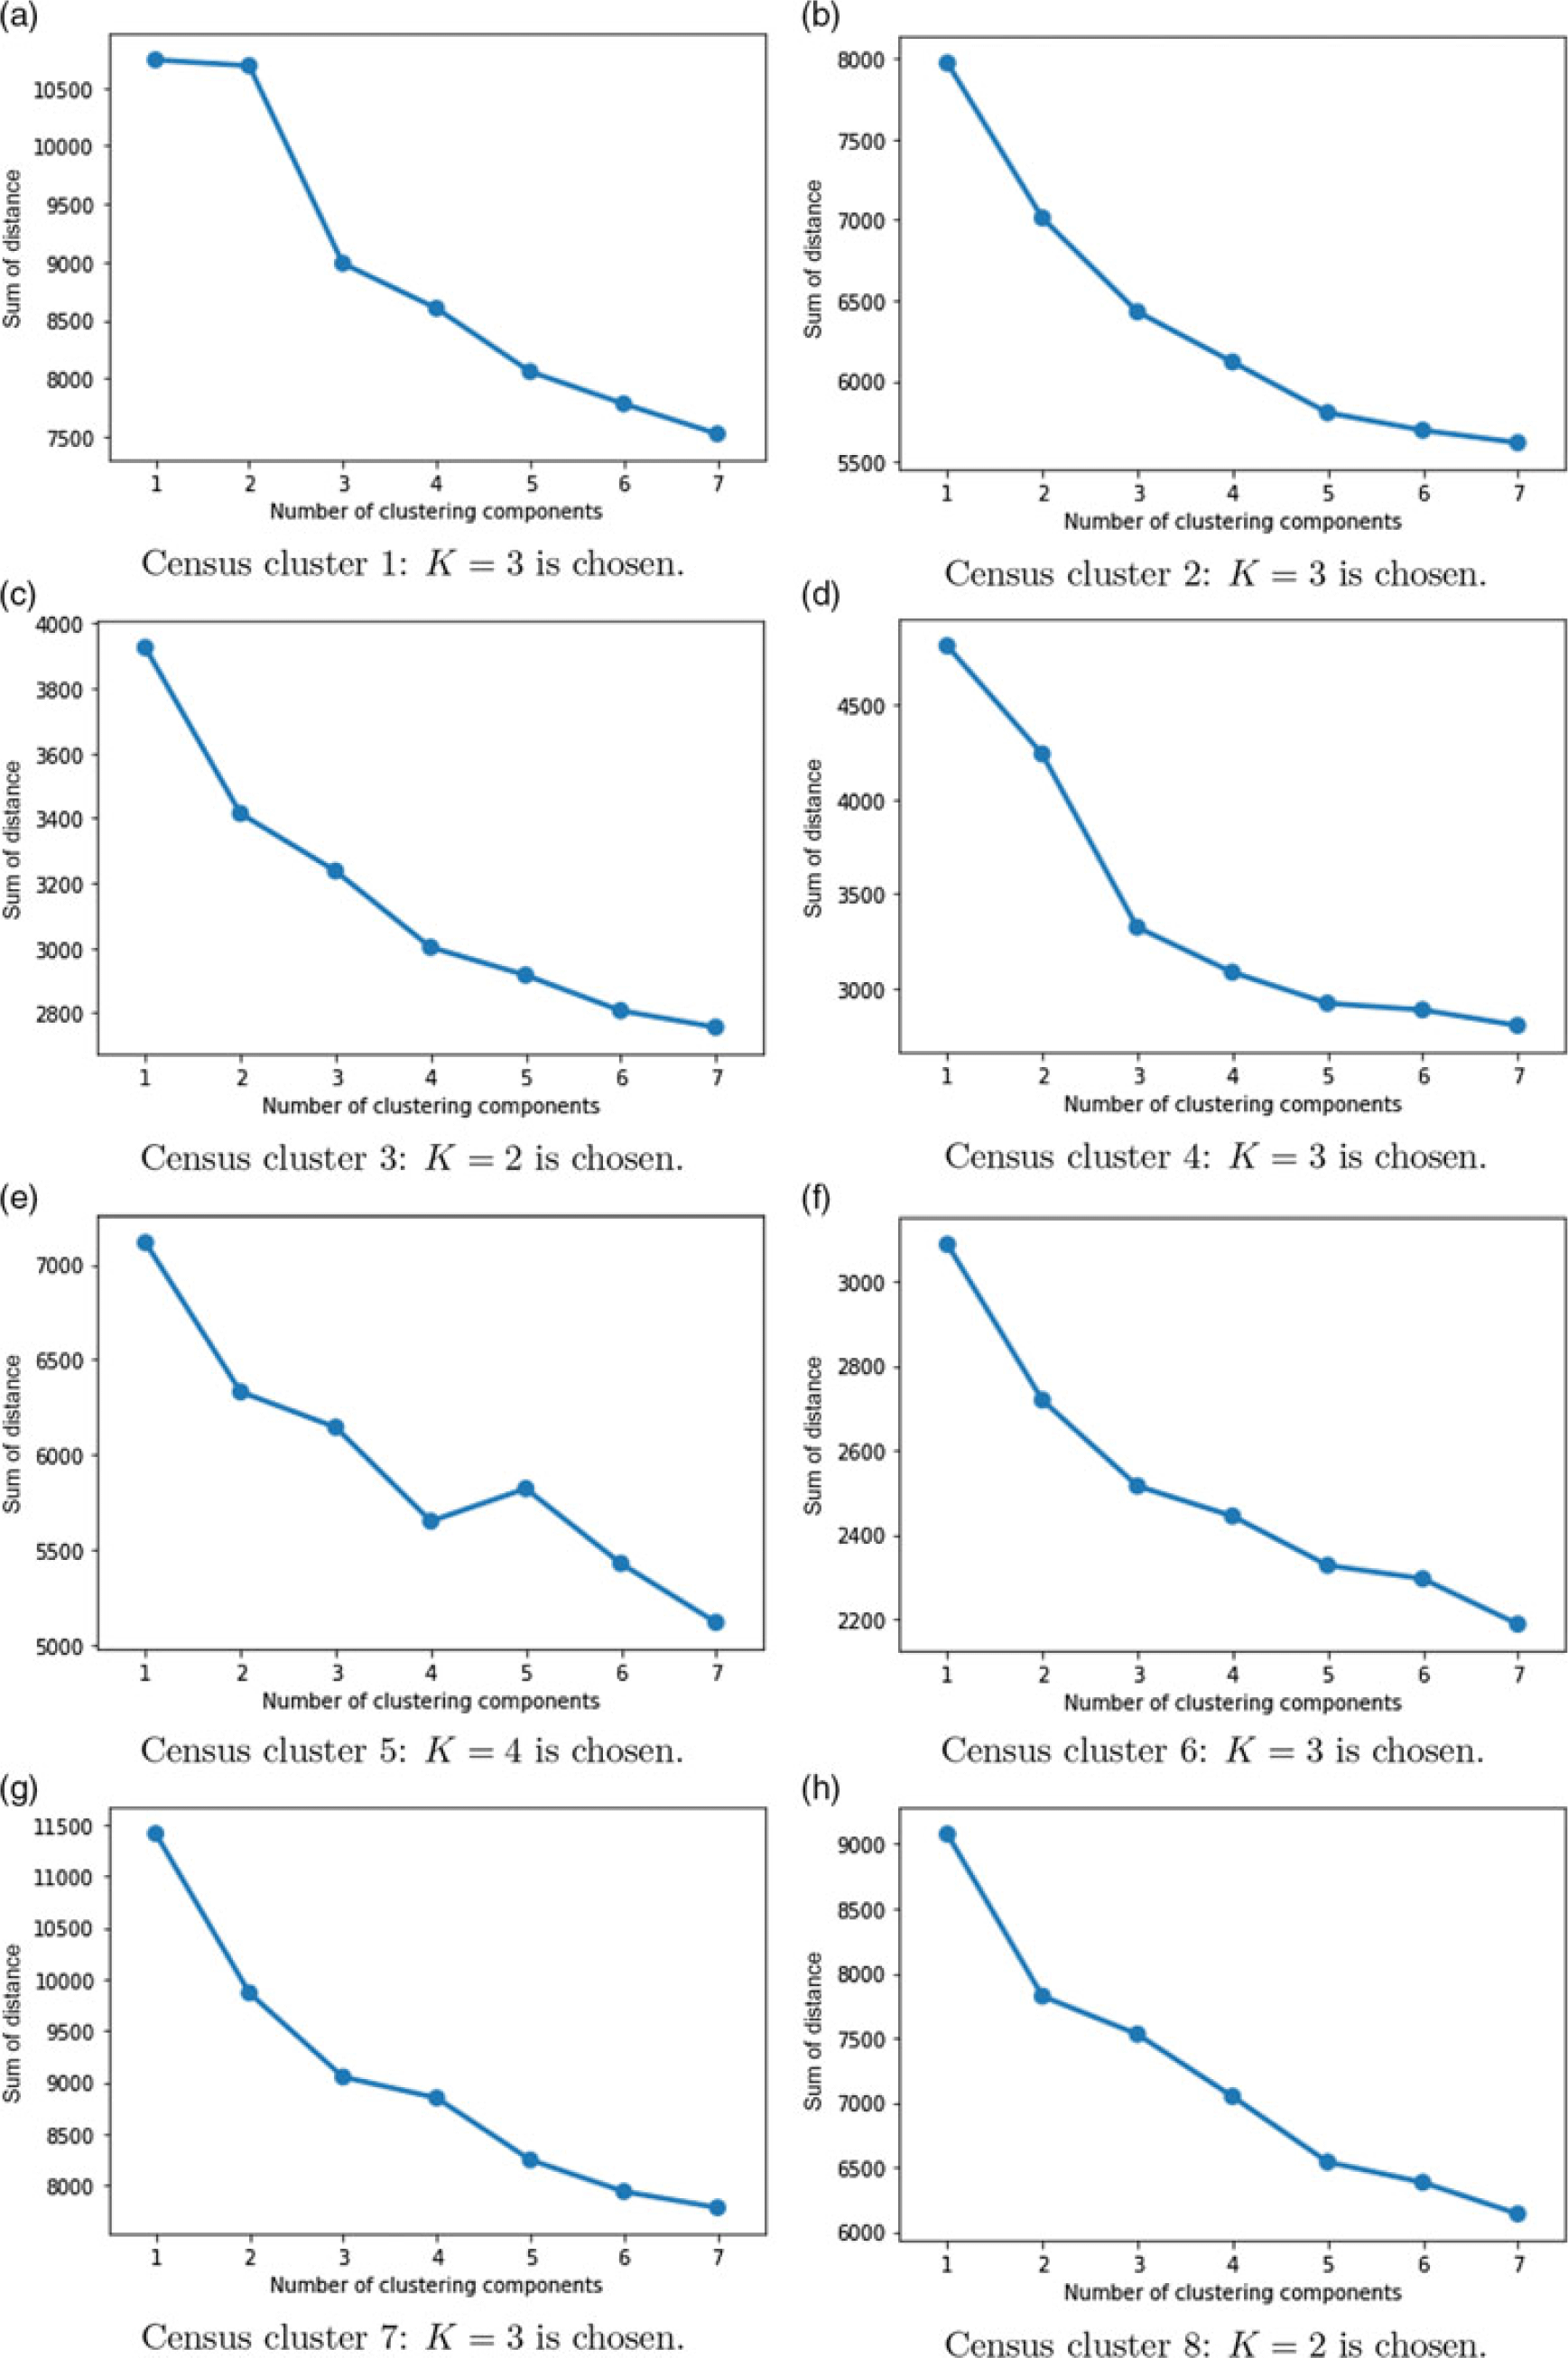
Elbow plots of sum of distance versus number of clustering components, for the company data within the 8 census clusters.

3.3.1 Phase 2: sub-clustering insurance policies within census clusters
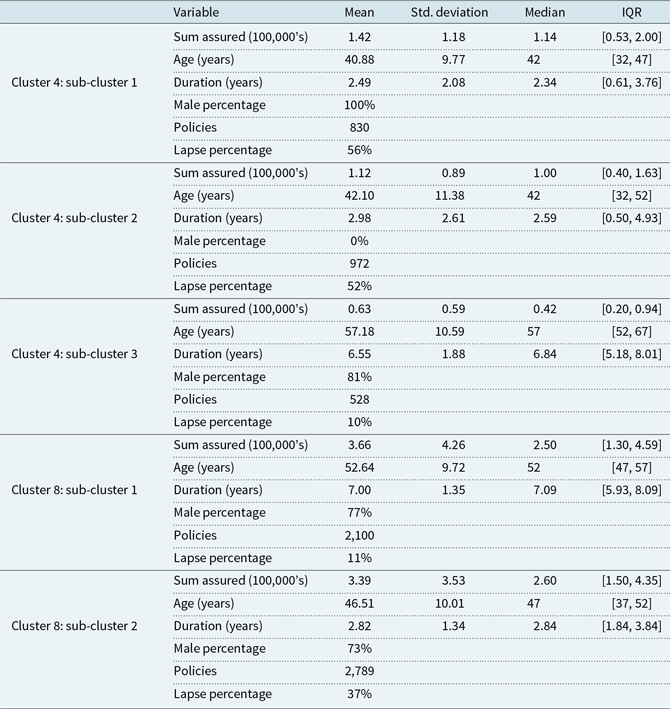
Subsequently, the second level of clustering is implemented (within census clusters) using the elbow method. The elbow plots are shown in Figure 7. For each cluster, the value of K is chosen based on the elbow point as well as consideration for how many observations are in each sub-cluster. If K is too large, the number of policies in each sub-cluster becomes too small for meaningful interpretation. Based on Figure 7, the overall optimal number of sub-clusters has been identified as 23. This is composed of 3 identified sub-clusters within census Clusters 1, 2, 4, 6 and 7; and 2 sub-clusters within Clusters 3 and 8. In the interest of brevity, detailed information about all 23 sub-clusters is not displayed. However, summary information about sub-clusters from the most affluent (Cluster 8) and least affluent census clusters (Cluster 4) is presented, in Table 5. Note that in this table, we are interested in policy heterogeneity within each cluster. It shows that for Cluster 4, the three sub-clusters capture much more homogeneous groups of policyholders: its sub-cluster 1 contains only male policyholders, while its sub-cluster 2 contains only female policyholders; sub-clusters 1 and 2 both cover high-risk policyholders regarding lapse – the lapse rates are both above 50%; its sub-cluster 3 contains a much older generation of policyholders, exhibiting much longer policy duration but much lower total assured sum associated with policies. However, this sub-cluster has a much lower lapse rate at 10%. On the other hand, Cluster 8, with one of the lowest lapse rates amongst all census clusters at 26% overall, is split into two sub-clusters that appear homogeneous from a customer profiling point of view. Its sub-cluster 1 covers policies with older policyholders, longer policy durations and slightly higher sum-assured values, but this sub-cluster has very low lapse rate at only 11%. On the other hand, its sub-cluster 2 has younger policyholders, lower sum-assured values on the policies and much shorter periods of time owning a policy. This cluster also has much higher lapse rate at 37%, which is much higher than for Cluster 8 overall. Therefore, further sub-clustering the company internal policy data based on the census clustering can improve the homogeneity of the policies, and it can be expected that the lapse predictions can be further improved in some of them, potentially depending on the characteristics of the sub-clusters such as affluence as in Model 2.
Summary information for the company policy variables within the sub-clustering components in Census clusters 4 and 8, identified via Model 3

It is worth noting that each small area in each census cluster may contain multiple policies from different detected sub-clusters, and the geo-location points (i.e. address) of policyholders are not permitted for use due to commercial sensitivity and data protection, so the sub-clusters cannot be illustrated on a Dublin map as done for Model 2.
3.3.2 Phase 3: prediction within sub-clusters
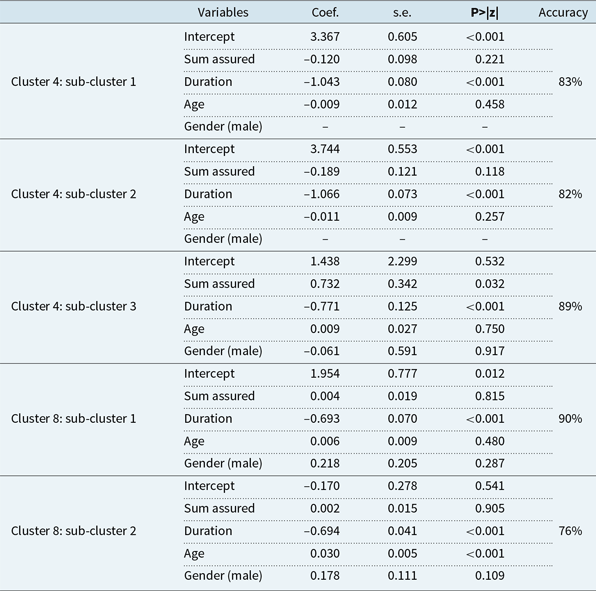
The logistic regression model is fitted to the extracted policies in all 23 sub-clusters. The results for the models of sub-clusters in Cluster 4 and 8 are presented in the interest of brevity in Table 8. The sub-clusters appear to differentiate in terms of the influence of some individual policyholder variables, while the rest of variables are not significant in differentiating them, which is consistent with the findings in Table 7. For sub-clusters in Cluster 4, it is found that its sub-cluster 1 mainly consists of younger male policyholders, its sub-cluster 2 mainly consists of younger female policyholders, while its sub-cluster 3 covers mainly older policyholders, which suggests these sub-clusters are very homogeneous internally regarding age and gender. Therefore, it is not surprising to see that age and gender are not significant in the three separate models corresponding to the three sub-clusters. The influence of policy duration appears to be the primary differentiating factor between sub-clusters 1, 2 and 3. For sub-clusters in Cluster 8, the variables sum-assured and gender are not significant in both its sub-clusters, which makes sense since both sub-clusters are relatively homogeneous internally regarding these two variables. The influence of policy duration is statistically significant for both sub-clusters and is solely significant for the sub-cluster 1 cohort, and age is additionally important for the sub-cluster 2.
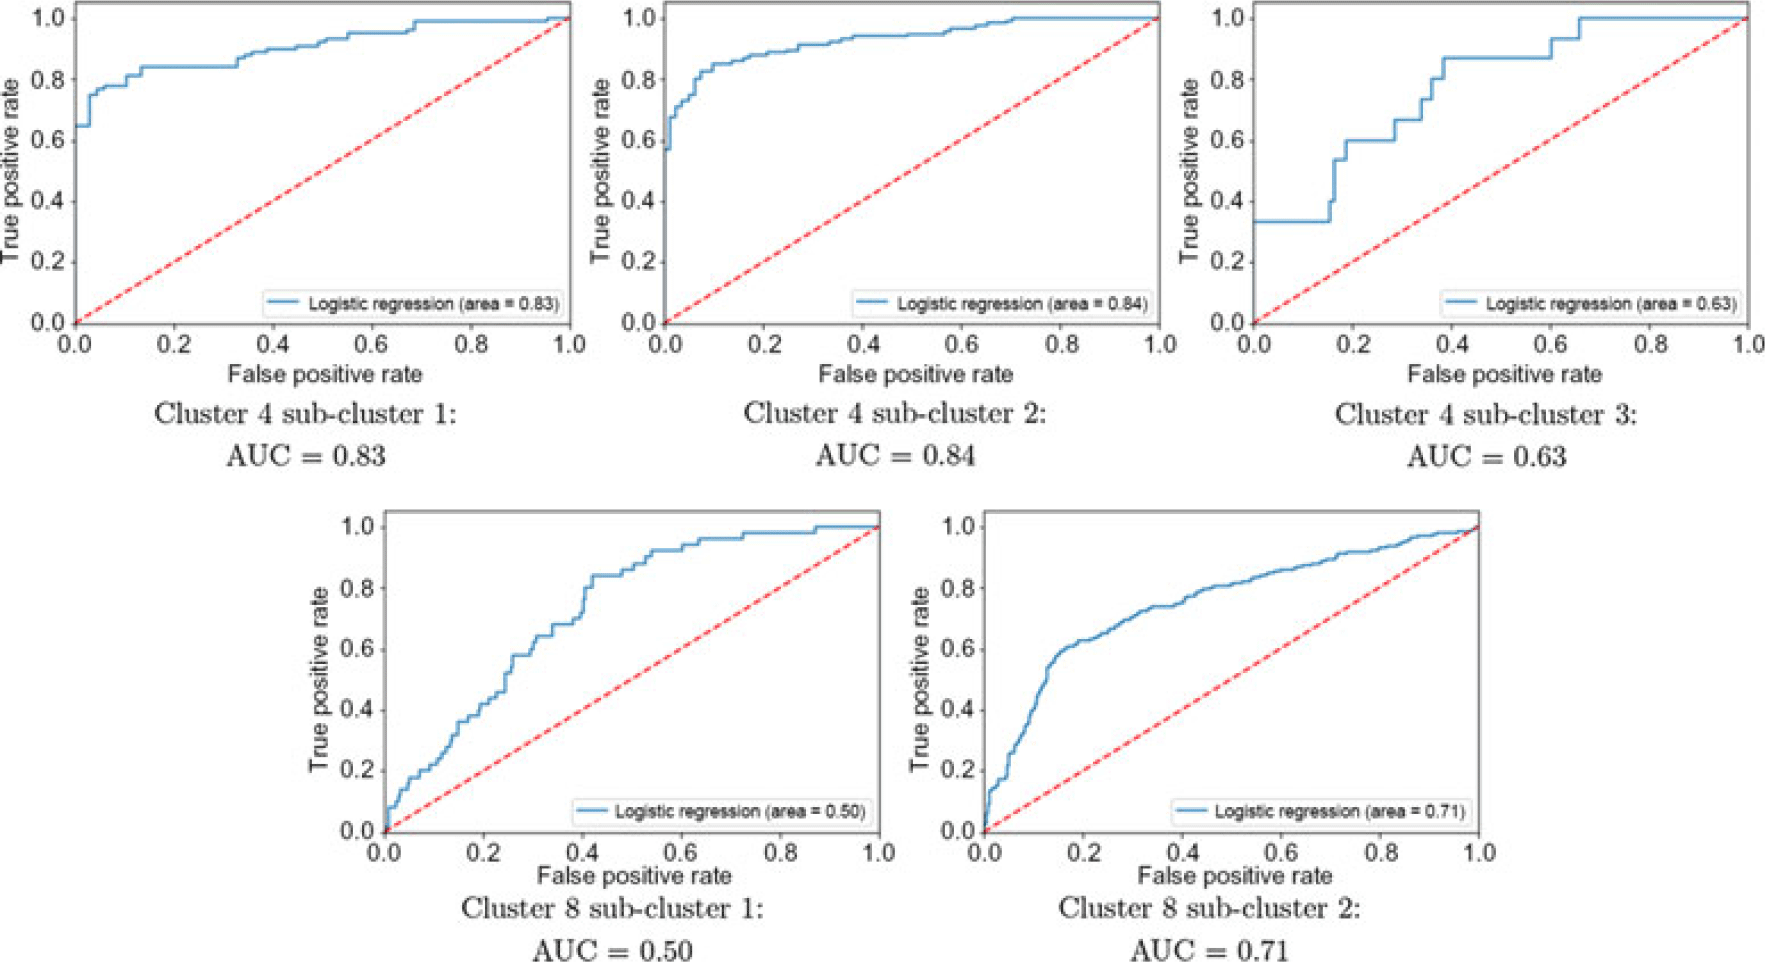
Plot of ROC curves of logistic regression when predicting lapse probabilities for sub-clusters in Cluster 4 and 8.

Logistic regression model results for predicting lapse probability among policies in the sub-clusters in Census clusters 4 and 8, identified via Model 3. Note that for Cluster 4 sub-clusters 1 and 2, gender is homogeneous among all policyholders (see Table 7); therefore, it is excluded from the logistic regression

Recall Model 2 in section 3.2 which concluded that predictive performance depends on the affluence of the areas in the clusters – model predictions are better in less affluent areas, whereas in more affluent areas more information may be needed to explore further drivers of policy lapse. By further sub-clustering the census clusters using company policy data, it is expected that predictions would be further improved. The predictive accuracy of the model, assessed via ROC, is illustrated in Figure 8 by splitting the data into a training set (80%) and a test set (20%). For Cluster 4, which is the least affluent and has AUC as 84% in a ROC curve, sub-clustering does not further improve the AUC. In fact, its sub-cluster 3 has lower AUC at 63%. Similarly for Cluster 8, whose AUC is 71% previously, its sub-cluster 3 has AUC at 50%. However, despite the predictive power assessed using ROC not improving using the metric of ROC as hoped, two conclusions can be made. First, by further sub-clustering, we have identified the most at-risk customers who may lapse their policies in the future. This adds great value in the processes of customer retention and marketing. Second, besides solely using ROC as the predictive performance metric, if model prediction accuracy (i.e. percentage classified correctly) is calculated from the classification confusion matrix, as those in Table 8 compared to those in Table 6, we can see that model prediction is indeed further improved by sub-clustering, especially in the sub-clusters where the AUC is lowered.
4 Conclusions
In this work, we have proposed a hybrid approach to estimate the association between geodemographic clustering and life insurance policyholders’ lapse behaviour, via augmenting an insurance company’s data with national census data. The model consists of different phases, one of which is spatial clustering based on the census data to extract different geodemographic clusters and to understand the spatial distribution of the policyholders, using a machine learning clustering algorithm. The aim of this study is to demonstrate that by incorporating and clustering the publicly available census data, the insurance company can gain insights on the spatial features of its policyholders, adjust marketing and customer retention strategies if necessary and improve future lapse behaviour prediction.
This work concludes that the use of census data is beneficial in understanding the spatial factors and distributions underpinning lapse rates of life insurance policies. Census data also improve prediction of lapse rates in certain types of geo-clusters, depending on the affluence of the area. Across all policyholders, augmenting the company’s existing internal data with census clustering at local population level does not improve lapse prediction. However, in less affluent areas, prediction can be improved, whereas in more affluent areas, additional information is needed to efficiently model policy lapses. In addition, by mapping policyholders into different groups based on census clusters, there is still heterogeneity among within-cluster policyholders. Hence, further clustering company internal data within census clusters before modelling lapse probabilities gives further improvement in modelling accuracy, again depending on the characteristics of the census cluster and sub-clusters in question. These outcomes suggest that insurance companies could benefit substantially from incorporation of publicly available census data, and from modelling lapse rates beyond simply using the data held as part of the company policy records.
The use of a clustering-based approach incorporating spatial data of a geodemographic nature means that clusters can be interpreted in terms of real-life policyholder attributes. This gives the company the opportunity to better understand their customer base and to make better quality decisions in terms of identifying customers with high probability of lapsing, targeting marketing and policy retention initiatives accordingly. This could in turn lead to a measurable reduction in customer churn and to appreciable cost savings for the insurance company.
In this work, the k-medoids partitional clustering algorithm is used to cluster both the census data in Model 2 and the company policyholder data in Model 3. K-medoids clustering represents a very popular choice in dealing with geo-spatial high dimensional data, but other algorithmic options may also yield meaningful results, such as agglomerative hierarchical clustering, mean-shift clustering and partitional clustering incorporated with principal component analysis (PCA) etc. In this work, only the Dublin region is investigated using either the census data or the company data. Another piece of future work could be investigating an nation-wide all-Ireland data set. It is expected that this would yield different spatial cluster profiles compared to those discovered in Dublin, and further insights regarding association between cluster characteristics and policyholder lapse behaviour may be found.
Acknowledgements
This work was funded by Enterprise Ireland under an Innovation Partnership Scheme (grant reference: IP20180712).
Appendices
A. Model 2 Clustering Maps
This appendix shows more details about the clustering results using Method 2 for small areas in each of the 4 local authorities based on the census data, in which 8 clusters are detected. Note that the axes give the geographic coordinates of the map.

B. Model 2 Census Clustering Profiles
The boxplots in this section correspond to the key cluster characteristics in Table 4.

C. Model 3 Prediction Accuracy in Sub-clusters
ROC curves for predicting lapse probability for the sub-clusters detected using Model 3.