Implications
As animal feed costs represent a major part of the production costs in cattle farms, it is important to evaluate the changes of meat nutritional properties in response to the duration of oilseed inclusion in the diet of ruminants. This study demonstrates that a long period of linseed supplementation is not necessary to improve the nutritional properties of meat but that 75 days of supplementation is sufficient to obtain beef enriched with n-3 polyunsaturated fatty acids (PUFA) and bioactive compounds. Short-term diet manipulation can be of interest for the meat industry due to the economic sustainability of linseed feeding.
Introduction
Meat is an excellent nutrient component that provides protein with high biological value, vitamins, minerals and bioactive compounds that contribute to human health. Particularly, creatine displays important physiological activity, having a key role in muscle energy metabolism and in Parkinson’s and Huntington’s neurodegenerative diseases (Adhihetty and Beal, Reference Adhihetty and Beal2008), whereas carnosine and anserine, exert antioxidants and antiaeging effects (Hipkiss, Reference Hipkiss2009). Meat is partly responsible for saturated fatty acids (SFA), cholesterol and other elements that may affect human health (Oostindjer et al., Reference Oostindjer, Alexander, Amdam, Andersen, Bryan, Chen, Corpet, De Smet, Dragsted, Haug, Karlsson, Kleter, de Kok, Kulseng, Milkowski, Martin, Pajari, Paulsen, Pickova, Rudi, Sødring, Weed and Egelandsdal2014). Several studies have been conducted on diet supplementation with oilseeds to produce beef with enhanced levels of components with potential health benefits. Particularly, the effects of linseed supplementation on the fatty acid profiles of meat are well known (e.g. Juarez et al., Reference Juarez, Dugan, Aldai, Aalhus, Patience, Zijlstra and Beaulieu2011), whereas no data are available on how the inclusion of linseed in the diet could affect the content of other components of beef such as bioactive compounds including carnitine, carnosine and anserine. Past studies have monitored the content of these functional compounds by focussing on breed, age, muscle type, rearing system and thermal processing (Purchas and Busboom, Reference Purchas and Busboom2005; Mateescu et al., Reference Mateescu, Garmyn, O’Neil, Tait, Abuzaid, Mayes, Garrick, Van Eenennaam, VanOverbeke, Hilton, Beitz and Reecy2012). In addition, due to costs related to animal feed it is useful to evaluate the changes of meat nutritional properties in response to the duration of oilseed inclusions in the diet of ruminants. Therefore, the aim of this study was to assess how the duration of linseed feeding may affect the content of n-3 PUFA in beef to determine the optimal supplementation strategy. The dietary effects of linseed on the fatty acid profiles, cholesterol and bioactive compounds were also studied.
Material and methods
Experimental design
All animal procedures were approved by the Foggia University Institutional Animal Care and Use Committee (protocol number 002-2016) and were conducted under veterinary supervision by specialized personnel.
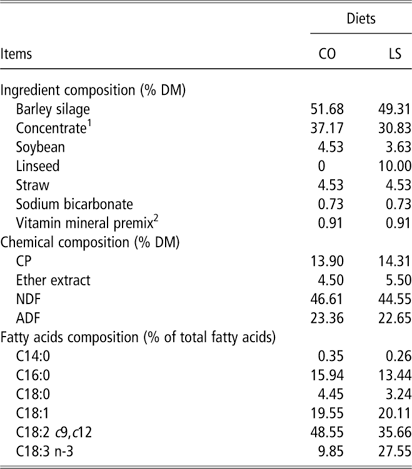
The experiment was conducted on a commercial farm located approximately 20 km north-east of Foggia, Apulia, Southern Italy. In total, 54 Friesian steers (290±12.88 kg means±SE of initial BW) were randomly allocated during the finishing period into six experimental treatments following a 2×3 factorial design. The six treatments consisted of two finishing diets, the control diet (CO) with no supplemental fat and the linseed diet (LS) containing 10% whole linseed, and three different times of administration of the diet: 40, 75 or 120 days before slaughter. During the experimental period, animals were fed in individual pens equipped with automatic waterers and individual feeders. All animals were fed twice per day at 8 am and at 3 pm, and the individual dry matter (DM) intake was calculated daily as the difference between the amount of feed offered and refused. The ingredients and chemical composition of the diets are reported in Table 1. All concentrate ingredients were ground with the exception of the linseeds, which were included as whole seeds. Analyses of feed were carried out on pooled feed samples collected throughout the trial period. Neutral detergent fibre and ADF were determined according to Van Soest et al. (Reference Van Soest, Robertson and Lewis1991), while crude fat (ether extract; method 935.38) and CP (method 984.13) were analysed following the Association of Official Analytical Chemists (AOAC) (1995) methods. Fatty acid composition was determined using the procedure described by Sukhija and Palmquist (Reference Sukhija and Palmquist1988).
Ingredients and chemical and fatty acid composition of experimental diets administered to Friesian steers

CO=control; LS=linseed; DM=dry matter.
1 Ingredients: barley, wheat bran, maize meal, wheat meal, molasses.
2 Ingredients: vitamin A, 1 150 000 IU; vitamin D, 390 000 IU; vitamin E, 50 mg; vitamin PP, 8500 mg; vitamin B1, 112 mg; vitamin B2, 112 mg; vitamin B6, 80 mg; vitamin B12, 1 mg; d-pantotenic acid, 2400 mg; choline, 15 000 mg; iron, 150 mg; manganese, 800 mg; zinc, 2200 mg; cobalt, 8 mg; iodine, 30 mg; selenium, 5 mg; molibden, 10 mg.
Performance in vita and meat sample collection
All animals were individually weighed every 15 days in order to determine growth performance. At the end of each feeding period, steers fed with the control and LSs were weighed on the morning of slaughter to record the final BW and were transported to a commercial abattoir. Slaughter occurred according to industrial routines used in Italy and to the EU rule n.1099/2009. After slaughter the hot carcass weight was recorded and the dressing percentage was calculated. pH was determined 1 and 24 h after slaughter using a portable pH meter (Hanna Instruments, Woonsocket, RI, USA) and combined glass electrode, inserted approximately 5 cm into the longissimus thoracis muscle. After 8 days of ageing longissimus thoracis muscle was removed from each half carcass and cut into steaks for chemical analysis, fatty acids profiles, cholesterol content and bioactive compounds determination.
Meat chemical composition and fatty acid methyl esters profile
Meat samples were ground to a homogeneous consistency using a food processor. The moisture, protein, lipid and ash contents were determined according to AOAC (1995) methods.
The fatty acid analyses of the meat were carried out according to O’Fallon et al. (Reference O’Fallon, Busboom, Nelson and Gaskins2007) with some modifications as described by della Malva et al (Reference della Malva, Albenzio, Annicchiarico, Caroprese, Muscio, Santillo and Marino2016). Fatty acids were identified by comparing their retention times with the fatty acid methyl standards (FIM-FAME-7-Mix; Matreya LLC, Pleasant Gap, PA, USA), added of C18:1 11t, C18:2 9c,11t, C18:2 9c,11c, C18:2 9t,11t, and C18:2 10t,12c (Matreya LLC).
Atherogenic and thrombogenic indices were calculated according to Ulbricht and Southgate (Reference Ulbricht and Southgate1991) as follows:
 $$\eqalign{&{\rm \hskip -203pt Atherogenic}\,{\rm index}\,\left ( {{\rm AI}} \right)\, \cr {\equals}\,\left( {{\rm C}12\colon0{\,\plus\,}4\,{\times\,}{\rm C}14\colon0{\,\plus\,}{\rm C}16\colon0} \right)/\, \hskip --31pt \cr \hskip --22pt \left[ {\sum{\rm MUFA}{\,\plus}\sum{\rm PUFA}\,\left( {\rm n{\hbox-}6} \right)\,{\rm \,and}\,\left( {\rm n{\hbox-}3} \right)} \right]$$
 $$\eqalign{&{\rm \hskip -38pt Thrombogenic}\,{\rm index}\,\left( {{\rm TI}} \right) \cr {\hskip 40pt \equals}\;\left( {{\rm C}14\colon0{\,\plus\,}{\rm C}16\colon0{\,\plus\,}{\rm C}18\colon0} \right)/\, \hskip -122pt \cr &\quad \left[ {0.5{\,\times}\sum{\rm MUFA}{\,\plus\,}0.5{\,\times}\sum{\rm PUFA}\,\left( {\rm n{\hbox-}6} \right){\,\plus\,}3 } \right \right \cr &\quad {\times}\sum{\rm PUFA }\left( {\rm n{\hbox-}3} \right){\,\plus\,}\left( {\rm n{\hbox-}3} \right)/\left( {\rm n{\hbox-}6} \right)} \right]$$
Cholesterol and bioactive compound determination
The cholesterol content was determined using a quantitative colorimetric kit (Biovision, CA, USA) with a UV–Vis spectrophotometer (Biotek PowerWaveXS2; Biotek Instruments Inc., Highland Park, Winooski, VT, USA). Absorbance was measured at 570 nm against a standard curve obtained using scalar dilution of a cholesterol standard. The cholesterol content was expressed as mg/100 g of muscle.
Creatine, creatinine, carnosine and anserine were extracted from raw meat and analysed by HPLC according to Mateescu et al. (Reference Mateescu, Garmyn, O’Neil, Tait, Abuzaid, Mayes, Garrick, Van Eenennaam, VanOverbeke, Hilton, Beitz and Reecy2012) with small modifications. Briefly, 6 ml of 0.01 N HCl were added to 2 g of ground sample and vortexed for 15 s. The mixture was placed on an orbital shaker (with ice) for 15 min and centrifuged for 20 min at 12,000× g and 4°C. Supernatant was filtered through PTFE Syringe Filters (Sigma-Aldrich, St Louis, MO, USA; 13 mm, 0.45 um) and 250 µl of this solution were deproteinized by adding 750 µl of acetonitrile. Samples were held at 4°C for 20 min then centrifuged for 10 min at 10,000× g and 4°C. Finally, 20 µl of each sample were injected into the HPLC system.
The chromatographic separation was performed using an Infinity 1260 HPLC (Agilent Technologies, Palo Alto, CA, USA) equipped with Kinetex HILIC Silica column (Phenomenex, Torrance, CA, USA; 4.6×75 mm, 2.6 µm) and a DAD detector (Agilent Technologies). Mobile phases consisted of solvent A, containing 0.65 mM ammonium acetate, pH 5.5, in water/acetonitrile (25:75, vol/vol), and solvent B, containing 4.55 mM ammonium acetate, pH 5.5, in water/acetonitrile (70:30, vol/vol). The separation conditions were a linear gradient from 0% to 100% of solvent B in 13 min at a flow rate of 1.4 ml/min. Before each injection the column was equilibrated for 10 min under the initial conditions. Creatine, carnosine and anserine were identified at a wavelength of 214 nm, whereas creatinine at 236 nm. For the quantification, sample peak areas were correlated to standard curves, previously obtained under the same chromatographic conditions.
Statistical analysis
All the variables were tested for normal distribution using the Shapiro–Wilk test (Shapiro and Wilk, Reference Shapiro and Wilk1965). Data were subjected to ANOVA following a 2×3 factorial arrangement using the GLM procedure of the SAS statistical software (Statistical Analysis System, 2011). Individual steer was the experimental unit, the following model was used:
 $$y_{{ijk}} {\,\equals\,}\mu {\,\plus\,}\alpha _{i} {\,\plus\,}\beta _{j} {\,\plus\,}\left( {\alpha \beta } \right)_{{ij}} {\,\plus\,}{\epsilon}_{{ijk}} $$
in which µ is the overall mean; α the effect of diet (i=1−2); β the effect of duration of feeding (j=1−3); αβ the interaction of diet × duration and ε the error with the animal as a random factor nested in the treatment. All effects were tested for statistical significance (to P<0.05) and significant effects were reported in tables.
Results
Feed intake and animal performance
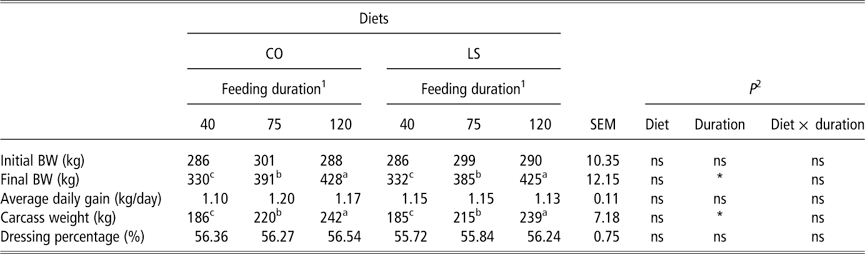
Daily total DM intake across the treatments was similar as CO steers consumed 6.82 kg DM/day of experimental CO diet (6.71, 6.89 and 6.85 kg DM/day at 40, 75 and 120 days, respectively) and LS steers consumed 6.88 kg DM/day of experimental LS diet (6.75, 6.85 and 6.92 kg DM/day at 40, 75 and 120 days, respectively). Animal performances data are summarized in Table 2. Final BW, average daily gain, carcass weight and dressing percentage were not affected by dietary treatments. As expected the highest final BW and carcass weight were found at 120 days of feeding, regardless of the diet.
Effect of linseed inclusion and feeding duration on growth performance and dressing percentage of Friesian steers (means±SEM)

CO=control; LS= linseed.
1 40, 75 and 120 days.
2 Refers to significance of overall effect of diet and feeding duration.
a,b,cValues within a row with different superscripts differ significantly among feeding duration at P<0.05.
*P<0.05.
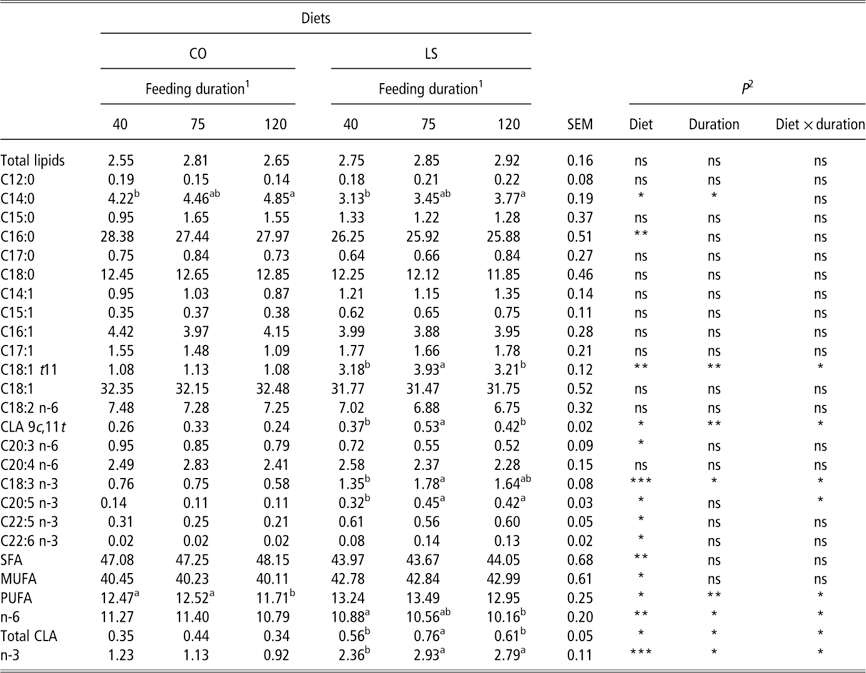
Twenty-hour pH values (data not shown) in all experimental groups fell within the normal range (5.5 to 5.8) to avoid dark-cutting. Linseed supplementation and duration of feeding did not influence chemical composition of meat. Particularly, as shown in table 3 dietary treatments did not affect the amount of intramuscular fat.
Effect of linseed inclusion and feeding duration on total lipids and fatty acid profile (%) of meat from Friesian steers (means±SEM)

CO = control; LS=linseed; SFA=saturated fatty acids; MUFA=monounsaturated fatty acids; PUFA=polyunsaturated fatty acids.
1 40, 75 and 120 days.
2 Refers to significance of overall effect of diet and feeding duration.
a,bValues within a row with different superscripts differ significantly among feeding duration at P<0.05.
*P<0.05; **P<0.01; ***P<0.001.
Fatty acid composition
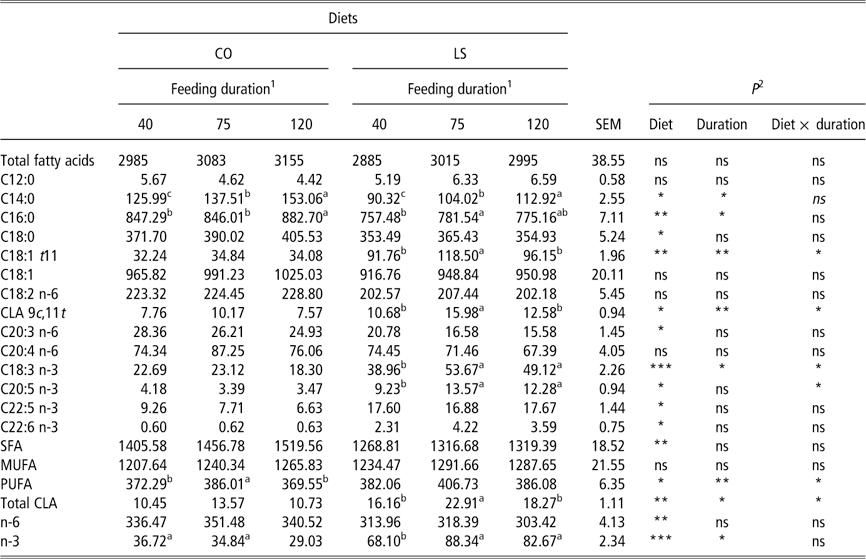
The effects of linseed supplementation and duration of feeding on fatty acid composition of the longissimus thoracis muscle as a percentage of total fatty acids and as mg of fatty acids per 100 g of muscle are shown in Tables 3 and 4, respectively. Diet significantly affected the proportion of SFA (P<0.01); in particular, meat from the linseed group showed lower amount of myristic (C14:0, P<0.05) and palmitic (C16:0, P<0.01) acids compared with the control group. Linseed supplementation increased significantly the total monounsaturated fatty acids (MUFA, P<0.05), PUFA (P<0.05), total CLA (P<0.05) and n-3 PUFA (P<0.001), while it reduced n-6 PUFA (P<0.01) both in amount and in proportion. In particular, the highest values of vaccenic (C18:1 t11, P<0.01), CLA 9c,11t (P<0.05), linolenic (C18:3 n-3; P<0.001), EPA (C20:5 n-3, P<0.05), DPA (C22:5 n-3, P<0.05) and DHA (C22:6 n-3, P<0.05) fatty acids were found in meat from steers fed linseed.
Effect of linseed inclusion and feeding duration on fatty acid composition (mg/100 g) of meat from Friesian steers (means±SEM)

CO=control; LS=linseed; SFA=saturated fatty acids; MUFA=monounsaturated fatty acids; PUFA=polyunsaturated fatty acids.
1 40, 75 and 120 days.
2 Refers to significance of overall effect of diet and feeding duration.
a,b,cValues within a row with different superscripts differ significantly among feeding duration at P<0.05.
*P<0.05; **P<0.01; ***P<0.001.
The duration of feeding and the interaction of diet × duration significantly affected the proportions of several fatty acids. The percentage of myristic fatty acid increased with the duration of feeding (P<0.05), regardless of diet. In contrast, a decline in the total PUFA (P<0.01) and n-6 PUFA percentages (P<0.05) was observed throughout the experiment in the CO and in the LS, respectively. Furthermore, meat from steers fed with linseed showed an increase of n-3 (P<0.05), linolenic (P<0.05) and EPA (P<0.05) fatty acids from 40 to 75 days of administration, remaining constant thereafter. Vaccenic acid (P<0.01), CLA 9c,11t (P<0.01) and total CLA (P<0.05) increased from 40 to 75 days but declined at 120 days.
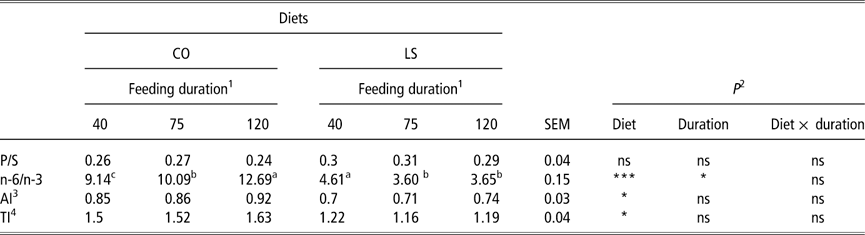
The differences in the proportions of SFA, MUFA, n-3 and n-6 PUFA due to the effect of linseed supplementation and the duration of dietary treatment significantly affected nutritional indices, as shown in Table 5. Meat from the linseed group had a lower n-6/n-3 ratio (P<0.001) and lower atherogenic (P<0.001) and thrombogenic (P<0.001) indices than the control group. Regarding the duration of feeding, the n-6/n-3 ratio had an opposite trend in meat from CO and LS throughout the experimental period. A gradual increase in the n-6/n-3 ratio was observed in the control group (P<0.05), whereas in the linseed group, a decrease was found (P<0.05) from 40 to 75 days of administration, which remained constant thereafter.
Effect of linseed inclusion and feeding duration on nutritional indices of meat from Friesian steers (means±SEM)

CO=control; LS=linseed; P/S=polyunsaturated/saturated; MUFA=monounsaturated fatty acids; PUFA=polyunsaturated fatty acids.
1 40, 75 and 120 days.
2 Refers to significance of overall effect of diet and feeding duration.
3 Atherogenic index (AI)=(C12:0+4×C14:0+C16:0)/[MUFA + PUFA (n-6) and (n-3)].
4 Thrombogenic index (TI) =(C14:0+C16:0+C18:0)/[(0.5×MUFA +0.5×PUFA (n-6)+3×PUFA (n-3)+(n-3)/(n-6)].
a,b,cValues within a row with different superscripts differ significantly among feeding duration at P<0.05.
*P<0.05; ***P<0.001.
Bioactive compound content and cholesterol content
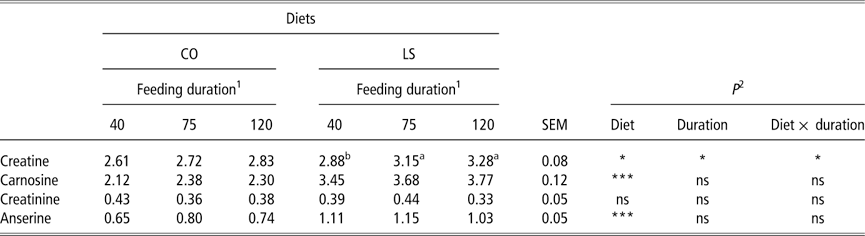
The creatine, creatinine, carnosine and anserine contents in meat from the longissimus thoracis muscle as influenced by diet and duration of dietary treatment are reported in Table 6. Diet significantly affected the profile of bioactive substances. In particular, meat from the linseed group had a greater concentration of creatine (P<0.05), carnosine (P<0.001) and anserine (P<0.001) than did control meat. The duration of feeding significantly affected the creatine (P<0.05) concentration, while no differences were found in the carnosine, creatinine and anserine concentrations. In particular, in the linseed group, the creatine concentration increased from 40 to 75 days of feeding, whereas after 120 days, no differences were found.
Effect of linseed inclusion and feeding duration on bioactive compounds (mg/g meat) of meat from Friesian steers (means±SEM)

CO=control; LS=linseed.
1 40, 75 and 120 days.
2 Refers to significance of overall effect of diet and feeding duration.
a,bValues within a row with different superscripts differ significantly among feeding duration at P<0.05.
*P<0.05; ***P<0.001.
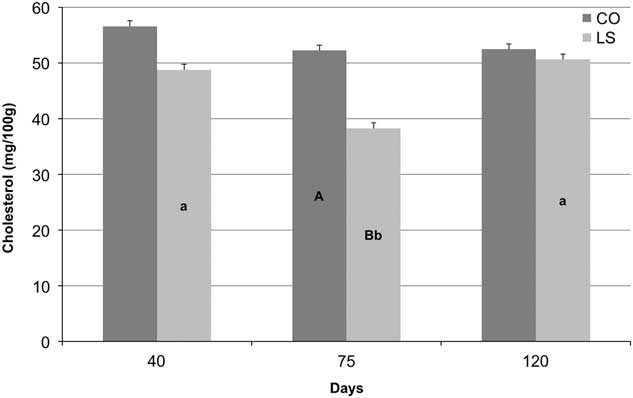
The effect of diet and duration of feeding on the cholesterol content of meat from the longissimus thoracis muscle is shown in Figure 1. The meat cholesterol content was not affected by the dietary treatments, but significant differences (P<0.05) were found due to duration of feeding in the linseed group, with the lowest cholesterol content in meat after 75 days of feeding.
Effect of different diets (CO=control, LS=linseed) and feeding duration (40, 75 and 120 days) on the cholesterol content (mg/100 g) of meat from Friesian steers (means±SEM). a,bValues with different superscript letters differ significantly (P<0.05) for feeding duration effect. A,BValues with different superscript letters differ significantly (P<0.05) for diet effect (color online).

Discussion
Animal performance and fatty acid composition
Diet did not affect growth performance and dressing percentage in agreement with other studies performed on finishing cattle fed linseed (Corazzin et al., Reference Corazzin, Bovolenta, Sepulcri and Piasentier2012). In the our study, we have focussed on fat content and fatty acid profiles, with particular emphasis on the health benefits obtained by human consumption of meat lipids. The lack of effect of linseed inclusion on intramuscular fat content could be due to the comparable energetic and protein level of the diets but also to the quite similar DM intake. In particular, Alberti et al. (Reference Alberti, Gómez, Mendizabal, Ripoll, Barahona, Sarriés, Insausti, Beriain, Purroy and Realini2013) found no differences in the number and size of adipocytes and in lipogenic enzyme activity.
The reduction of SFA content in meat from the LS group may be related to a reduction of endogenous fatty acid synthesis from the rumen due to the inhibitory effect of linolenic acid yielded by the LS diet. This hypothesis is supported by the fact that the lowest palmitic percentage was found in the LS group, which is the major endogenous fatty acid synthesis product. Comparable to our results, previous research (Corazzin et al., Reference Corazzin, Bovolenta, Sepulcri and Piasentier2012) highlighted a reduction in the proportion of SFA ⩽C16:0 in the muscle of beef cattle fed linseed. From a nutritional point of view, myristic and palmitic fatty acids are positively associated with a risk of atherosclerosis and other cardiovascular diseases (Oostindjer et al., Reference Oostindjer, Alexander, Amdam, Andersen, Bryan, Chen, Corpet, De Smet, Dragsted, Haug, Karlsson, Kleter, de Kok, Kulseng, Milkowski, Martin, Pajari, Paulsen, Pickova, Rudi, Sødring, Weed and Egelandsdal2014). Linseed supplementation increased the levels of C18:1 t11 acid in meat as a product of rumen bio-hydrogenation of dietary linoleic and linolenic acids. The increased ruminal concentration of C18:1 t11 acid may account for the increase in CLA in meat from the linseed group via stearoyl CoA desaturase. This enzyme converts vaccenic acid to its corresponding CLA 9c,11t isomer, the main CLA isomer, during the bio-hydrogenation process (Griinari et al., Reference Griinari, Corl, Lacy, Chouinard, Nurmela and Bauman2000). In addition, meat from steers fed linseed was enriched with n-3 fatty acid, which was accompanied by a decrease of n-6. This different trend is related to the amount of whole linseed in the diet (10%) and to the ratio of 18:3 n-3 to 18:2 n-6. In particular, these fatty acids compete for the same enzymes responsible for desaturation and elongation and for their incorporation into lipid tissues (Diaz et al., Reference Diaz, Caneque, Sanchez, Lauzurica, Perez, Fernandez, Alvarez and De la Fuente2011). Linseed supplementation increased the availability of linolenic acid in the muscle, resulting in an enhanced synthesis of its elongation and desaturation products such as EPA, DPA and DHA. Long-chain (LC) fatty acids have different beneficial effects on human health (Givens et al., Reference Givens, Kliem and Gibbs2006), especially on the development of the brain and retina in neonatal growth (Koletzko et al., Reference Koletzko, Lien, Agostoni, Bohles, Campoy, Cetin, Decsi, Dudenhausen, Dupont, Forsyth, Hoesli, Holzgreve, Lapillonne, Putet, Secher, Symonds, Szajewska, Willatts and Uauy2008).
Scollan et al. (Reference Scollan, Dannenberger, Nuernberg, Richardson, MacKintosh, Hocquette and Moloney2014) highlighted that the concentration of LC n-3 PUFA in beef from cattle fed non ruminally protected lipids falls below the limit required by nutrient referent standard to be labelled a source of n-3 PUFA. Particularly, the European Food Safety Authority (2009) indicates that 40 mg and 80 mg/100 g of meat are a ‘source’ and ‘good source’ of EPA + DHA, respectively, and the Australian nutrient reference standard (Food Standards Australia New Zealand, 2013) suggests that 22 mg and 44 mg/100 g of meat are a ‘source’ and good source’ of EPA + DHA, respectively. In the present study, values of approximately 12 mg EPA/100 g and 3.5 mg of DHA/100 g were achieved in meat from the linseed group; this result, could be a good result, from a nutritional point of view, in agreement with Scollan et al (Reference Scollan, Dannenberger, Nuernberg, Richardson, MacKintosh, Hocquette and Moloney2014) and De Smet and Vossen (Reference De Smet and Vossen2016). This latter author highlighted that the impact of meats enriched in LC n-3 PUFA on increasing these nutrients in the human diet is quantitatively modest, because muscle is a resistant tissue to modify.
Feeding linseed strongly reduced the n-6/n-3 ratio, reaching values lower than the recommended threshold of 4.0 (British Department of Health, 1994). Furthermore, meat from the linseed group was also characterized by low atherogenic and thrombogenic indices. The atherogenic and thrombogenic indices express the level and the interaction through which some fatty acids could promote or prevent cardiovascular disease (Marino et al., Reference Marino, Albenzio, Annicchiarico, Caroprese, Muscio, Santillo and Sevi2008).
Related to the duration of dietary treatment, the present results suggest that supplying 10% linseed for 75 days before slaughter is a sufficient feed duration to reach the saturation plateau for the synthesis of the PUFA n-3 metabolites. The increase at 75 days and the subsequent drop at 120 days of CLA 9c,11t in meat from the linseed group could be due to the regulation pathway of Δ9-desaturase activity. Waters et al. (Reference Waters, Kelly, O’Boyle, Moloney and Kenny2009) found a reduction in the gene expression that codes the enzyme responsible for desaturation of vaccenic acid into CLA in bovine meat due to dietary n-3 PUFA supplementation. The same authors highlighted that the minimum time required to reduce, significantly, ∆9-desaturase messenger RNA expression was not determined, although they found that 50 days was sufficient and that a prolonged supplementation period did not further reduce the expression of ∆9-desaturase. On the contrary the increase at 75 days and the subsequent drop at 120 days of C18:1 11t in the muscle could be due to a change in biohydrogenation process. Particularly, the long-term supplementation could led to a reduction of protozoaria population in rumen and the magnitude of the effect seems to depend on the level of lipid supplementation as suggested by Doreau and Ferlay (Reference Doreau and Ferlay1995).
Bioactive compounds and cholesterol content
Linseed is rich in essential amino acids such as histidine, methionine, isoleucine, valine, leucine, threonine and lysine (Bernacchia et al., Reference Bernacchia, Preti and Vinci2014). Histidine is one of two main components of carnosine (β-alanyl-l-histidine) and anserine (β-alanyl-N-methylhistidine), whereas methionine is essential for creatine synthesis, which is limited when methionine is not provided in the diet. Therefore, the content of creatine, creatinine, carnosine and anserine found in meat from the linseed group could be linked to the amino acid composition of linseed. In addition, we suggest that the high content of n-3 PUFA present in linseed could have contributed to the greater content of these bioactive compounds. Previous studies (Gingras et al., Reference Gingras, White, Chouinard, Julien, Davis, Dombrowski, Couture, Dubreuil, Myre, Bergeron, Marette and Thivierge2007; Hiller et al., Reference Hiller, Herdmann and Nuernberg2011) highlighted that dietary n-3 fatty acids accounted for muscle protein synthesis. In particular, Gingras et al. (Reference Gingras, White, Chouinard, Julien, Davis, Dombrowski, Couture, Dubreuil, Myre, Bergeron, Marette and Thivierge2007), in a study on growing steers, found that dietary supplementation with n-3 fatty acids increased sensitivity to insulin, increasing protein metabolism with a greater availability of amino acids. For this reason, the highest content of creatine in meat from the linseed group after 75 days could be related to the highest content of n-3 PUFA found at this feeding time, confirming what has been previously postulated.
From a nutritional point of view, the results of the present study highlighted the lower cholesterol content in meat from steers fed linseed after 75 days of supplementation. This could be related to the high PUFA content of meat found after 75 days of linseed supplementation, which might have affected the meat cholesterol content. An increase in the concentration of PUFA may decrease the activity of 3-hydroxy-3-methylglutaryl CoA reductase, which is the rate-limiting enzyme in cholesterol synthesis. Indeed, the composition and the storage of cholesterol and lipoprotein-cholesterol esters in tissues and in body fluids is avoided by the intake of n-3 PUFA (Litwińczuk et al., Reference Litwińczuk, Domaradzki, Grodzicki, Litwińczuk and Florek2015). This finding highlights that the level of cholesterol synthesis is regulated by dietary intake of PUFA and suggests that cholesterol content is not simply related to the amount of intramuscular fat, as reported in a previous study (Smith et al., Reference Smith, Smith and Lunt2004).
Conclusions
The results highlight that linseed supplementation not only improved fatty acid profile of meat in terms of a lower content of SFA and a higher content of PUFA, CLA total and LC fatty acids, but it also enriched meat with bioactive compounds, including carnitine, carnosine and anserine. Furthermore, this study demonstrates that a long supplementation period is not necessary to improve the nutritional properties of meat but that 75 days of linseed supplementation is sufficient to obtain beef enriched with n-3 PUFA and bioactive compounds. Short-term diet administration can be of interest for the meat industry due to an economic sustainability of linseed feeding.
Acknowledgements
This work was supported by the following research project: ‘Protocolli tecnologici e clinici innovative per la produzione di alimneti funzionali (PRO.ALI.FUN)’ funded by MIUR (Rome, Italy).
Declaration of interest
The authors declare that there is no conflict of interest.
Ethics statement
All animal procedures were approved by the Foggia University Institutional Animal Care and Use Committee (protocol number 002-2016) and were conducted under veterinary supervision by specialized personnel.
Software and data repository resources
The data/models regarding the published article are not deposited in any official repository