1. INTRODUCTION
Pigeon navigation, like bird navigation in general, is considered to be a two step process: in the first step, pigeons determine their position with respect to home and derive their home direction as a compass course; in the second step, they use a compass to locate this course (Kramer, Reference Kramer1957; for review see e.g. Wallraff, Reference Wallraff1974; Wiltschko and Wiltschko, Reference Wiltschko and Wiltschko2009). While the compass mechanisms – magnetic compass and sun compass – and their ontogenetic development are already fairly well understood (Wiltschko, Reference Wiltschko1983), there are still numerous open question concerning the ‘map’ step providing birds with their home course. For orientation from unknown distant sites, pigeons are assumed to rely on geophysical gradients that can be extrapolated beyond the range of direct experience (see Wallraff, Reference Wallraff1974 for a detailed discussion); they form the multi-modal ‘gradient map’, with the nature of the factors included still in debate. In the vicinity of the loft, pigeons are supposed to rely on local landmarks (e.g. Graue, Reference Graue1963; Wallraff, Reference Wallraff1974; Wiltschko and Wiltschko, Reference Wiltschko, Wiltschko, Papi and Wallraff1982; Braithwaite, Reference Braithwaite1993; Biro et al., Reference Biro, Guilford, Dell'Omo and Lipp2002, Reference Biro, Meade and Guilford2004).
The information represented in the ‘map’ is specific for the region where the birds live and hence must be learned individually. Young pigeons begin to acquire the respective knowledge during the first months of their life in order to be soon in command of a functioning navigational system: they memorise the distribution of prominent landmarks and familiarise themselves with the course of suitable gradients in their home region. With increasing experience, the ‘map’ system will get more and more accurate. Although there is evidence that the maps continue to be improved and updated later in life (see Grüter and Wiltschko, Reference Grüter and Wiltschko1990), we can safely assume that the early experiences lay the foundation of the ‘maps’ and form the basic rules for the future interpretation of navigational factors. In view of this, the behaviour of young pigeons while they gather the necessary information for establishing their ‘map’ system becomes of special interest.
Earlier studies on ‘map’ learning focussed on questions concerning the nature of the factors included, mostly confining pigeons in aviaries and manipulating their access to potential navigational cues (e.g. Wallraff, Reference Wallraff1966; Baldaccini et al., Reference Baldaccini, Benvenuti, Fiaschi, Ioalè and Papi1974; Ioalè et al., Reference Ioalè, Papi, Fiaschi and Baldaccini1978; Gagliardo et al., Reference Gagliardo, Ioalè, Odetti and Bingman2001 and many others). The factors included in the ‘map’, however, seem to differ between lofts, depending on their regional suitability (see Wiltschko et al., Reference Wiltschko, Wiltschko and Walcott1987). In the present paper, we address a different question, namely the natural flying behaviour of young pigeons during the phase when they must be assumed to establish their ‘map’. Our study is the first attempt to document the young birds' behavioural strategies while they gather the respective information. Rather than monitoring unpredictable spontaneous flights, we released young, inexperienced pigeons away from their loft and recorded their tracks in details with the help of miniaturised GPS recorders. Comparing these tracks with those of adult pigeons that represent a working mature navigational system reveals characteristic differences and thus provides insight in the map building processes.
2. MATERIAL AND METHODS
The experimental releases were performed in summer and fall 2005 and 2006 on sunny days with less than 50% cloud cover.
2.1. Experimental birds
The experimental birds were homing pigeons from our Frankfurt loft (50°08'N, 8°40'E). The juveniles were tested in the year in which they were born. Prior to the recorded releases, they had been regularly set free for exercise flights at the loft and had participated in four or five training flights up to 1·5 km to get accustomed to the experimental procedure, to wearing the harness during flight, to carrying a weight on their back, and to flying alone (see Wiltschko et al., Reference Wiltschko, Schiffner and Siegmund2007). Their experience was thus very limited. They were 19 to 24 weeks old when the experiments started, and 24 to 31 weeks when they ended.
The adult pigeons were at least 2 years old, mostly older. They had received a standard training up to 40 km in all cardinal compass directions in their first year of life and more training in the beginning of each test season. They had homed singly in a varying number of previous experiments, so they can be assumed to have a well-established, mature ‘map’. All had ample experience flying with the GPS recorder.
2.2. Test sites
We used four release sites in the following order:
• Site 1, City Park (3·19 km from the loft; home direction 257°), a park with lawns, bushes and trees within the city of Frankfurt, surrounded by medium high buildings.
• Site 2, Eschborn (6·34 km, 120°), an open field adjacent to an old village and a suburban area.
• Site 3, Goetheturm (5·52 km; 316°), an observation tower at the edge of an extended forest (used only in 2005).
• Site 4, Hochstadt (13·51 km; 246°), open fields in the rural area north east of Frankfurt, with a distant forest in the north-west.
From all four sites, pigeons had a clear view to the telephone tower 1 km NNW of the loft and the skyline of the banking district of Frankfurt with its high buildings about 1·5 km to the SSE of the loft; at the last three sites, the home direction lay between them. The loft itself lies in a park next to the Institution building.
The young pigeons were unfamiliar with the test sites and had not been released near these sites before. Some of them were released at Site 2 a second time shortly after their first flight. The adult pigeons, because of their extended flying experience, must be assumed to be familiar with the entire home region and may have crossed the sites previously when returning from training or test releases; they had not been released at these specific sites before, however.
2.3. Experimental procedure
The flight recorders consisted of a GPS receiver, a data logger and a Y-shaped antenna; their weight including the battery was about 23 g. A positional fix was taken every second during the operation time of about 3 hours. The recorders were fixed on the pigeons' back with the help of a harness made from Teflon tape (see Wiltschko et al., Reference Wiltschko, Schiffner and Siegmund2007, Schiffner and Wiltschko, Reference Schiffner and Wiltschko2009 for details).
Before release, the GPS recorder was equipped with the battery, wrapped in plastic foil and was attached to the pigeon's back. The pigeon was then released singly by hand. Pigeons were set free at 5 minute intervals to ensure that the previously released birds had already left the vicinity of the release point. At the loft, the flight recorder was recovered and the track data were downloaded from the logger onto a computer.
Some of the birds landed and later restarted their flight, leading to incomplete tracks if they returned after the battery had run empty. In some cases, the flight recorder temporarily lost contact with the satellites, leading to data loss at the beginning or during the flight. This was particularly the case at Site 3, where because of problems with satellite reception only a few tracks from young birds could be recorded.
2.4. Track analysis
The tracks of the pigeons were analysed in view of several parameters. To characterise the directional behaviour at the beginning of the flight, we determined the virtual bearings 2·5 km from the release point, i.e. the direction of the pigeons as seen from the release point, corresponding to the traditional vanishing bearings. Here we included all tracks that crossed the 2·5 km radius from the release point. For these circularly distributed data sets, we calculated mean vectors and tested them with the Rayleigh test for directional preference (Batschelet, Reference Batschelet1981). Significant deviations from the true home course indicating release site biases (Keeton, Reference Keeton1973) were determined with the help of the confidence interval. The data of young and adult birds were compared using the Watson Williams test (Batschelet, Reference Batschelet1981). The procedure for further analysis of directional behaviour is given in the Annex, section A1.
To characterise the general pattern of flight, we determined:
1. The ‘Point of Decision’. This point is based on the following variables: cumulative velocity, defined as the current distance from the release point divided by the time that had passed since release, steadiness, defined as the vector length of headings over a period of 60 s, calculated as a sliding mean every 15 s, and their changes over time, with the highest increase in steadiness marking the point of decision (see Schiffner and Wiltschko, Reference Schiffner and Wiltschko2009 and section A2 of the annex for details). The tracks of the young pigeons proved rather complex, however, as they included several phases of increasing and decreasing cumulative velocity and steadiness so that they split up in departing phases where the birds flew away from the release point, and intermittent phases where they did not increase the distance from the release point, often turning back (see Table A1 and Figure A1 in Annex). The highest increase in steadiness was determined for the first departing phase to obtain a ‘point of decision’, and the intervals till that moment in young and in adult birds were compared using the Mann Whitney U-test.
2. The overall efficiency of flight. This is defined as the beeline distance between release site and the border of the loft area (defined as a 100 m radius around the loft) divided by the actual length of the route. Its reciprocal value indicates the distance covered in comparison to the beeline distance. This variable was calculated only for complete tracks with less then 10% signal loss. Data from young and adult pigeons were compared using the Mann Whitney U-test.
3. The maximum distance from the release point. This point was determined for birds that had crossed the circle centred around the release point through the loft. The median distance exceeding this circle is indicated.
3. R E S U L T S
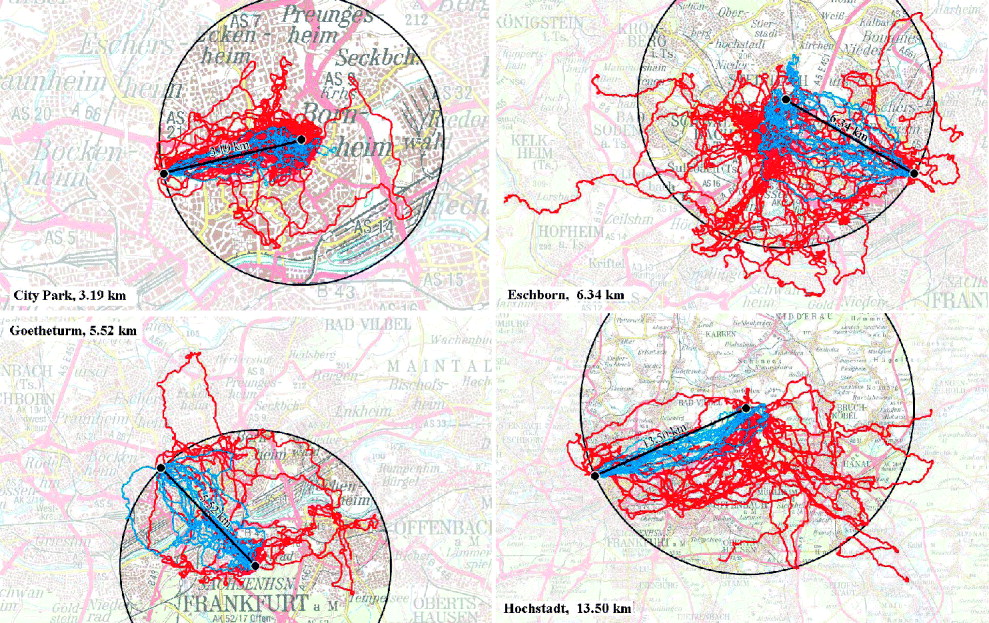
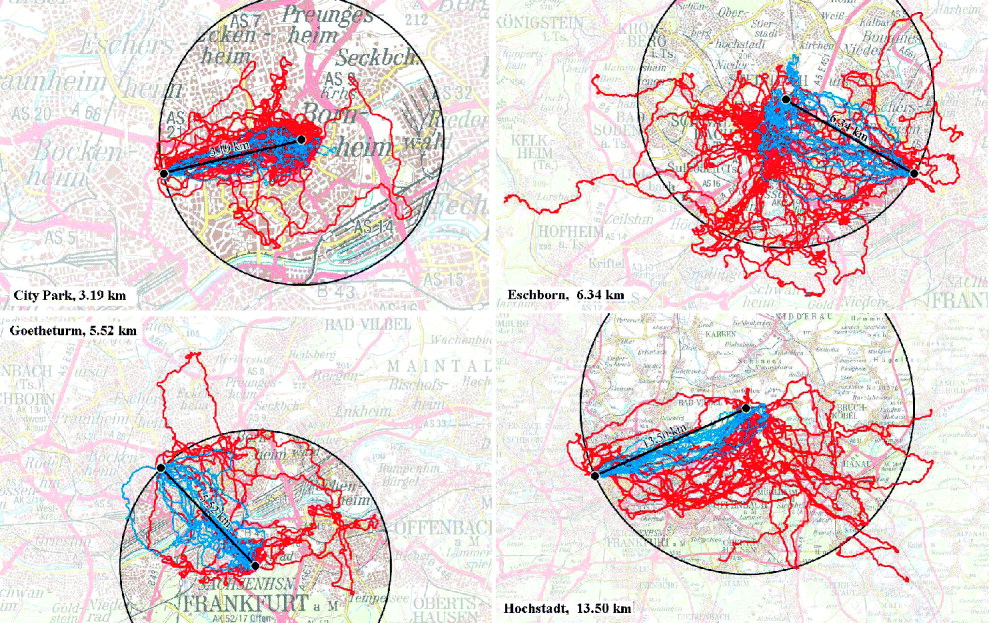
We obtained 159 evaluable tracks, 97 from young and 62 from adult pigeons. 53 of them (45 from young birds and 8 from adult birds) were incomplete because of technical problems or because the bird returned only after the battery had run empty. The tracks from the four sites are shown in Figure 1. Differences between those of adult and young birds are evident.
Tracks of pigeons: blue, adult birds; red, young birds. The radius around the release point through the loft is indicated by the black circle; the direct route from the release point to the loft is the black line indicating the distance. The release site the black dot in the centre of the circle, and the home loft the black dot on the circle. (Top left) Tracks from Site 1, City Park, (top right) tracks from Site 2, Eschborn, (bottom left) tracks from Site 3, Goetheturm, (bottom right) tracks from Site 4, Hochstadt. Note the different scales!
3.1. Directional behaviour
The young birds did not leave the release sites randomly; their routes concentrate in a semicircle. Only at Site 1, the closest site, is this semicircle centred around the home direction; at Site 2 in the north-west and Site 4 in the north-east, it is the southern semicircle, while at Site 3, it is the northern semicircle, with the home direction asymmetrically close to one side (see Figure 1).
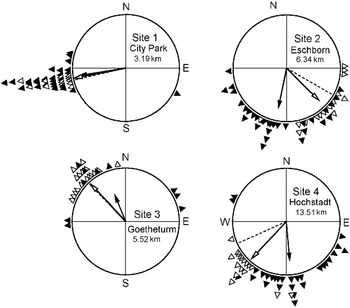
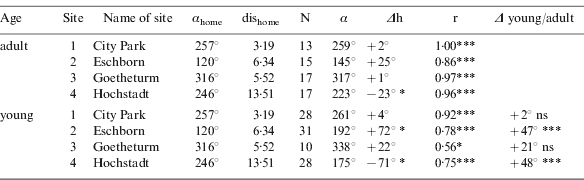
The virtual bearings 2·5 km from the release point were significantly oriented in all groups (Table 1 and Figure 2). Those of the adult pigeons are mostly in the home direction. The young birds, although oriented, show considerably more variance between individuals, as reflected by their shorter vectors. They are homeward oriented only at Site 1, where 2·5 km is about 75% of the home distance. At the other sites, they deviate markedly from the true home course. At Site 2 and Site 4, with more than 70°, these deviations are highly significant (p<0·01, confidence interval) indicating a pronounced release site bias towards south. The bearings of the young birds differ significantly from the corresponding ones of the adult birds (p<0·001, Watson Williams test; see Table 1). Further analyses of the directional behaviour at the beginning of the flight are in the Annex section A1.
Virtual bearings 2·5 km from the release point. The home direction is marked by a dashed radius. The triangles at the periphery mark the bearings of individual pigeons, the arrows represent the mean vector proportional to the radius of the circle=1. Open symbols, bearings of adult pigeons; solid symbols, those of young pigeons.

Directional orientation 2·5 km from the release point.
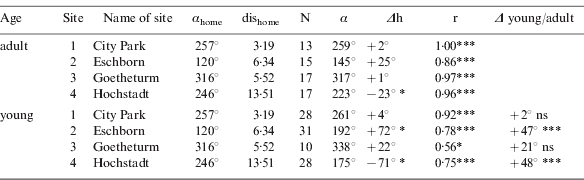
The columns αhome and dishome give the home direction and distance (in km); N, number of tracks; α, mean direction, Δh, deviation from the home direction, with positive signs indicating clockwise, negative signs counterclockwise deviations; asterisks at Δh mark significant deviations. r, vector lengths, with asterisks at r indicating a significant directional preference by the Rayleigh test. The last column gives the differences between the mean of the young and the adult birds, with+indicating that the young birds are farther from the home course, and asterisks indicating significance of these differences. Significance levels:
*** p <0·001; **, p <0·01; *, p <0·05; ns, not significant.
3.2. General flight pattern
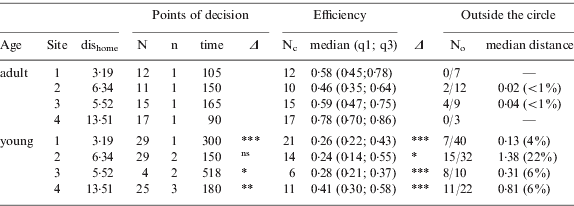
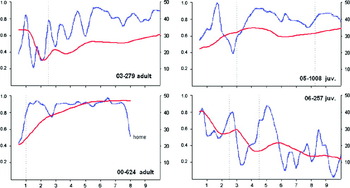
The flight paths of the adult pigeons, in good agreement with previous observations (Schiffner and Wiltschko, Reference Schiffner and Wiltschko2009), usually start with an initial phase of flying around with low steadiness and headings in different directions, followed by the departure phase of increasing cumulative velocity, higher steadiness and flying speed headings close to the home direction (see Table A3 in the Annex, section A2), with the ‘point of decision’ marking the transition between the two phases (see Figure A1a, b in the Annex for typical examples). The medians of the moments of decision lie between 90 and 165 s after release (Table 2).
Structure of tracks.
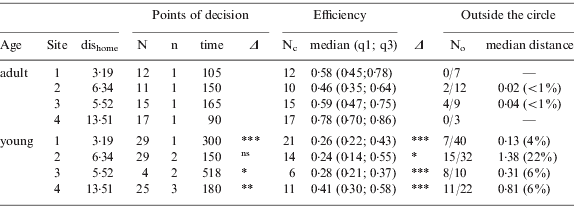
dishome, distance (in km) to the loft (note that the track ends when the pigeon enters the loft area with radius of 100 m around the loft!). Point of decision (see Schiffner and Wiltschko Reference Schiffner and Wiltschko2009): N, number of tracks included in the analysis; n, median number of points of decision within these tracks; time, median time to reach the first point of decision in s. N c, number of complete tracks for which efficiency could be determined. (q1, q3), first and third quartile. N o, number of birds that crossed the circles around the release point through the loft/number of birds that flew at least 150% of the direct distance; with median distance indicates the median distance beyond the circle in km and, in parentheses, in percentage of the direct distance. Asterisks in the column Δ indicate significant differences between young and adult pigeons. Significance levels as in Table 1.
The tracks of young pigeons show a different pattern: we still can define ‘points of decision’, followed by a phase of increased steadiness and higher flying speed, but the headings are not necessarily homeward oriented (see Table A3 in Annex section A2). Also, the vast majority of young birds did not stick to their first decision. After an interval that varies greatly between individuals, the cumulative velocity decreases again, which means that the birds turned back to the release site, flew tangentially or circled around, followed by another increase in cumulative velocity etc. The new increase in cumulative velocity is often, but not always, associated with a marked change in heading. The number of such departing phases seem to increase with increasing distance, up to a maximum of seven (Table 2; see Figure A1 in the Annex for typical examples). With medians between 150 and 300 s, the time until the first point of decision in young birds is longer than the corresponding time in adult birds, with the difference being significant at Site 1, Site 3 and Site 4 (see Table 2).
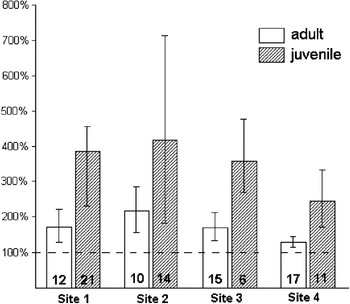
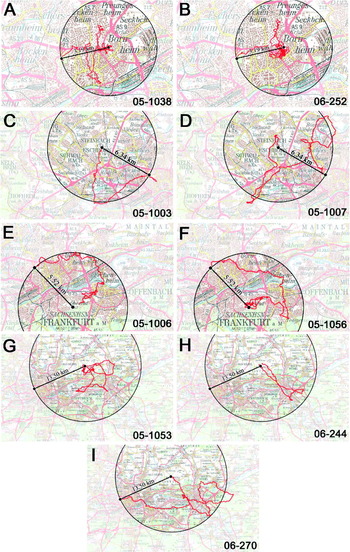
This flying with changing headings is also reflected in the markedly greater lengths of the tracks. While the adult birds, with few exceptions, chose more or less direct routes, most routes of the young birds meandered around, with efficiencies significantly lower than those of the adult birds (Table 2). The young birds fly, on average, up to 410% of the direct distance when homing from the first three sites, and about 240% when returning from the most distant Site 4 (Figure 3). Individual birds (Figure 4) flew much longer routes, up to 10 times the direct distance, with one individual flying 88 km from Site 4 (see Figure 4 A, D, H as examples for very long flights).
Medians of the total lengths of the routes of pigeons as percentage of the direct distance. Open columns, adult birds; solid columns, young birds; the markings indicate quartile 1 and 3. The dashed horizontal line marks the length of the direct distance; the number at the bottom of the columns indicates the number of tracks involved.

Tracks of individual young pigeons. The circle has the release point as its centre and crosses through the home loft; the direct route release point-home is indicated as a black radius, with the distance indicated. Note the different scales!

Most of the young pigeons' tracks fall into an area limited by a circle with the radius of the direct distance release point – home (Figure 1; see also Figures 4C–E), with the maximum distance from the release site rarely exceeding this distance. Also, many birds hesitate and become less steady when they reach the circle (see also Figure A2 in Annex section A3). Only a few tracks cross this virtual border (Table 2), and those that do so mostly turn back soon and re-enter that area, often roughly following the virtual border until they reach home. This is even true for birds that fly more than five times the direct distance (see Figure 4E, F and H for examples). Birds starting to one side of the line ‘release point – home’ usually stay on that side; they may approach this line, but they mostly do not undertake extended flights to the other side (for exceptions, see Figure 4D). Also, some birds that undertake longer flights in directions outside the homeward quadrant show a tendency to return to the release site (for examples, see Figure 4 B, D, G and H).
3.3. Second flight from site 2, Eschborn
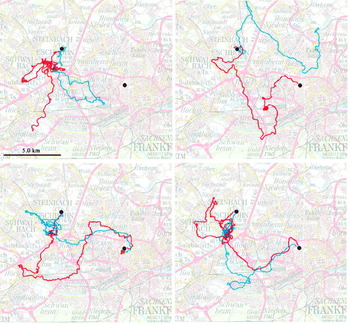
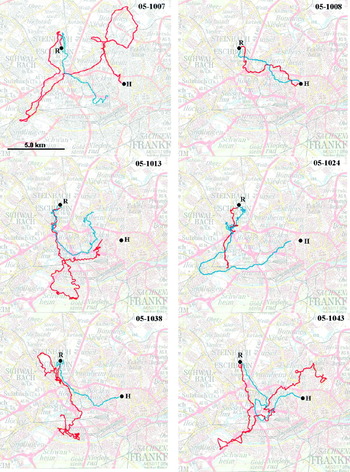
At Site 2, ten young pigeons were released a second time; a comparison of the two tracks is given in Figure 5 (for the remaining tracks, see Figure A3 in Annex section A4). Their mean after 2·5 km still lies south of the home direction, and with 55°, the deviation became only slightly smaller. The median efficiency increased from 0·15 to 0·46, with the three birds that produced two complete tracks being more efficient on their second flight, although in two of them this increase is small. What was striking, however, is the observation that the second flights were mostly not closely related to the first ones – birds frequently flew excursions and loops in different directions and areas (see Figure 5).
Comparing the 1st and 2nd flight of the same individuals from Site 2. The first (red) and the second (blue) track of four young pigeon are given as examples. Release site (R) and home loft (H) are marked with a black dot (for the remaining birds, see Annex, section A4 Figure A2).

4. DISCUSSION
Our data confirm observations from traditional pigeon releases where the birds were observed with binoculars until they vanished from sight: young pigeons need more time to depart and to reach home than adult ones. Hesitating to leave the release site can in part be attributed to their not yet being familiar with the release procedure, which may have caused some initial confusion. The traditionally observed longer homing times are reflected by the longer routes which are now visibly documented by the tracks. What is surprising, however, is the lengths of the distances some of the young birds covered: some individuals flew more than 40 or 60 additional kilometres when returning over distances of just 6·3 and 13·5 km. Other intriguing features that characterise the behaviour of young pigeons become evident:
• Their routes are not randomly distributed; they leave the release site in a significantly oriented way, yet they often show large deviations from the true home course.
• Their tracks include a larger number of segments, mostly heading in different directions.
• Even birds that fly long routes exceeding the direct distance to home more than four or five times rarely venture farther away from the release site than the direct distance ‘release point – home’.
Although there is a lot of variability between individuals and their behaviour is in no way ‘standardised’, some common features emerge and allow a cautious interpretation of our observations that will be discussed below.
4.1. Initial orientation in view of prominent landmarks
Individual young pigeons chose a wide variety of routes, but their significant orientation after 2·5 km suggests that they had at least some idea about the position of their whereabouts with respect to their loft. Only at Site 1 did the young pigeons produce a homeward-directed vector; here, 2·5 km meant that they were already close to home. Site 1 lies within the area where adult pigeons generally rely on landmarks; the estimated size of this area lies in the range of 7 to 10 km (see Michener and Walcott, Reference Michener and Walcott1967; Braithwaite, Reference Braithwaite1993). Even the young pigeons were probably familiar with the landmarks only 3·2 km from the loft.
At Site 2 and Site 4, however, the young pigeons showed marked deviations from the home direction towards south. At Site 2, the first part of the tracks converge in the old village where many young birds circled around for a while, but the majority of them left the village still heading south; see Figure 1 (top right). Such ‘release site biases’ have been assumed to indicate the use of a gradient ‘map’, with the deviations caused by misinterpreting the local navigational factors (see Keeton, Reference Keeton1973; W. Wiltschko and Wiltschko, Reference Wiltschko, Wiltschko, Papi and Wallraff1982). In view of this, pronounced biases would suggest that the young pigeons were already using their navigational ‘map’, but that this ‘map’ was still very rudimentary because of their limited experience. Adult pigeons also deviate to the south at Site 2 and Site 4, but their deviations are much smaller – obviously, adult birds can cope with irregularities in local ‘map’ factors much better.
The large deviations of young pigeons so close to home are also remarkable for another reason: the telephone tower and skyline of the banking district were clearly visible, not far from the home direction. The birds should have known the position of their loft with respect to these conspicuous buildings from their daily exercise flights, and it is very surprising that such landmarks, very prominent for human observers, seem to have very little directing influence on the young pigeons' orientation. They do not act as ‘beacons’, attracting the pigeons in the home direction; instead they seem to be largely ignored.
4.2. Exploring to gain experience?
The different phases in the tracks of young pigeons, mostly associated with a change in heading, usually add up to twisted paths, with excursions in various areas around the release site and along the route. These phases are highly individual, as are the places where the young birds lingered around – it seems as if these locations mark places of interest for individual birds. Yet there are also places of general attraction, like the old village of Eschborn where conspecifics live and where many pigeons released at Site 2 spend some time flying around (see Figure 1 (top right)). An occasionally observed tendency to head back toward the release point suggests that a considerable amount of the pigeons' activity is centred around the release site, which seems to act as an anchor point in organising the routes.
The extended routes with twists and turns in different directions provide young birds with ample opportunity to familiarise themselves with the local lay of the land. They seem to have taken advantage of the situation of being away from home and use the opportunity to look around and obtain information to further develop their map system, to e.g. record the position of landmarks and to remember the local course of the navigational factors to be included in their map system. This would mean that the long routes of the young pigeons with excursions in various directions reflect exploratory behaviour rather than mere shortcomings of the navigational system. The young birds were motivated to return home, but not necessarily by the shortest route. Instead, they seem to have welcomed the chance to explore the area around the release site and from there to the home loft. An earlier study at more distant sites (Wiltschko, Reference Wiltschko1992) showed that young, inexperienced pigeons that were well aware of their home course as indicated by their homeward oriented vanishing bearings, first ventured in various directions before they finally departed. These flights around the release point were interpreted as explorative behaviour: the birds familiarised themselves with the navigational factor at the site before they left. The observation that the routes chosen on the second flight from the same site mostly show little relation to the first and often venture in other areas also supports a tendency to explore. One young pigeon, returning from Site 2, took off again, flying 1·23 km in south-easterly direction – it looked further around before it finally entered the loft.
4.3. A sense of distance?
Interestingly, young pigeons seldom fly much farther away from the release site than the direct distance ‘release point – home’, while at the same time several of them cover more than five times this distance during their homing flight. This seems to suggest that the young pigeons roughly knew how far they were away from home. A study by Baldaccini et al. (Reference Baldaccini, Benvenuti and Fiaschi1976) indicates that pigeons have a sense for distance, but their pigeons were old, experienced birds with a well-developed map system (see also data by Kiepenheuer, Reference Kiepenheuer, Maret, Boccara and Kiepenheuer1986). The observation that inexperienced pigeons covered larger distances when released farther from their loft than when released closer (Wallraff, Reference Wallraff1970) can also be taken to suggest a sense of distance even in inexperienced birds, although the distances involved were much larger. The nature of this sense of distance is unknown; integrating the route of displacement seems a possibility (Schmidt-Koenig, Reference Schmidt-Koenig1970; Wiltschko and Wiltschko, Reference Wiltschko and Wiltschko1978).
5. CONCLUSION
A certain sense of distance that limits the range of flying to the distance release point – home would help the young pigeons to avoid getting too far off in wrong directions. The same may also be true for two other behavioural tendencies that were observed and can be interpreted as safeguards to help minimise this risk, namely the indicated tendency to explore only either the northern or southern semicircle and the tendency to centre the activity around the release site – both would prevent the young birds from getting too far away from home. With these strategies, the procedure of young pigeons on their early flights appears robust, even tolerating some navigational errors – it includes elements of safety that act against getting lost.
ACKNOWLEDGEMENTS
Our work was supported by the Deutsche Forschungsgemeinschaft (grant to R.W.) and by the Freunde und Förderer der Universität Frankfurt. We thank M. Barzke, C. Bopp, L. Dehe, S. Denzau, A. Kristof, M. Leisegang, C. Nießner, J. Pietzner, R. Sarvananthan, J. Suchland and F. Wicker for their valuable help with conducting the releases. The experiments were performed in accordance with the rules and regulations for animal welfare in Germany.
ANNEX
A1. DIRECTIONAL BEHAVIOUR DURING INITIAL ORIENTATION
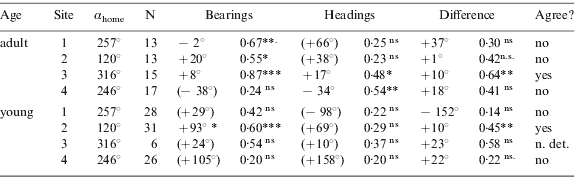
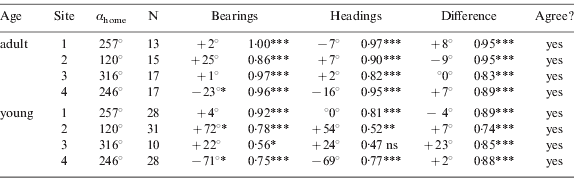
In traditional pigeon releases, bearings, the directions of pigeons as seen from the release point, were recorded with a compass. Recording the tracks offers the opportunity to additionally determine headings, the direction in which the birds are actually flying at a given moment or at any given distance. Headings were calculated over 10 s to avoid chance variations. – In the present study, we therefore determined bearings and headings 1 min after release and when the pigeons crossed the 2·5 km circle around the release site. Bearings and headings 1 min after release reflect the birds' initial decision; they are given in Table A1. While the bearings of adult pigeons are mostly significantly oriented in directions not far from the home direction, those of young pigeons are non-significant, except at Site 2, where the young birds fly towards the old village. The headings of adult birds agree at Site 3 and Site 4, whereas those of the young birds do not add up to a significant vector at any site. Also, bearings and headings seldom agree, indicating erratic flying around.
Bearings and heading 1 min after release'.
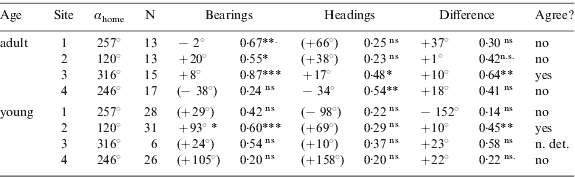
α home, home direction; N, number of tracks analyzed. The columns ‘Bearings’ and ‘Headings’ give the direction and the length of the mean vectors with respect to the home direction, with+indicating clockwise, – a counterclockwise deviation; directions in parentheses indicate non-significant vectors. The column ‘difference’ gives the mean vectors calculated from the angular difference between headings and bearings Asterisks at the directions indicate significant deviations from home (confidence interval), asterisks at the vector lengths indicate significance by the Rayleigh test. Significance levels:
*** P<0·001; **, P<0·01; *, P<0·05; ns not significant. The last column indicates whether bearings and headings agree, i.e. when the differences add up to a significant vector with a mean not different from 0° (n. det.: cannot be determined because of small sample size).
When the birds cross the 2·5 km radius, this is different, because 2·5 km is beyond the ‘point of decision’ in the vast majority of cases and within the homing phase or a departing segment of the track. Bearings and headings are given in Table A2. Adult as well as young birds have significantly oriented bearings, although the vectors of the young birds are shorter at all four sites, and, with the exception of Site 1, their means are farther from the home direction. The same is true for the headings, with the exception of Site 3, where the young birds' headings are not oriented. Bearings and headings now generally agree, indicating that the birds are on their way leaving the release site.
Comparing Bearings and heading 2·5 km from the release point'.
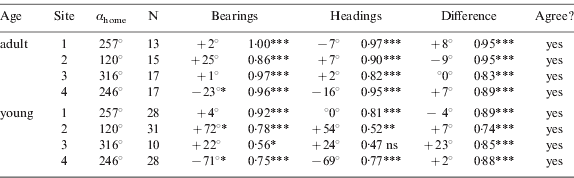
For meaning of symbols, see Table A1.
A2. ANALYZING THE PATTERN OF THE TRACKS
To characterize the structure of tracks, we determined the ‘points of decision’, which separates the first more or less erratic flying around after release point from the flight that leads the pigeon away from the release site. In adult birds, it was found to divide the tracks into two phases: (1) the initial phase and (2) the homing phase where the pigeons fly more or less fast and steady in home direction (see Schiffner and Wiltschko, Reference Schiffner and Wiltschko2009, for details). The tracks of the young pigeons are more complex, with more than one ‘point of decision’ indicated by more than one high increase in steadiness – they consist of several different phases with changing headings. This required a certain modification of the procedure.
We based our analysis on the cumulative velocity, defined as the current distance from the release point divided by the time that had passed after release (see Schiffner and Wiltschko, Reference Schiffner and Wiltschko2009): it increases if the pigeon moves away from the release point and decreases if the distance to the release point does not become larger. In adult birds, this variable was found to be closely correlated with steadiness (defined as the vector length of headings over a period of 60 s, calculated as a sliding mean every 15 s), with the highest increases occurring simultaneously or within a short interval. The temporal course of the cumulative velocity shows periods of increase and periods of decrease of varying length.
We proceeded as follows: Sliding means of the cumulative velocity over 60 seconds were calculated every 15 seconds: then the value of each of these steps was compared with the preceding one. Thus we obtained three different types of steps:
1. steps with increasing cumulative velocity
2. steps with decreasing cumulative velocity
3. steps of no change in cumulative velocity
A phase is defined as consisting of at least five steps of the same type, which means that the pigeon was increasing or decreasing its cumulative velocity over a period of more than 60 seconds. In order to be able to define phases even when the cumulative velocity was very low, yet showed an overall trend, these five steps could be interrupted by steps with no change in cumulative velocity.
Increasing cumulative velocity was normally associated with an increase in steadiness, the latter defined as the vector length of headings over a period of 60 s, calculated as a sliding mean every 15 s (see Schiffner and Wiltschko, Reference Schiffner and Wiltschko2009). The ‘point of decision’ was indicated by the highest increase in steadiness between two consecutive steadiness values 15 s apart within the period showing the highest mean increase of steadiness over 60 s (5 means).
In adult pigeons, we usually found one ‘point of decision’, dividing the track in two segments, the initial phase and the homing phase. In young birds, however, changes in cumulative velocity indicated more than two segments, with more than one ‘point of decision’. That is, after the initial phase, the young birds mostly had several departure phases, interrupted by phases of decreasing or not-changing cumulative velocity. The median number of these ‘points of decision’ is indicated in Table 2 in main text; their number seems to increase with increasing distance.
Examples of the beginning of tracks of both adult and young pigeons, indicating the temporal course of cumulative velocity and steadiness and marking ‘points of decision’ are given in Figure A1.
Examples of tracks of adult pigeons (left) and young pigeons (right) released at Site 2, indicating the cumulative velocity (red line) and the steadiness (blue line), with the points of decisions marked by a dashed vertical line. Abscissa: time after release; left ordinate: scale for steadiness; right ordinate, scale for cumulative velocity.

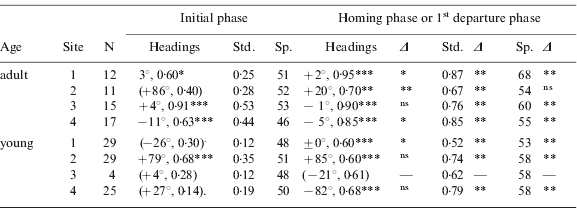
To indicate the change in behaviour occurring at the ‘point of decision’, we compared the mean headings, the average steadiness and the average flying speed before and after this point (for young birds: the first ‘point of decision’), comparing the initial phase with the first departure phase. The respective data are given in Table A3. In adult birds, the headings are mostly homeward oriented already in the initial phase, but there is still an improvement in the homing phase except at Site 3, where they had been excellently homeward oriented right from the beginning. In young birds, there is little agreement in headings during the initial phase except at Site 2, where they headed towards the nearby village. Steadiness and in most cases also flying speed increase significantly at the ‘point of decision’, in adult as well as in young birds.
Change in behaviour at the (first) ‘point of decision’.
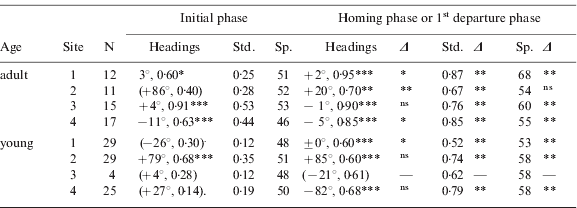
N, number of tracks. The column Headings (see below) gives the mean vector calculated from the birds' headings, with asterisks indicating significance by the Rayleigh test; non-significant vectors are given in parentheses. Std, steadiness; Sp., flying speed in km/h. The columns Δ indicate significant changes in the respective variable after the ‘point of decision’ by the Wilcoxon test (for the young birds at Site 3 the sample size is too small for testing). Significance levels:
*** P<0·001; **, P<0·01; *, P<0·05; n.s., not significant.
A3. STEADINESS OF FLIGHT OF YOUNG PIGEONS AT VARIOUS DISTANCES
In order to indicate characteristics of the young pigeons' flying patterns, we defined segments with a width of 500 m around the release point and determined the average steadiness (defined as the vector length of headings over a period of 60 s, calculated as a sliding mean every 15 s). The area 1 km around the home loft is excluded from this analysis. All tracks from the respective release site are included in this analysis; averages are calculated when at least four pigeons flew in the respective distance segment.
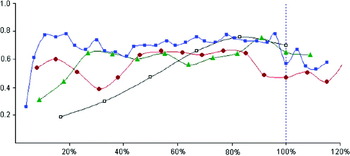
As expected from the analysis of the point of decision, there is an initial increase in steadiness observed at all four sites. At Site 2, this increase is soon interrupted when many of the young birds reached the old village of Eschborn; their flying around over the village lowered the steadiness. After the initial increase, the steadiness mostly remains at a more or less stable level, which is at the distant Site 4 slightly higher than at the other three sites. Individual birds show phases of steady flying interrupted by phases of meandering around, but these flight patterns occur at different distances from the release site so that averaging them leads to the observed intermediate level of steadiness.
One common trend becomes evident, however: more or less shortly before approaching the distance release point–home, steadiness shows subtle decrease with a local minimum at the actual distance release point–home, indicating that a larger number of birds fly unsteadily at this particular distance. Since the area around the loft itself is excluded from this analysis, the observed drop in steadiness is not related to approaching the loft, but characterises a change in behaviour when approaching the distance corresponding to the direct distance release point – home. It thus suggests that the pigeons are somehow aware of the distance they have covered. The decrease in steadiness itself most likely reflects flying to and fro with frequent changes in heading.
Periods of steady and unsteady flying of young. Black open squares: birds returning from Site 1; red dots: birds returning from Site 2; green triangles, birds returning from Site 3; blue squares: birds returning from Site 4. Abscissa: distance to home in %; ordinate: steadiness of the flight for 500 m segments from the release point.

A4. THE 1st AND 2nd FLIGHTS OF THE SAME INDIVIDUALS
The first (red) and the second (blue) track of six individual young pigeons released at Eschborn (for the tracks of the other four birds, see Figure 5 in the main text). Release site (R) and home loft (H) are marked with a black dot.