Introduction
Coastal wetlands are globally recognised as highly productive ecosystems, also providing critical services such as nutrient cycling, flood control, and fisheries (Barbier et al. Reference Barbier, Hacker, Kennedy, Koch, Stier and Silliman2011). However, the mounting pressures of population growth and land-use change have placed these habitats under unprecedented strain (Halpern et al. Reference Halpern, Walbridge, Selkoe, Kappel, Micheli and D’Agrosa2008; Jia et al. Reference Jia, Huang, Deng, Yin, Deng and Hou2024). One particularly transformative force is the rapid expansion of aquaculture, wherein natural wetlands are converted to managed ponds aimed at boosting fish production (Ragavan et al. Reference Ragavan, Kathiresan, Mohan, Ravichandran, Jayaraj and Rana2021). While often economically beneficial, this land-use shift can disrupt hydrological regimes, fragment habitats, and increase nutrient pollution, thereby compromising wetland integrity (Dwarakish and Ganasri Reference Dwarakish and Ganasri2015; Paul et al. Reference Paul, Paul, Sardar, Bid, Paul and Paul2023). The eastern coast of India exemplifies the tension between economic development and environmental sustainability, with widespread aquaculture projects, combined with other human activities such as urban construction and plantation forestry, profoundly altering historically rich coastal landscapes (Paul et al. Reference Paul, Paul, Sardar, Bid, Paul and Paul2023; Ragavan et al. Reference Ragavan, Kathiresan, Mohan, Ravichandran, Jayaraj and Rana2021).
From a conservation perspective, these changes can have profound consequences for apex predators, which frequently serve as indicators of habitat quality (Butet et al. Reference Butet, Rantier and Bergerot2022; Demerdzhiev et al. Reference Demerdzhiev, Dobrev, Popgeorgiev and Stoychev2022). Raptors, in particular, are known for their large home ranges and specific resource requirements, making them sensitive to fluctuations in prey availability and habitat structure (Cruz et al. Reference Cruz, Santulli-Sanzo and Ceballos2021; Tapia and Zuberogoitia Reference Tapia, Zuberogoitia, Sarasola, Grande and Negro2018). Yet, the response of these predators to human-modified wetlands can be highly variable. On one hand, some raptors demonstrate adaptability by incorporating anthropogenic resources into their diets, especially when natural prey is scarce (Lieber et al. Reference Lieber, Nimmo-Smith, Waggitt and Kregting2019; Mak et al. Reference Mak, Drewitt, Francis and Chadwick2023). On the other hand, many species encounter barriers, such as netting, fencing, and disturbance, that reduce successful foraging and can impede nesting or perching opportunities (Widén Reference Widén1994). Indeed, several studies suggest that raptor reliance on aquaculture or other anthropogenic food sources varies considerably across regions, with outcomes ranging from increased preference for human supplementation to complete avoidance (Potter et al. Reference Potter, Stannard, Greenville and Dickman2018; van Donk et al. Reference van Donk, Shamoun-Baranes, van der Meer and Camphuysen2019).
White-bellied Sea-Eagle Haliaeetus leucogaster (hereafter WBSE) can be one model species which provides a compelling lens, through which the above described dynamics can be examined. Widely distributed across coastal South-East Asia and Australia, this large, primarily piscivorous raptor typically nests near water-bodies and thus relies heavily on fish availability (Debus Reference Debus2008; Olsen et al. Reference Olsen, Debus, Rose and Judge2013). Rapid aquaculture expansion in India’s eastern coastal belt raises essential questions about how this apex predator adapts in a patchwork landscape of fish farms, urban areas, and residual natural wetlands. While some raptors can exploit man-made water-bodies or scavenge from anthropogenic sources, WBSE ecology suggests a relatively specialised foraging mode that might be better suited for intact aquatic habitats offering diverse, easily accessible prey (Azman et al. Reference Azman, Zainudin, Sah and Latip2013). In cases where aquaculture ponds are intensively managed, the increased human presence and protective infrastructure could undermine WBSE foraging success and pose additional energetic or safety risks.
In light of these circumstances, we hypothesised that WBSEs would maintain a preference for natural water-bodies over aquaculture ponds, influenced by factors such as greater prey diversity, lessened anthropogenic disturbance, and more appropriate perching locations. To test this hypothesis, our study attempted to: (1) quantify the relative contributions of fish, birds, reptiles, invertebrates, and mammals in WBSE diets, and (2) determine whether WBSEs acquire most of their fish prey from aquaculture or from natural aquatic habitats. We combined systematic sampling of prey remains with spatial analyses of landscape variables to evaluate how coastal modification affects WBSE foraging. By showing how apex predators interact with their environment, our results suggest ways to balance aquaculture’s economic advantages with the health of coastal wetlands. These insights can support conservation strategies that protect apex predators and maintain the vital ecological services these habitats provide.
Methods
Study area
Located on the eastern coast of Odisha, India, our study area spanned approximately 3,163 km² and primarily encompassed anthropogenically influenced suburban and rural areas in the Ganjam and Puri districts (Figure 1). This 125 km coastal stretch bordering the Bay of Bengal boasts a unique biogeographical condition heavily influenced by human activities. The landscape is a mosaic of natural ecosystems and human-altered environments, resulting in diverse habitats including urban areas, mixed deciduous forests, open woodlands, lakes, and estuaries. Such an intricate array of ecosystems creates ideal conditions for WBSEs as numerous water-bodies in the region sustain a wide array of fish species essential for their diet. The region experiences a subtropical monsoon climate, with annual precipitation ranging from 1,337 mm to 1,444 mm and temperatures fluctuating between 12°C and 39°C. In response to frequent cyclonic events, extensive Casuarina plantations have been established along the coastline as bio shields (Pattnayak and Prusty Reference Pattnayak and Prusty2022). Furthermore, the vegetation composition mirrors both the natural characteristics of the Eastern Ghats and anthropogenic changes, evident in the Casuarina plantations and gradual urbanisation of previously untouched areas. Aquaculture in Chilika Lake has expanded significantly, primarily through the conversion of agricultural land into aquaculture ponds. This shift has led to salinisation and pollution of surrounding farmlands, reducing crop yields, and rendering the soil unsuitable for traditional agriculture (Mohanty et al. Reference Mohanty, Mohapatra, Mohanty, Mishra, Khan and Pattnaik2015). The expansion of aquaculture ponds presents new concerns, potentially affecting the supply of natural prey for WBSEs by disturbing freshwater ecosystems and modifying fish population.
Study area along the eastern coast of India, highlighting nest locations and classified land cover types.

Dietary data collection
From 2021 to 2024 (three breeding seasons, October–May), we conducted extensive collection of available prey remains from 22 nesting sites of WBSEs and their respective roosts. The samples included prey items located underneath nests and, in some instances, within the nests as well as from roosting sites, including telecommunication towers and dead trees used by breeding pairs. We employed the methodology outlined by Olsen et al. (Reference Olsen, Debus, Rose and Judge2013) and systematically gathered prey remains and pellets from the ground beneath nests, within nests, and adjacent roosting structures. To minimise disturbance to WBSEs, our sampling was strategically timed to align with specific stages, such as after-fledging and post-failure periods (Debus Reference Debus2008). Subsequently, all samples were meticulously labelled on-site following Corbett and Hertog (Reference Corbett and Hertog2011). In the laboratory, we conducted meticulous counting and thorough identification of samples. Based on existing literature, we categorised WBSE prey item samples into five major groups: invertebrates, fish, reptiles, birds, and mammals (Corbett and Hertog Reference Corbett and Hertog2011; Olsen et al. Reference Olsen, Debus, Rose and Judge2013). Prey items were identified with meticulous attention to detail, employing unique physical traits specific to each category. Invertebrates were identified by their shells, fish by their bones, reptiles by scales and skeletal remains, birds by their feathers and bones, and mammals by their fur remnants. To achieve accurate quantification and prevent duplicate counting, we employed the Minimum Number of Individuals (MNI) method (Olsen et al. Reference Olsen, Debus, Rose and Judge2013). With MNI, we looked for the most regularly repeated diagnostic piece within each prey category, such as a specific bone or shell fragment. Whichever element shows up most often informs us of the lowest feasible number of separate individuals we must have had. For instance, if we located 12 similar fish vertebrae, we required at least 12 different fish (MNI) to explain those remains.
Landscape variable selection and measurement
WBSEs demonstrate exceptional nest-site fidelity, a characteristic similar to that of its close relatives, White-tailed Eagles Haliaeetus albicilla and Bald Eagles H. leucocephalus, consistently using the same breeding territory across breeding seasons (Azman et al. Reference Azman, Zainudin, Sah and Latip2013). WBSE territory sizes exhibit substantial geographical variation, primarily driven by resource availability. According to previously documented home range sizes (13.9–219.6 km²; Gunawan et al. Reference Gunawan, Purwanto and Khaleghizadeh2015; Wiersma and Richardson Reference Wiersma and Richardson2009), we treated the nest as the centre of the territory and considered the home range as a perfect circle. Under this assumption, the largest recorded home range of 219.6 km² corresponds to a circle with a radius of approximately 8.40 km. This maximum radius was then used as our standard measure for analysing land-cover proportions across all study sites, ensuring consistent spatial coverage for comparing habitat characteristics within WBSE territories.
To further examine how proximity to natural waterbodies and aquaculture influences WBSE foraging, we classified nesting sites into three equal-interval distance bands: 0–800 m, 800–1,600 m, and >1,600 m, from the nearest aquaculture facility. This subdivision reflects existing evidence that the smallest WBSE territory radius is approximately 2.1 km (∼13.9 km²; Gunawan et al. Reference Gunawan, Purwanto and Khaleghizadeh2015), thus fully encompassing the lower boundary of known foraging distances. Moreover, our observed mean distance to aquaculture (1,320 ± 1,271 m) falls within the middle band, facilitating a balanced comparison among “near”, “mid”, and “far” site categories.
To characterise the landscape variables within the buffers, we created a detailed land-use and land-cover map using sentinel-2 imagery with a 10 m × 10 m resolution. We classified the landscape into six land-cover classes: water-body, water vegetation/flooded vegetation, vegetation, built-up area, agricultural land, and range land, using ArcMap 10.8 (Figure 1). We calculated the proportion of water and vegetation within an 8.4 km radius of each nest using land-cover maps. Additionally, we measured the distances from each nest to the nearest water-body, aquaculture facility, and coastline using Google Earth Pro (Table 1). Specifically, when determining the distance to the nearest water-body, our analysis exclusively considered natural water-bodies such as lakes, rivers, and ponds. We explicitly excluded aquaculture farms from being considered as the nearest water-body in this variable. In certain instances, the coastline emerged as the closest water-body relative to inland water-bodies. Consequently, for these specific cases, the distance to the coast was used as a measure of proximity to the nearest water-body. To determine the number of aquaculture farms around each nest, we employed a grid-based counting method. We created a circle with an 8.4 km radius around each nest in Google Earth Pro and overlaid a grid on to this area. Within this grid, we counted all aquaculture farms that fell inside the circle manually. We only counted an aquaculture farm if it was located entirely or more than 50% of an aquaculture farm within the 8.4 km radius circle around the nest.
Landscape variables used to analyse the WBSE diet, including their units, expected effect directions (anticipated relationship between the variable and proportion of fish in the diet, positive effect direction = positive correlation), and data sources

Data analysis
Before conducting our analysis, we meticulously pre-processed the data. This involved assessing multicollinearity and normalising the variables. Given that our variables, i.e. landscape metrics, distance measurements, and number of aquacultures, had different units and scales, we applied min–max normalisation to standardise all continuous variables to a range between 0 and 1 (Ghaffari and Devos Reference Ghaffari and Devos2024). We used the following formula for normalisation:
 $$ X^{\prime }=\frac{\mathrm{X}-\min \left(\mathrm{X}\right)}{\max (X)-\min (X)} $$
where X represents the original value of a variable, min (X) and max (X) are the minimum and maximum values of the variable, respectively, and X’ is the normalised value. After normalising the variables, we assessed multicollinearity among the predictor variables using Variance Inflation Factors (VIFs). To prevent redundancy and improve model accuracy, we excluded variables with VIF values greater than 5 from further analysis (Akinwande et al. Reference Akinwande, Dikko and Samson2015).
To analyse the diet data for the WBSE, we divided the prey proportions into two parts: proportion of fish and the proportion excluding fish (includes birds, reptiles, mammals, and invertebrates). To explore the relationships between landscape factors and the dietary composition of WBSE, we modelled both fish proportion and non-fish proportion within the diet. Recognising the possibility that these relationships might be nonlinear, we then fitted generalised additive models (GAMs) using the mgcv package with beta-family distributions (Wood Reference Wood2017). After establishing both beta regression and GAM frameworks for the fish and non-fish proportions, we employed the “predict” function to generate predicted values from our fitted GAMs. All statistical analysis and visualisations were performed using R version 4.3.2 (R Core Team 2023).
Results
Fish dominance in the diet of the WBSE
A total of 3,319 prey items were recorded in the diet of the WBSEs across the 22 nests in the study area over three breeding seasons. Fish constituted the highest of the prey items at 66.89%. Birds accounted for 25.64%, while reptiles made up 3.31%. Similarly, invertebrates comprised 3.16%, and mammals were the least represented at 0.99%. The number of aquaculture farms was 734.82 ± 697.70. While the distance to aquaculture facilities averaged 1,320.00 ± 1,271.17 m, the distance to the coast was 3,326.12 ± 3,594.97 m. The distance to the nearest water-body was 654.00 ± 667.81 m, and the water-bodies covered a mean of 57.00 ± 17.25% of the analysed area, while vegetation covered 10.00 ± 5.85%.
Natural water-bodies as key drivers of fish proportions in the diet
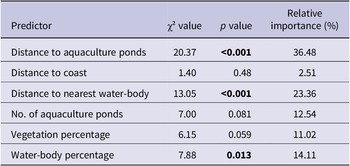
We employed GAMs to assess the landscape features that influenced fish and non-fish prey proportions in the WBSE’s diet. The GAMs accounted for 94.97% of deviance in non-fish proportions and 94.93% in fish proportions. In the GAM predicting fish proportions (Table 2), three of the six predictors emerged as significant. Distance to aquaculture had the highest impact (χ² = 20.37, P <0.001; relative importance = 36.48%), followed by distance to the nearest water-body (χ² = 13.05, P <0.001; 23.36%) and water-body percentage (χ² = 7.88, P = 0.013; 14.11%). As shown by the partial effect curves (Figure 2), closer proximity to natural water-bodies and greater water-body coverage were linked to a higher predicted proportion of fish prey. Although distance to aquaculture ranked first in relative importance, its positive influence on fish consumption suggests that fish consumption increases when the distance to the aquaculture farm increases. Instead, natural aquatic bodies, such as closer water-bodies and higher water-body coverage, demonstrated a much stronger positive influence on fish proportions, since nests situated closer to natural water-bodies with greater water-body coverage consistently showed higher proportions of fish in the diet.
Significance and relative importance of landscape predictors in the generalised additive model (GAM) for fish proportions, showing the chi-square statistic (χ²), P value, and percentage contribution of each variable

Predicted partial effects of six landscape variables (min–max normalised) on the proportion of fish in the WBSE diet, as estimated by generalised additive model (GAMs). Distance to aquaculture ponds, distance to the nearest water-body, and water-body percentage were identified as the only significant predictors of fish proportions. Shaded areas represent 95% confidence intervals.

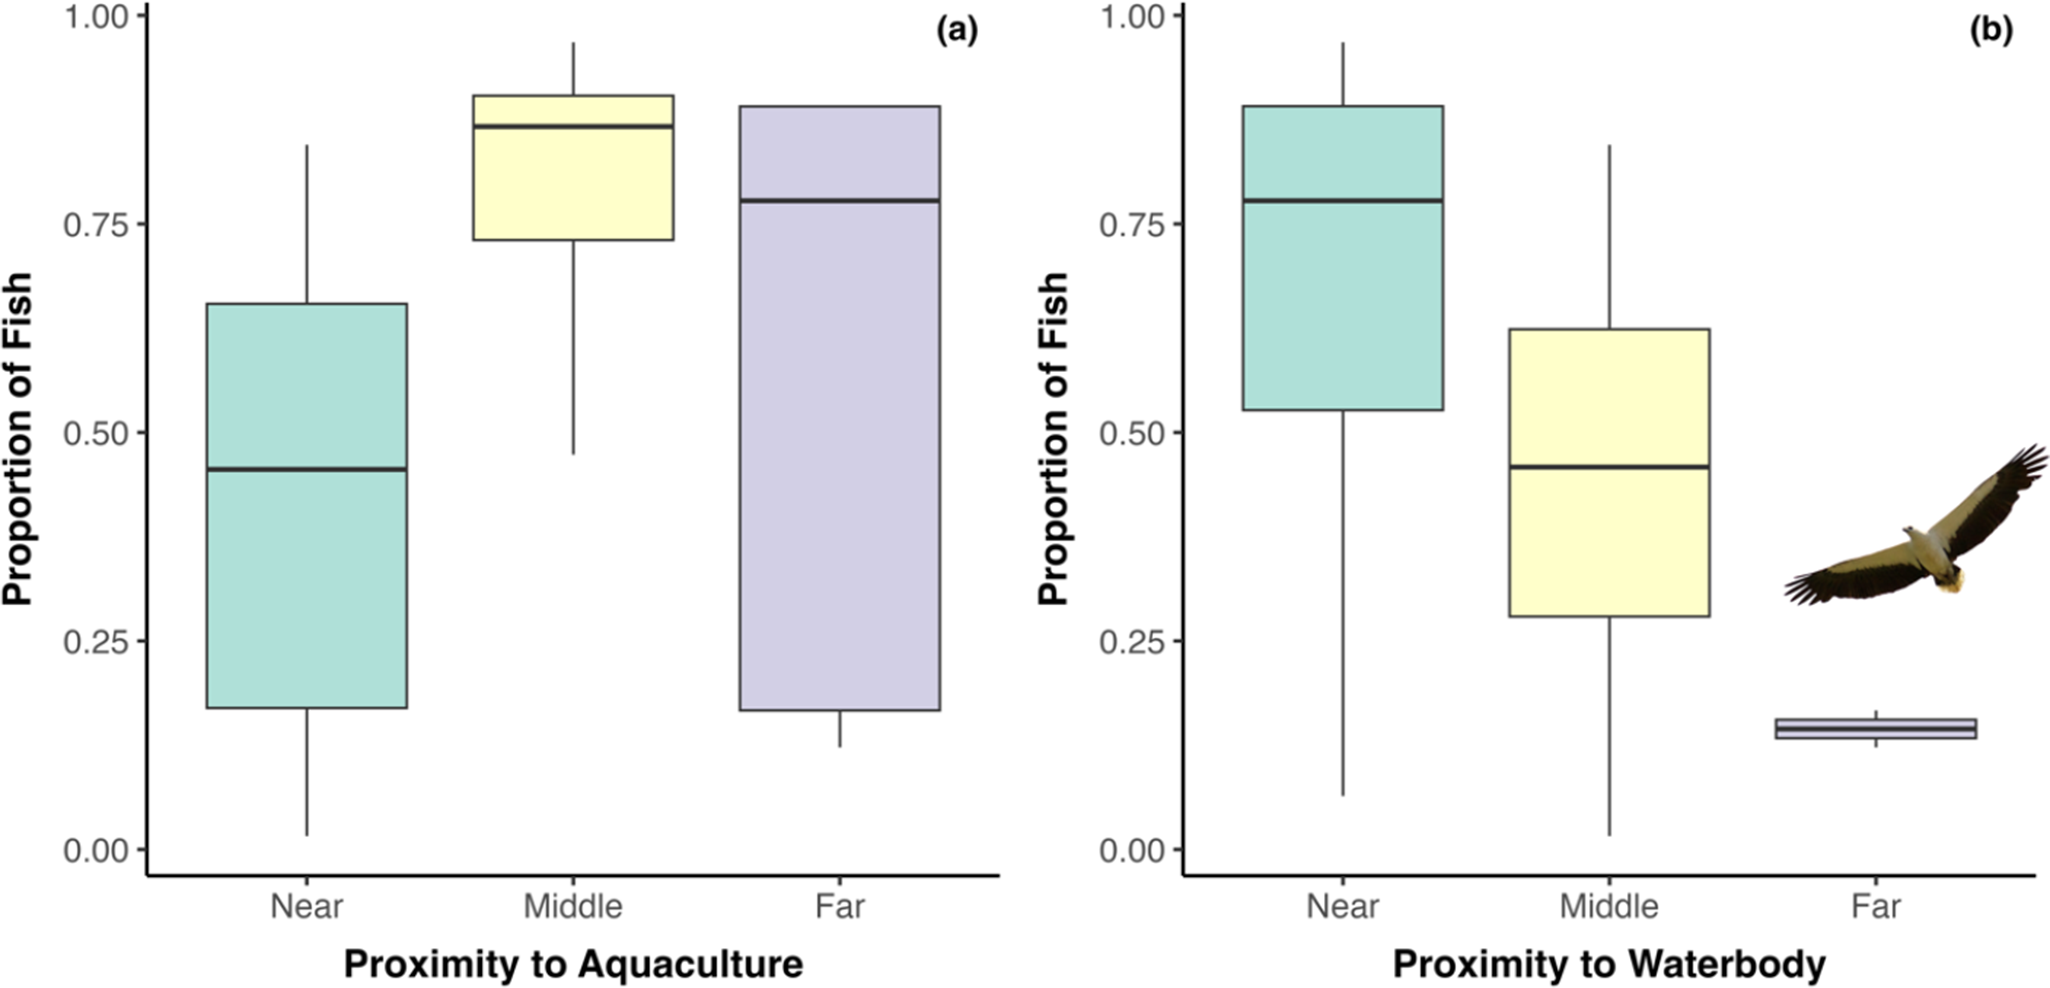
A similar pattern emerged in the GAM for non-fish proportions. Once again, three of the six predictors significantly explained variation in non-fish consumption, with distance to aquaculture (χ² = 20.57, P <0.001; 36.56%) remaining the top contributor. Distance to the nearest water-body (χ² = 13.13, P <0.001; 23.33%), and water-body percentage (χ² = 7.94, P = 0.012; 14.12%) also played major roles (Table 3), indicating that locations more distant from water-bodies or with reduced water-body coverage tended to have higher proportions of non-fish prey (Figure 3). Moreover, nests closer to aquaculture tended to exhibit lower fish proportions than those situated at middle or far distances, whereas proximity to natural water-bodies was associated with consistently higher fish consumption (Figure 4).
Significance and relative importance of landscape predictors in the generalised additive model (GAM) for non-fish proportions, showing the chi-square statistic (χ²), P value, and percentage contribution of each variable

Predicted partial effects of six landscape variables (min–max normalised) on the proportion of diet except fish in the WBSE diet, as estimated by generalised additive model (GAMs). Distance to aquaculture ponds, distance to the nearest water-body, and water-body percentage were identified as the only significant predictors of non-fish proportions. Shaded areas represent 95% confidence intervals.

Boxplots showing the proportion of fish in WBSE diets across three distance categories from (a) aquaculture and (b) natural water-bodies. “Near”, “Middle”, and “Far” refer to 0–800 m, 800–1600 m, and >1,600 m, respectively.

Discussion
In the analysis of prey items from nests, fish emerged as the dominant prey category, with birds, reptiles, invertebrates, and mammals forming smaller components of the WBSE diet. Furthermore, landscape analysis revealed that the proportion of fish was strongly linked to the proximity of natural water-bodies and the overall percentage of water coverage around nesting sites. Notably, closer distances to aquaculture ponds did not enhance fish consumption in WBSE diets; in fact, the results indicate that a greater distance from aquaculture was associated with more fish in the diet.
Preferences of fish over other prey categories
In this study, WBSEs exhibited a strong preference for fish over other prey categories, rendering fish the predominant component of their diet. Multiple studies have similarly reported fish being the primary food source for WBSEs (Debus Reference Debus2008; Olsen et al. Reference Olsen, Debus, Rose and Judge2013; Pattnayak et al. Reference Pattnayak, Panda, Prusty, Rout and Jena2025; Smith Reference Smith1985). This is substantiated by a study along the southern coast of India where Byju et al. (Reference Byju, Raveendran and Mathiyazhagan2023) observed substantial fish remnants beneath WBSE nests. Similarly, recent reports on the diet of the WBSE in the Indian eastern coast have suggested WBSE preferring more fish. Globally this trend remains the same as 47% of the diet remains fish (Pattnayak et al. Reference Pattnayak, Panda, Prusty, Rout and Jena2025). In an experimental study, Thomson et al. (Reference Thomson, Stevens, Jones and Huijbers2016) noted that WBSEs consistently selected mullet carrion over alternative prey types such as quail, reinforcing the species’ preference for fish. The mechanisms underlying this pronounced preference are closely tied to WBSEs’ foraging behaviour and habitat selection. Nesting near water-bodies (Azman et al. Reference Azman, Zainudin, Sah and Latip2013; O’Donnell and Debus Reference O’Donnell and Debus2012) directly facilitates their ability to exploit abundant fish resources more efficiently (Tobias et al. Reference Tobias, Sheard, Pigot, Devenish, Yang and Sayol2022), thereby reducing foraging costs associated with seeking prey further inland. This behaviour aligns with the “optimal foraging theory”, which posits that predators develop strategies to maximise net energy gain while minimising energy expenditure (Li Reference Li2018; Papastamatiou et al. Reference Papastamatiou, Iosilevskii, Di Santo, Huveneers, Hattab and Planes2021). From this standpoint, fish likely offer an ideal balance of nutritional pay-off and ease of capture, explaining WBSEs’ higher reliance on aquatic habitats (Pattnayak et al. Reference Pattnayak, Panda, Prusty, Rout and Jena2025).
Ecological factors driving foraging preference: energy, risk, and habitat structure
Our findings indicate that the proportion of fish in the diet was higher when nests were closer to natural water-bodies and surrounded by a greater proportion of aquatic habitat, while the distance to aquaculture farms had an inverse relationship with fish consumption. In other words, WBSEs disproportionately favour natural wetlands over aquaculture sites for their fish prey. Studies elsewhere also have suggested a similar pattern, as in Tasmania, Australia where WBSE had higher foraging range when residing near aquaculture farms. Foraging efficiency was lower at aquaculture sites, with possible consequences for energetics and breeding success (Wiersma and Richardson Reference Wiersma and Richardson2009). Similarly, studies have shown that even where prey from anthropogenic sources offers higher caloric content, predators often avoid it due to the greater energy cost of acquisition, favouring less calorie-dense natural prey that requires less effort (Potter et al. Reference Potter, Stannard, Greenville and Dickman2018; van Donk et al. Reference van Donk, Shamoun-Baranes, van der Meer and Camphuysen2019). There are three possible explanations for these results. One possible explanation lies in energy budgeting, as wild fish often exhibit greater species diversity and higher nutrient density than farmed counterparts (Martinez et al. Reference Martinez, Willoughby and Christie2018; Willer et al. Reference Willer, Newton, Malcorps, Kok, Little and Lofstedt2024). These diverse fish populations, particularly those inhabiting shallow littoral zones, offer raptors a range of prey sizes and types (Porej and Hetherington Reference Porej and Hetherington2005). In natural wetlands, fish are frequently more vulnerable to raptor predation, which aligns with research showing that fish-hunting raptors can achieve higher capture success compared with predators targeting mammals or birds (Temeles Reference Temeles1985). Moreover, anthropogenic habitats sometimes demand additional energy expenditure such as evading human activity or navigating restricted spaces, thereby reducing the net energetic gain of foraging in aquaculture ponds (van Donk et al. Reference van Donk, Shamoun-Baranes, van der Meer and Camphuysen2019). Together, these factors suggest that WBSEs conserve energy more effectively when they hunt in natural water-bodies characterised by abundant and easily accessed fish resources.
Another possible factor influencing WBSE foraging choices could be related to risk-sensitive foraging. While aquaculture farms appear to concentrate fish in smaller areas, many facilities employ measures such as netting, fencing or even active deterrents to protect their stock (Dempster et al. Reference Dempster, Arechavala‐Lopez, Barrett, Fleming, Sanchez‐Jerez and Uglem2018; Zhong et al. Reference Zhong, Chen, Dai, Liu, Zheng and Zhu2018). Such interventions introduce greater risk for raptors, which must contend with potential entanglement, human disturbances, and limited access to fish held behind barriers. In ecological terms, WBSEs may avoid these high-disturbance or high-hazard zones if the overall net pay-off, factoring in both caloric intake and the threat of injury or interference, is lower than in natural wetlands. This avoidance is further influenced by the possibility that farmed fish, although present in high densities, may be less nutritionally rewarding than their wild counterparts, reducing the incentive to persist in an environment fraught with barriers or conflict (Heilpern et al. Reference Heilpern, Almeida, Fiorella, Flecker, Williams and McIntyre2023). Consequently, risk-averse behaviour can steer WBSEs away from aquaculture farms, even when farmed fish might be seasonally abundant.
Finally, the availability of suitable perching sites interweaves with both energy budgeting and risk dynamics to reinforce WBSEs’ reliance on natural wetlands. Raptors, including WBSEs, often use perch-hunting strategies that minimise flight costs and maximise hunting efficiency (Ekblad et al. Reference Ekblad, Tikkanen, Sulkava and Laaksonen2020; Nadjafzadeh et al. Reference Nadjafzadeh, Hofer and Krone2016). Natural wetlands typically feature trees, snags or other vantage points which WBSEs can use to locate and capture fish with minimal exertion (Widén Reference Widén1994). By contrast, aquaculture operations rarely incorporate such perches and may instead be designed to exclude large birds, thereby disrupting the low-energy, sit-and-wait techniques that WBSEs favour. When we integrate these three facets, energy gains from diverse, wild prey, lower risk in less-disturbed habitats, and sufficient perching opportunities for efficient hunting, we see a coherent explanation for why WBSEs opt for natural water-bodies over human-managed sites. The synergy of these factors highlights how evolutionary adaptations, ecological constraints, and human land-use practices converge to shape WBSE foraging behaviour in coastal landscapes.
Broader ecological and conservation implications
Having established the WBSE’s strong preference for natural water-bodies over aquaculture sites, our findings underscore the essential role of intact aquatic habitats in sustaining apex predators. These environments, rich in fish assemblages and supportive habitat structures, offer not only a reliable food supply but also crucial nesting and perching sites for species like the WBSE (Debus Reference Debus2008; Olsen et al. Reference Olsen, Debus, Rose and Judge2013). The observed link between proximity to natural water-bodies and higher proportions of fish in WBSE diets underscores the species’ functional reliance on these ecosystems and, by extension, highlights how apex predators can serve as indicators of broader aquatic health (Sekercioglu Reference Sekercioglu2006). Along the eastern coast of India, however, rapid aquaculture expansion and coastal development threaten to fragment these essential wetlands (Paul et al. Reference Paul, Paul, Sardar, Bid, Paul and Paul2023; Ragavan et al. Reference Ragavan, Kathiresan, Mohan, Ravichandran, Jayaraj and Rana2021). Converting natural habitats into aquaculture ponds can lead to pollution and disturb nesting areas, ultimately reducing viable foraging grounds for raptors (Navedo et al. Reference Navedo, Fernández, Valdivia, Drever and Masero2017). Recognising that apex predators help regulate fish populations and maintain ecosystem balance (Byju et al. Reference Byju, Raveendran and Mathiyazhagan2023), effective management must integrate the WBSE’s ecological needs. Key strategies include establishing protected areas, adopting stringent environmental standards for aquaculture, and promoting sustainable farming practices that minimise environmental damage (Naylor et al. Reference Naylor, Hardy, Buschmann, Bush, Cao and Klinger2021).
The challenges evident in our study area mirror a global trend of rising human pressures on coastal ecosystems (Halpern et al. Reference Halpern, Walbridge, Selkoe, Kappel, Micheli and D’Agrosa2008). Notably, WBSE foraging patterns driven by factors like energy efficiency, reduced risk, and favourable habitat structure illustrate how predator preferences can inform wider conservation goals. For instance, designing ecologically sensitive aquaculture sites with buffer zones or fewer physical barriers can mitigate conflicts between raptors and fish farming. In addition, the WBSE’s status as an apex predator offers a cost-effective way to monitor ecosystem health: shifts in their foraging or nesting behaviour can signal environmental degradation before it becomes irreversible (Caro Reference Caro2010). Ultimately, safeguarding natural water-bodies and adopting evidence-based policies to balance coastal development with ecological integrity will strengthen biodiversity conservation and ensure the continued survival of top predators like the WBSE.
Although this study encompassed diverse nesting sites along the eastern coast, there remains an opportunity to enhance the analysis by identifying fish prey at the species level. Such detail would provide clearer insights into the relative contributions of aquaculture and wild-caught fish, particularly given that many aquaculture operations practise the monoculture of a single species. This added resolution could further illuminate whether WBSEs actively favour or avoid farm-raised fish. Additionally, relying primarily on prey remains may not capture the full range of WBSE foraging behaviour, and locally specific factors could limit the broader application of our findings. Nevertheless, these constraints appear to have only a minimal effect on the main conclusions, given the consistent patterns observed across multiple nests and seasons.
Conclusions
Our findings clearly demonstrate that WBSEs rely more on wild fish from natural water-bodies than on farmed fish from aquaculture sites along the eastern coast of Odisha, India. Despite the rapid expansion of aquaculture in this region, closer distance to natural aquatic habitats and higher water-body coverage consistently enhanced fish consumption in WBSE diets, while aquaculture-related factors showed no positive association with fish intake. This pattern suggests that factors such as better energy gains, reduced disturbance, and the presence of suitable perching sites in natural wetlands drive WBSEs’ preference for wild prey. Consequently, preserving intact aquatic ecosystems emerges as a key strategy for maintaining healthy WBSE populations, given their function as both apex predators and indicators of overall ecosystem health. Moving forward, targeted research that identifies fish prey at species level and integrates more direct methods for identification of prey and home range (e.g. stable isotope analysis, telemetry) will refine our understanding of how these raptors navigate in the changing coastal landscapes. Ultimately, balancing aquaculture development with the ecological requirements of top predators will be vital in sustaining biodiversity and ecosystem services in India’s coastal regions.
Acknowledgements
We express our gratitude for the financial assistance provided by the Department of Science and Technology, Government of Odisha, under Project No. 1427/ST(O)/2020 to BAKP. We also thank the University Grants Commission, Government of India, for the UGC-NET JRF fellowship (Ref No. 220510637850) to SPP. We would like to express our gratitude to the Vice Chancellor of Berhampur University for offering the essential resources that enabled the completion of this research. The authors followed the Odisha Forest Department rules while undertaking the study and only collected prey items during the after-fledging and post-failure periods.
Authors’ contribution
SPP: writing – original draft, fieldwork, visualisation, validation, formal analysis, data curation, conceptualisation; SR: fieldwork, data curation, review, editing; BS: fieldwork, data curation, formal analysis; BAKP: supervision, funding acquisition, review, editing.