Introduction
There is a variety of reasons why it may be of interest to estimate the long-term carbon budgets for lichens and bryophytes. One is to estimate the carbon balance of lichen- and bryophyte-dominated ecosystems such as the Arctic and Antarctic tundra or coastal deserts (e.g. Lange et al. Reference Lange, Hahn, Meyer and Tenhunen1998, Reference Lange, Green, Melzer, Meyer and Zellner2006; Green et al. Reference Green, Schroeter, Sancho, Pugnaire and Valladares2007). A second is to estimate the relative contribution of lichens and bryophytes to the carbon balance of ecosystems dominated by vascular plants (DeLucia et al. Reference DeLucia, Turnbull, Walcroft, Griffin, Tissue, Glenny, McSeveny and Whitehead2003). A third is to explain large-scale lichen and bryophyte distribution patterns; for example, to understand why bryophytes and macrolichens are relatively rare in certain climatic zones, such as tropical lowlands (Richards Reference Richards and Schuster1984; Zotz et al. Reference Zotz, Schultz and Rottenberger2003).
At the level of the ecosystem, continuous long-term measurements of CO2 exchange under natural conditions, for example, using eddy covariance, is a common method to arrive at long-term carbon budgets (e.g. Suyker & Verma Reference Suyker and Verma2001; Flanagan et al. Reference Flanagan, Wever and Carlson2002; Monson et al. Reference Monson, Turnipseed, Sparks, Harley, Scott-Denton, Sparks and Huxman2002). However, for single plants CO2-exchange measurements imply a disturbance of the ‘natural conditions’, because the samples have to be included in cuvettes for the actual measurement. The next best alternative, frequently (e.g. hourly) repeated measurements carried out under natural conditions is rather laborious, so that such exercises are usually restricted to a few weeks at most (e.g. Skre & Oechel Reference Skre and Oechel1981; Zotz & Winter Reference Zotz and Winter1994a; Zotz et al. Reference Zotz, Schultz and Rottenberger2003; Lange et al. Reference Lange, Büdel, Meyer, Zellner and Zotz2004; Reference Lange, Green, Meyer and Zellner2007; Reinhardt & Smith Reference Reinhardt and Smith2008). The main goal of most of these studies is to gain a mechanistic understanding of carbon gain by relating diel (24 h) CO2-exchange patterns to variation in environmental conditions.
If the goal of a study is purely to determine an organism's annual carbon budget, measuring growth over a year or over many years may be a better option than measuring CO2 exchange. Growth can often be measured more easily than CO2 exchange (Palmqvist et al. Reference Palmqvist, Dahlman, Jonsson, Nash and Nash2008) and the two generally correlate reasonably well (Kärenlampi et al. Reference Kärenlampi, Tammisola, Hurme and Wiegolaski1975; Larcher Reference Larcher2001; Zotz & Rottenberger Reference Zotz and Rottenberger2001). Growth reflects the total carbon balance of an organism rather than primary productivity, because carbon may also get lost by ways other than gas exchange, for example, through leaching, herbivory or reproduction (Coxson et al. Reference Coxson, McIntyre and Vogel1992; den Herder et al. Reference den Herder, Kytoviita and Niemela2003; Gauslaa Reference Gauslaa2006; Asplund & Gauslaa Reference Asplund and Gauslaa2008). Therefore, to estimate carbon sequestration at an ecosystem level, CO2-exchange measurements are more informative than growth measurements. To understand both the carbon acquisition processes and estimate carbon budgets, CO2-exchange measurements are indispensable, whereas growth measurements can be complementary. The number of CO2-exchange measurements needed for an accurate carbon budget estimate may differ strongly between different plant groups, depending on the temporal variability and predictability of diel and seasonal gas exchange patterns.
In homoiohydric vascular plants growing in exposed rainforest sites, the relationship between the daily maximum rate of photosynthesis (Amax) and the integrated diel (24 h) carbon gain (Adiel) (Zotz & Winter Reference Zotz and Winter1993), and that between leaf nitrogen content (Nleaf) and Amax allow the determination of annual carbon budgets by regular determinations of Nleaf (Zotz & Winter Reference Zotz and Winter1994b). In poikilohydric bryophytes and lichens no such correlation can be expected due to the very different nature of diel metabolic activity. For lichens, Amax and Adiel correlate well on days when lichens are moistened by nocturnal dew or frost (Lange et al. Reference Lange, Green, Melzer, Meyer and Zellner2006; Lange & Green Reference Lange and Green2008), but for many other weather types the correlation between Amax and Adiel is weak or absent. A weak correlation between Nthallus and potential maximum photosynthesis rates (Apot) also exists (Palmqvist et al. Reference Palmqvist, Dahlman, Valladares, Tehler, Sancho and Mattsson2002), but whereas in homoiohydrics Apot will be reached at some point on most days (so Apot ≅ Amax), in poikilohydrics Apot is a poor predictor of Amax, let alone Adiel (O. L. Lange, unpublished data). Carbon gain in poikilohydric organisms such as lichens, mosses and liverworts is characterized by a strong dependency on weather conditions and shows rapid fluctuations, especially in exposed growing sites. When dry, these organisms are inactive and show no CO2 exchange. When moist, their CO2 exchange depends principally on temperature and light, as in other photoautotrophic organisms, plus strongly on the degree of hydration. Photosynthesis is optimal at intermediate hydration; at low hydration physiological activity is reduced, whereas at high hydration the increased thallus diffusive resistance hinders CO2 uptake. The optimal intermediate hydration state often lasts only for a short period, however, especially during high-light conditions, so that activity peaks may be of very short duration. The high Amax measured during such a short peak has little predictive power for carbon gain over the whole day, except in habitats where predictably only one peak occurs per day, such as in fog deserts (Lange et al. Reference Lange, Green, Melzer, Meyer and Zellner2006; Lange & Green Reference Lange and Green2008). Accurate estimates of diel carbon budgets can therefore be derived only by frequent CO2-exchange measurements over 24 h periods, which is a very time- and labour-intensive task. It is an open question, however, how accurate diel budgets need to be to arrive at an accurate annual budget.
For estimating annual carbon budgets, a second problem with poikilohydric CO2-exchange patterns is the great variability between single days. Ideally, the annual budget would be derived from reliable budgets for every single day of the year. This, however, is not feasible in most research projects, so that a sample of days will be used to estimate the annual budget. The accuracy of this estimate can of course be evaluated only if the true value is known, which is usually not the case. In this paper we show how different sampling schemes, on two temporal scales, affect annual carbon budget estimates for a placodioid crustose lichen in the temperate zone. We use a dataset of half-hourly readings of CO2 exchange over a whole year (Lange Reference Lange2002, Reference Lange2003a, Reference Langeb) and use sub-samples of this dataset to quantify the effects on estimates of annual budgets of 1) lower sampling frequencies within a day, 2) sampling fewer days, 3) sampling single days or blocks of contiguous days, 4) sampling in one season only, and 5) using either random or regular sampling schemes. The data involve a single lichen sample, so we will not address intraspecific variation. This is of course an important issue for scaling up to ecosystem carbon budgets and is also relevant for deriving the general performance characteristics of a particular lichen species. Minimizing the sampling effort for one individual should allow sampling several individuals and thus obtain a, potentially, more representative value for a species or other taxonomic or functional group in question.
Material and Methods
Data set
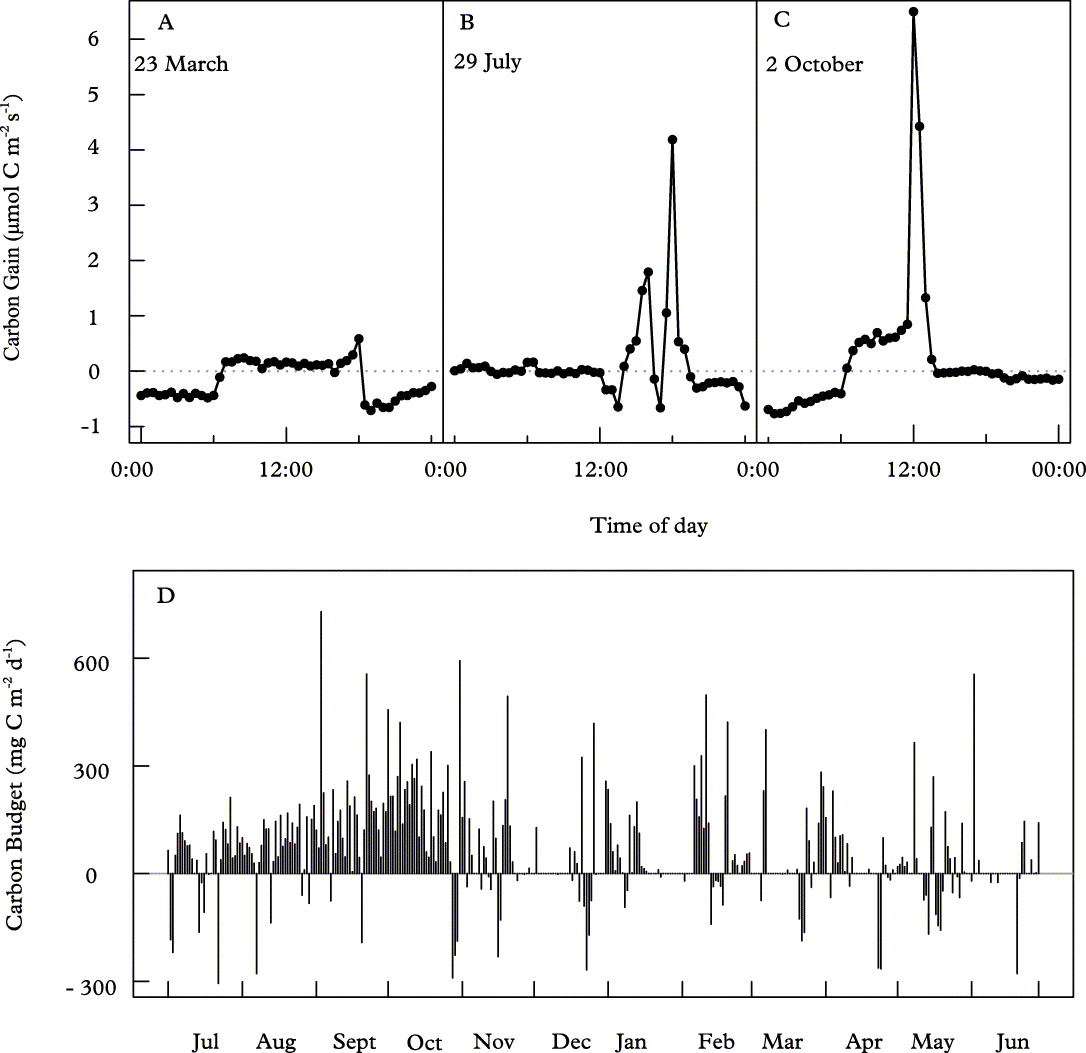
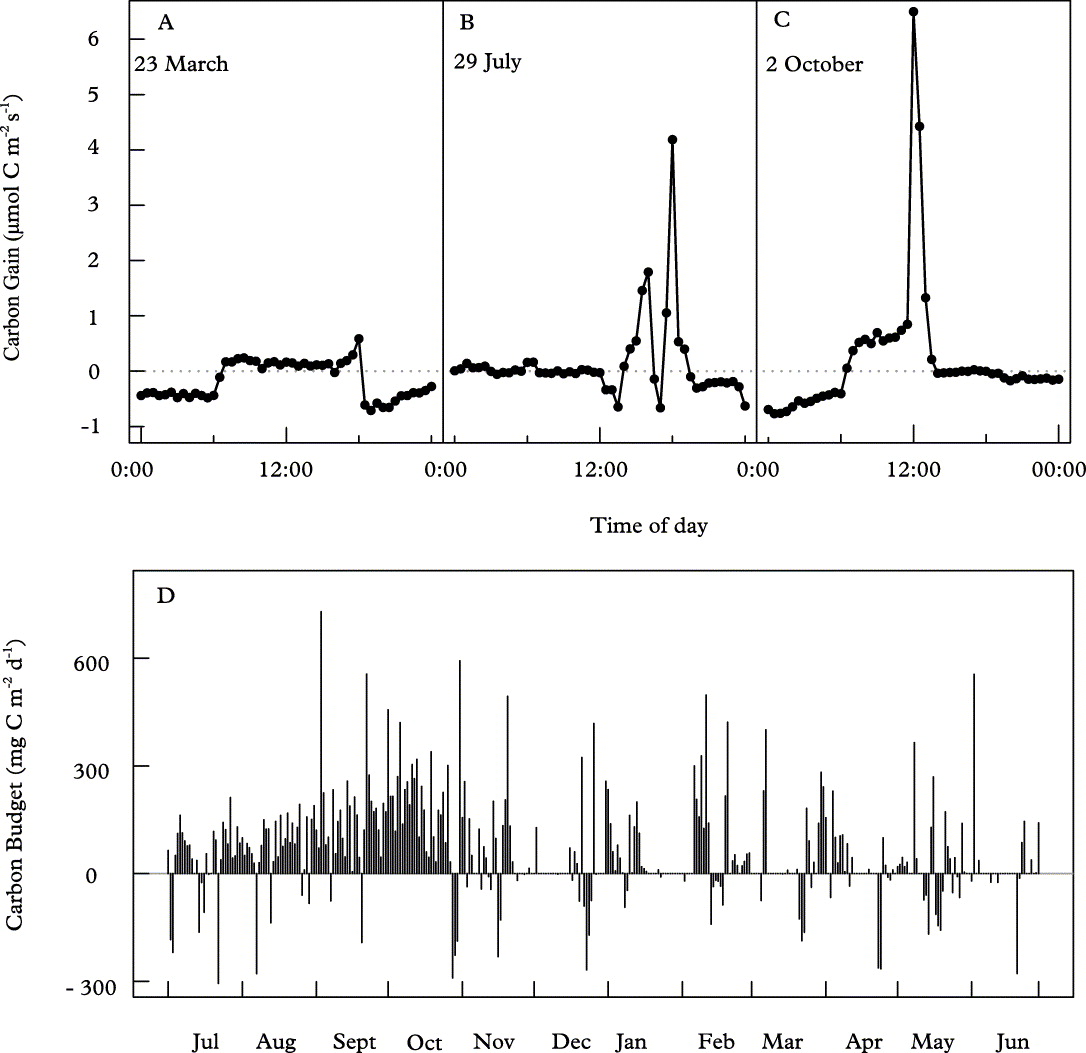
We used a dataset of half-hourly readings of CO2 exchange of the epilithic, green-algal lichen Lecanora muralis (Schreb.) Rabenh. (syn. Protoparmeliopsis muralis (Schreb.) M. Choisy) (Lange Reference Lange2002, Reference Lange2003a, Reference Langeb; Lange & Green Reference Lange and Green2008). These data were collected for 466 days from June 1995 to September 1996 in the botanical garden of the University of Würzburg, southern Germany, using an automatic cuvette (‘klapp cuvette’, Walz GmbH, Effeltrich, Germany). A detailed discussion of the cuvette setup and the observed diel and seasonal patterns, as well as the dependencies of CO2 exchange on various environmental factors, can be found in Lange (Reference Lange2002, Reference Lange2003a, Reference Langeb). Some examples of diel CO2-exchange patterns from these data and a summary of all diel carbon budgets during one year are shown in Fig. 1. Autocorrelation between diel carbon budgets, expressed as the mean squared difference of diel values, was present only for consecutive days. Budgets at two days apart were already as unrelated to each other as budgets of days further apart (data not shown). All calculations were performed in R 2.5.1 (R Development Core Team 2007).
Some typical carbon exchange patterns in Lecanora muralis. A–C, diel carbon exchange; A, low activity throughout the day and night (thallus moist but activity limited by suprasaturation depression); B, no activity (carbon gain = 0) until thallus is wetted around midday, then some resaturation respiration followed by high photosynthesis, followed by drying and another rain event, after which the thallus remains moist and active during the following night; C, thallus very wet during the night and morning, then as thallus dries out suprasaturation depression is lifted and photosynthesis peaks, until after further drying activity ceases; D, diel carbon budgets (tAdiel) throughout the year (1995–1996). (For descriptions of more types of diel patterns, see Lange Reference Lange2003a).
Diel CO2 budgets
Thirty out of 365 of the diel courses of CO2 exchange (1 July 1995 to 29 June 1996 – one day before 30 June because 1996 was a leap year) were randomly selected. We then tested the relationship between sampling frequency and the accuracy of the estimated diel budget (eAdiel), accepting the budget calculated from the half-hourly readings as the ‘true’ value, i.e. the reference value (tAdiel). The original data set had one data point every 30 minutes, and we simulated lower sampling frequencies by using only every second (1 h frequency), third (1·5 h), fourth (2 h), sixth (3 h), eighth (4 h), twelfth (6 h) and 24th (12 h) reading. The first and last measurements were always at 00:00 and 24:00 h. Diel budgets were then calculated for the original and the simulated frequencies by linear interpolation of subsequent values.
Annual CO2 budgets
The half-hourly readings were summarized to diel CO2 budgets, resulting in one value per day. Out of 365 diel budgets (1 July 1995 to 29 June 1996) subsets of different sizes were sampled using various types of temporal distributions:
1. Regular sampling (e.g. weekly).
2. 1 to 365 days per year in one block, starting at a randomly drawn day, assuming a circular year.
3. 1 to 365 randomly drawn single days per year (no day drawn more than once).
4. Seasonally stratified randomly drawn days, 1 to 89 (the minimum season length) per season (spring starts 21 March, summer starts 21 June, autumn starts 23 September, winter starts 21 December Lange Reference Lange2003b).
5. Seasonally stratified blocks, one block of 1 to 89 days per season, starting at a randomly drawn day, restrained by the distance to the end of the season but assuming a circular year.
6. 12, 24, 52, 104 or 156 days (n) per year divided in 1 to n equally sized blocks, starting at randomly drawn days (no overlap between blocks), assuming a circular year.
This sampling was repeated 10 000 times for each combination of days and periods (except for regular sampling, where the number of possibilities is fixed). From each subset of diel budgets we estimated the annual budget (eAann) by simple extrapolation of the mean value. We record standard deviations and probabilities of obtaining estimates within 2·5%, 5%, 10%, 25% and 50% of the true annual carbon balance (tAann) as measures of the potential error of estimates based on different sampling schemes and frequencies. This true annual carbon balance, based on all diel balances, was 21·5 g C m−2 y−1 (corresponding to 0·63 g C gd.wt−1 y−1 on a dry weight basis, or 0·21 g C gC−1 y−1 on a carbon content basis).
Results
Diel CO2 budgets
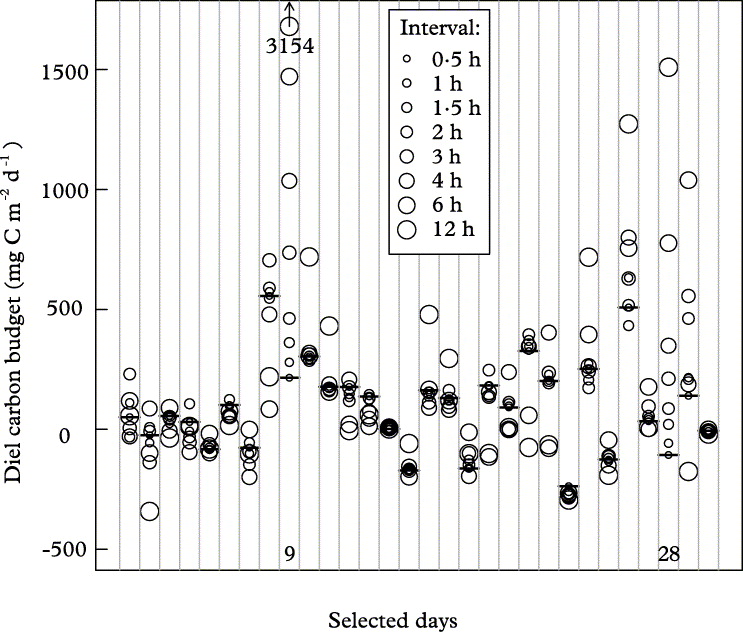
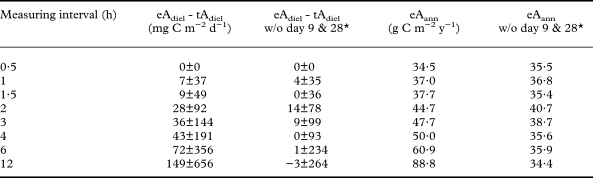
Lowering the sampling frequency during a 24-h period led to large deviations of the estimated diel budget (eAdiel) from the true value (tAdiel) for individual days (Fig. 2). These deviations were unbiased over 28 of the 30 days. The remaining two days showed a systematic increase of eAdiel with decreasing sampling intensity, which was due to only a few measuring points: on 2 October 1995 (day 9, Fig. 2) CO2 take-up was extremely high at exactly 12:00 h (Fig 1C). It then declined rapidly and the rest of that day it remained close to zero. A similar pattern was observed on 4 July 1996 (day 28). These high midday values were coincidentally included in all subsets and gained in relative importance as fewer of the other measurements were included. Without these two extreme days, the deviations of individual days cancelled out and the effect of sampling frequency on the annual estimate was consequently small (Table 1). Note, however, that the effect on eAann of sampling these particular 30 days was a deviation of about 14 g C m−2 y−1 (35·5 – 21·5 g C m−2 y−1), or >50%, from tAann.
Effect of sampling frequency during a day on eAdiel in Lecanora muralis (y-axis) for 30 random days, ordered chronologically (x-axis). Horizontal bars indicate tAdiel. The two days marked (9 = 2 October 1995, see Fig. 1C, 28 = 4 July 1996) showed a large and directional deviation with increasing measuring interval.
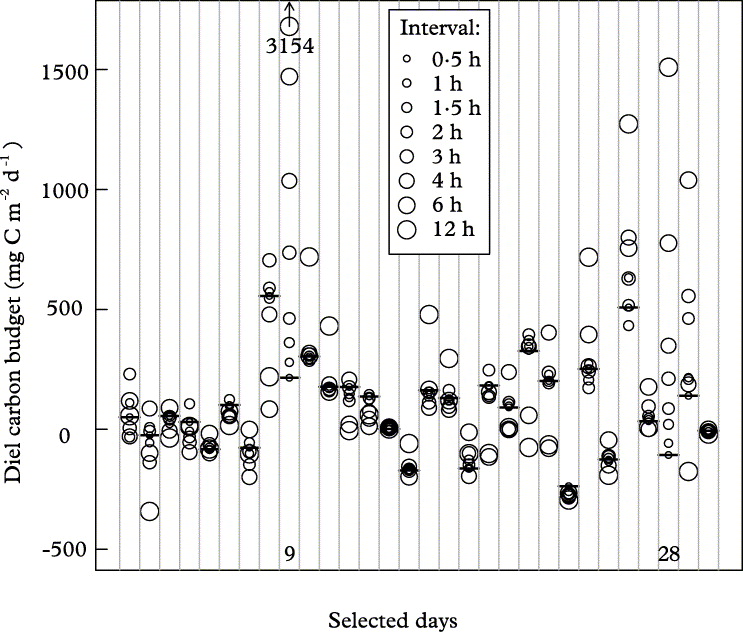
Effect of regular sampling throughout the day at various intervals on the deviation (mean ± SD) of the estimated (eAdiel) from the real (tAdiel, based on 0·5-hourly sampling) diel carbon budget and on the estimated annual carbon budget (eAann) in Lecanora muralis. These statistics are based on 30 randomly selected days, or these selected days without two strongly deviating days*. The true annual carbon budget (tAann, based on 365 days of 0·5-hourly sampling) was 21·5 g C m−2 y−1.

* without day 9 = 2 October 1995 and day 28 = 4 July 1996, see marked days in Fig. 2.
Annual CO2 budgets
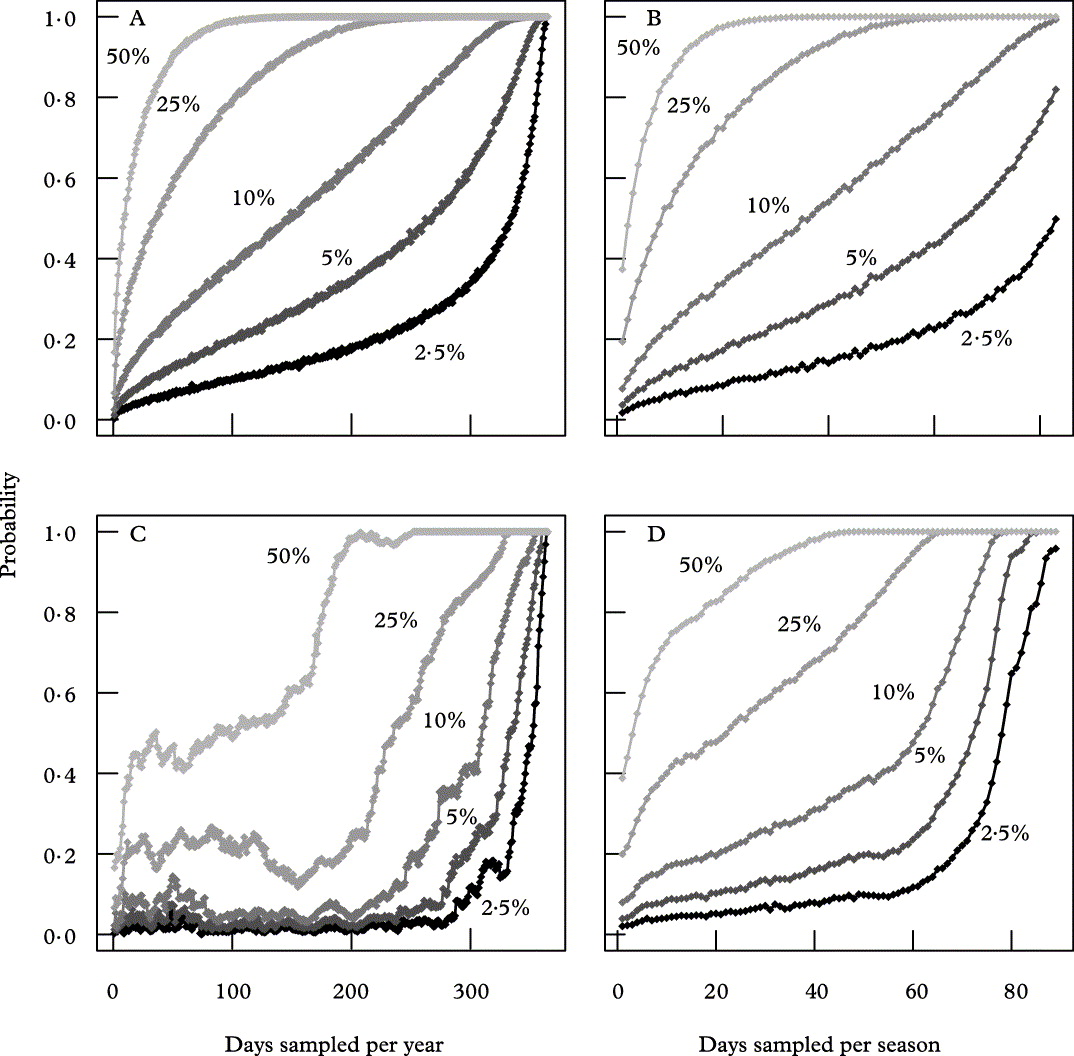
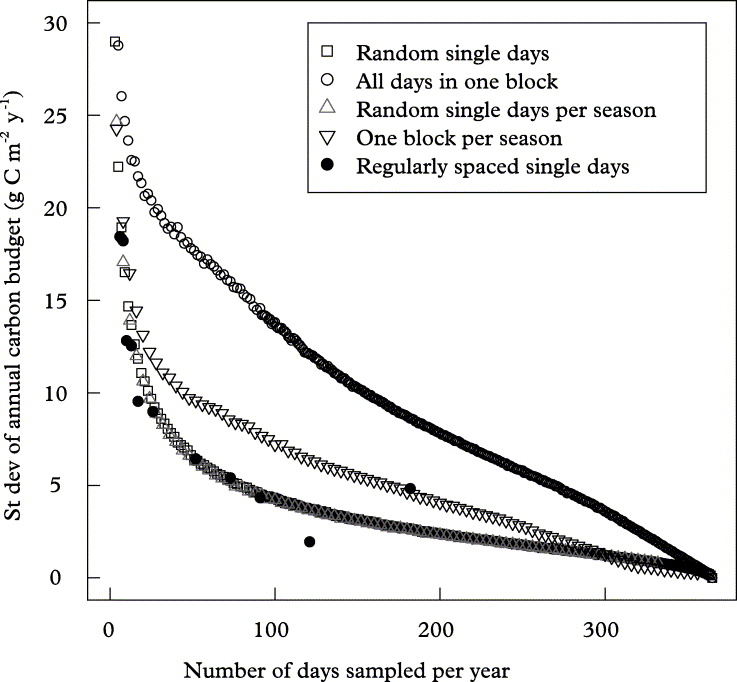
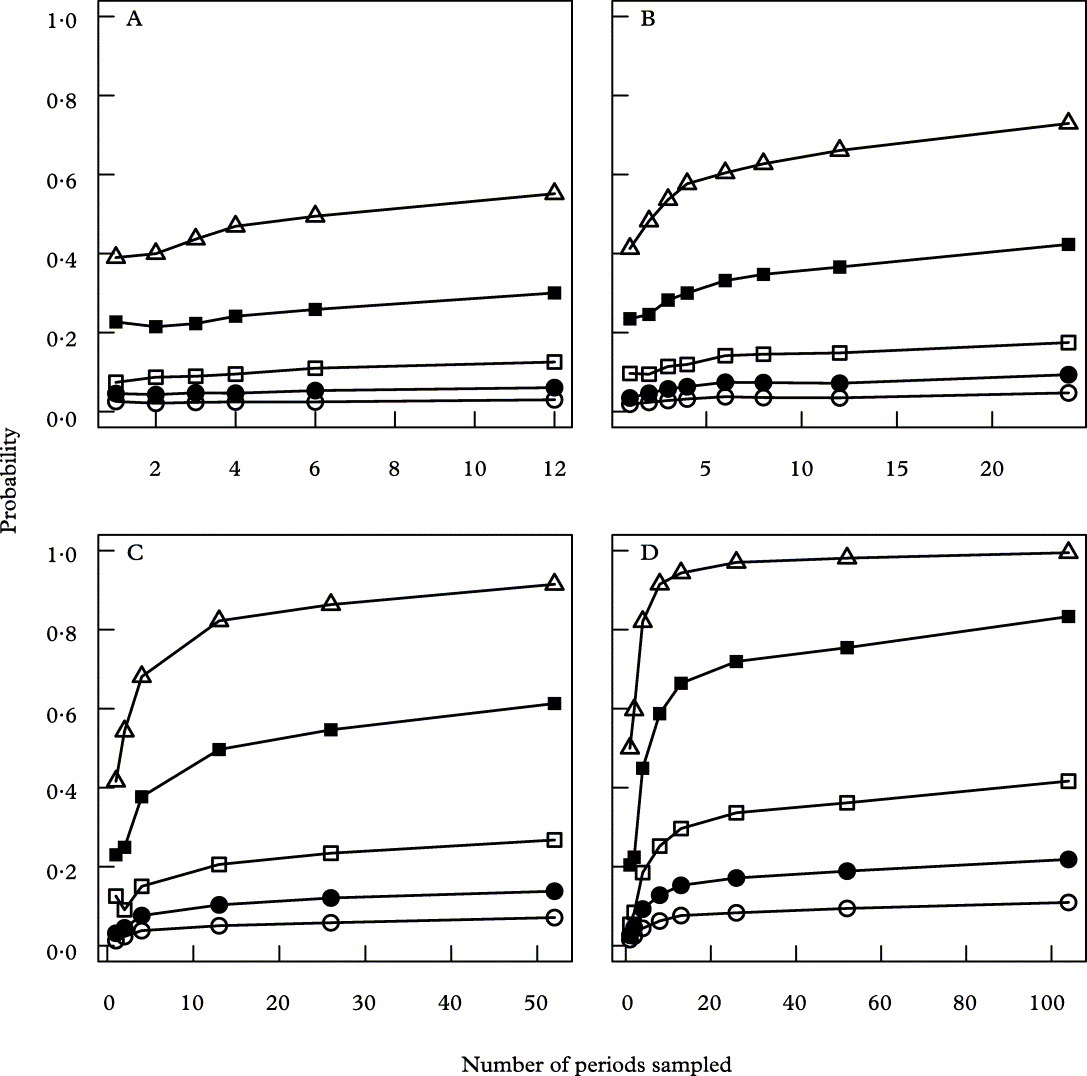
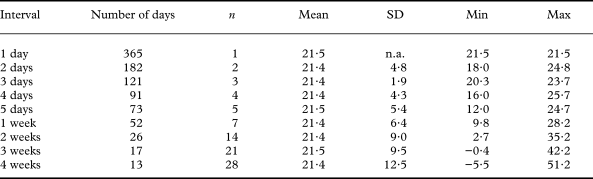
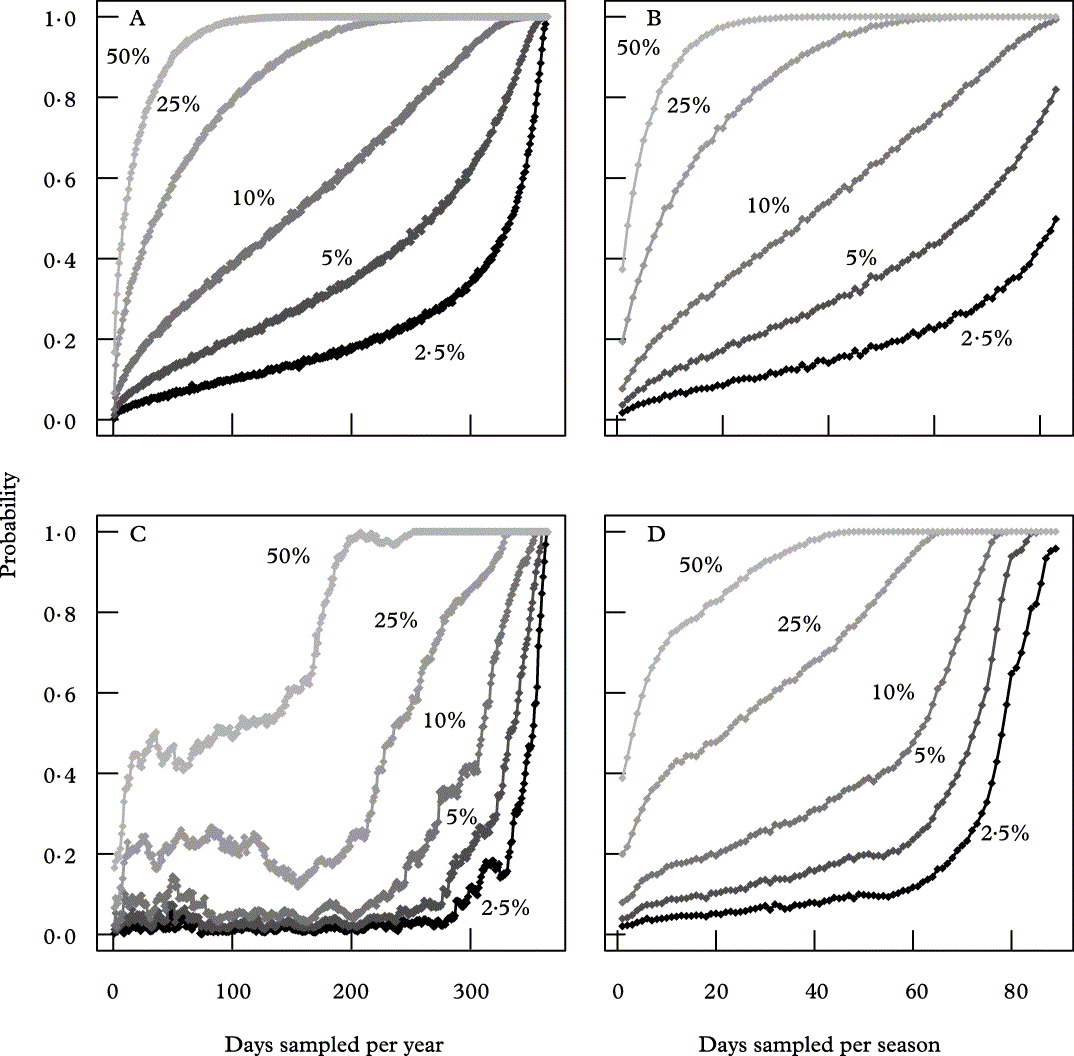
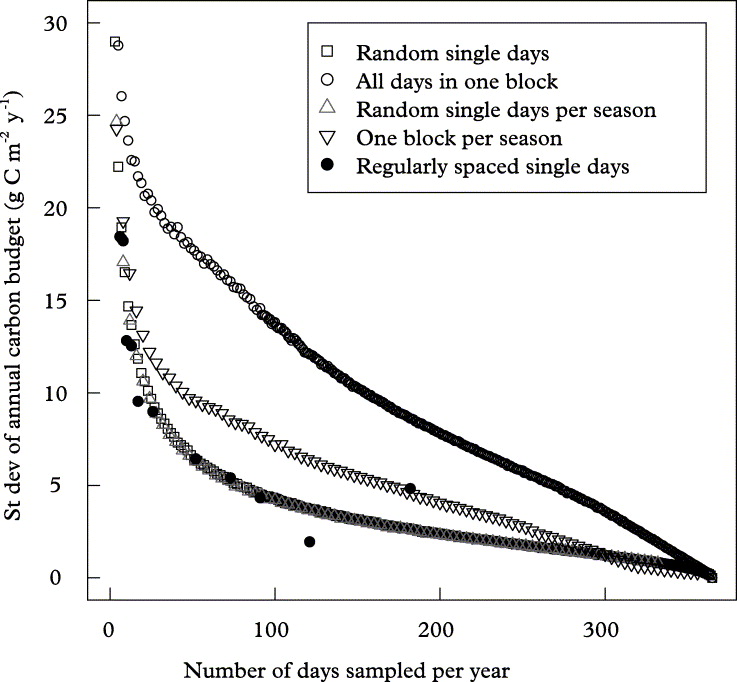
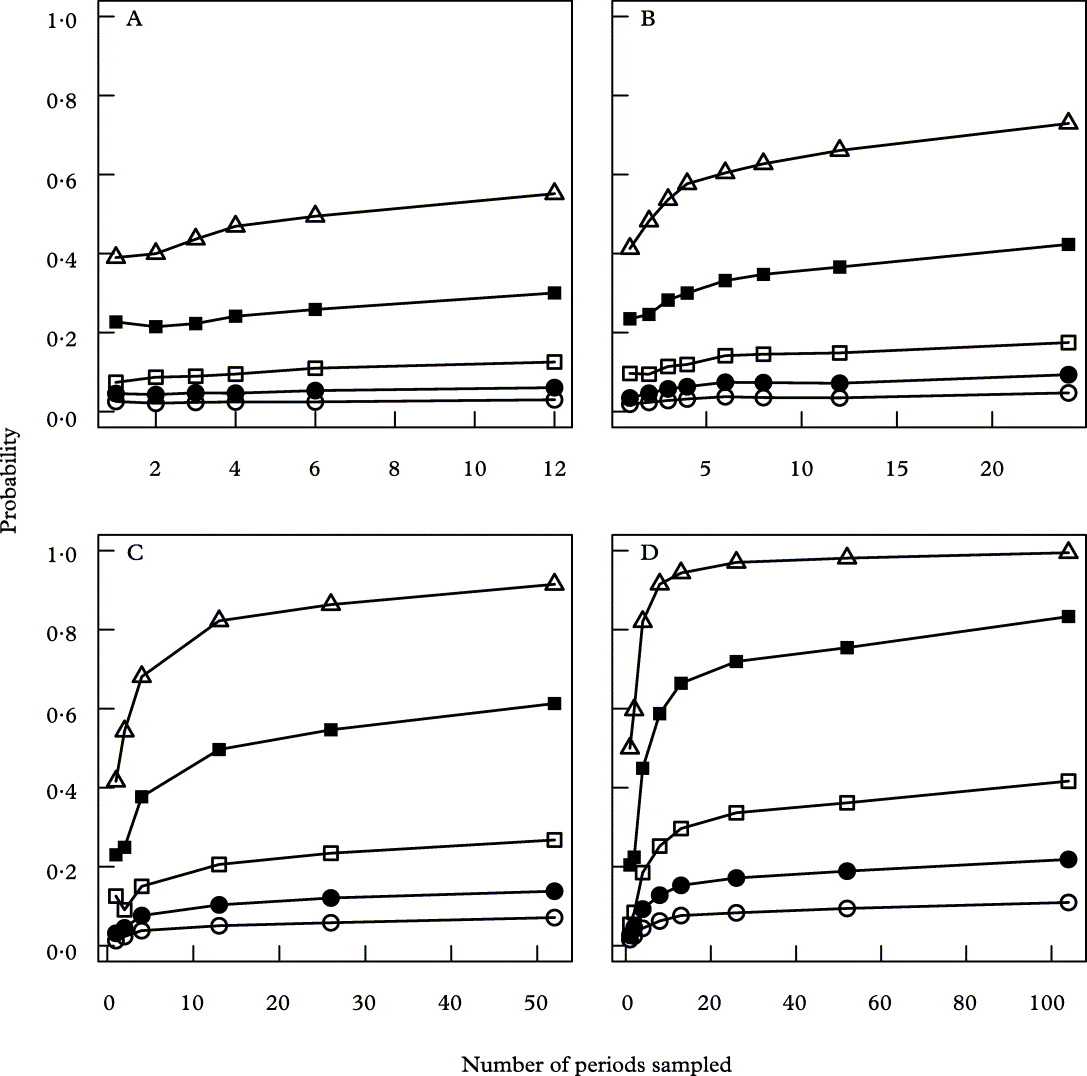
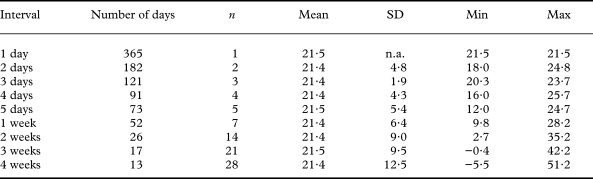
In the temperate climate of our study area, weather conditions vary strongly from day to day and from season to season. Accordingly, the variation in diel budgets (tAdiel) over the year was large: the mean and standard deviation of the 365 diel budgets were 59 ± 137 mg C m−2 d−1, or 0·19 ± 0·43 mg C gd.wt−1 d−1. As expected, decreasing the number of sampling days strongly lowered the probability of obtaining annual estimates (eAann) close to the true carbon budget based on the full 365 day data set (tAann; Fig. 3). Decreasing the number of days broadened the range of possible outcomes of eAann (Fig. 4), including extreme deviations. For example, regular sampling every 4 weeks (13 sampled days) could yield estimates of over 200% of the true value, as well as negative estimates (Table 2). Even more extreme deviations were obtained within 10 000 permutations of randomly sampled days; for example, eAann values of −35 and 87 g C m−2 y−1 when sampling 13 random days, but the probability of arriving at such extreme estimates was of course very small. Distributing these days as single days rather than aggregating them into blocks gave a higher probability of eAann approaching tAann (compare Figs 3A & 3C, Fig. 4), while it did not matter whether days were randomly chosen within the year, regularly spaced, or stratified per season (compare Figs 3A and 3B, Fig. 4). Stratifying blocked measurement periods per season (Fig. 3D) gave a higher probability of eAann approaching tAann than measuring one (larger) block in a year (Fig. 3C). This is related not only to seasonality, but to the general advantage of having four blocks instead of one (Fig. 5).
Effect of various sampling patterns and intensities (x-axis) on the quality of the resulting annual carbon budget estimate in Lecanora muralis: probabilities of eAann being within 2·5% (black bottom dots), 5%, 10%, 25% and 50% (lightest grey upper dots) of tAann, based on 10 000 permutations. A, randomly drawn single days; B, randomly drawn single days stratified according to season; C, single block of varying length starting on a randomly drawn date; D, one block of varying length per season, starting on random days.
Standard deviations of eAann in Lecanora muralis for different sampling schemes. Based on 10 000 permutations (random days and blocks) or all possible sets of regularly spaced days (e.g. 121 days sampled = one sample every three days, giving only three possible sets). Sampling per season means that eAann was estimated from an equal number of days from each season. The mean of the permutations was always within 2% and the mean of all sets of regularly spaced days was always within 6% of tAann (21·5 g C m−2 y−1).
The probability of eAann being within 2·5% (○), 5% (●), 10% (□), 25% (■) and 50% (△) of tAann in Lecanora muralis when applying various sampling intensities (A, 12 days/y; B, 24 days/y; C, 52 days/y; D, 104 days/y) distributed over 1 to n blocks (x-axis) starting on randomly drawn days. Based on 10 000 permutations.
Effect of regular sampling of days at various intervals throughout the year, from every day to once every four weeks, on the quality of the resulting annual carbon budget estimate (eAann; or tAann for an interval of 1 day) for Lecanora muralis (in g C m−2 y−1). Statistics based on all possible sets of measuring days (e.g. for weekly sampling: Monday through Sunday, n = number of permutations = 7).
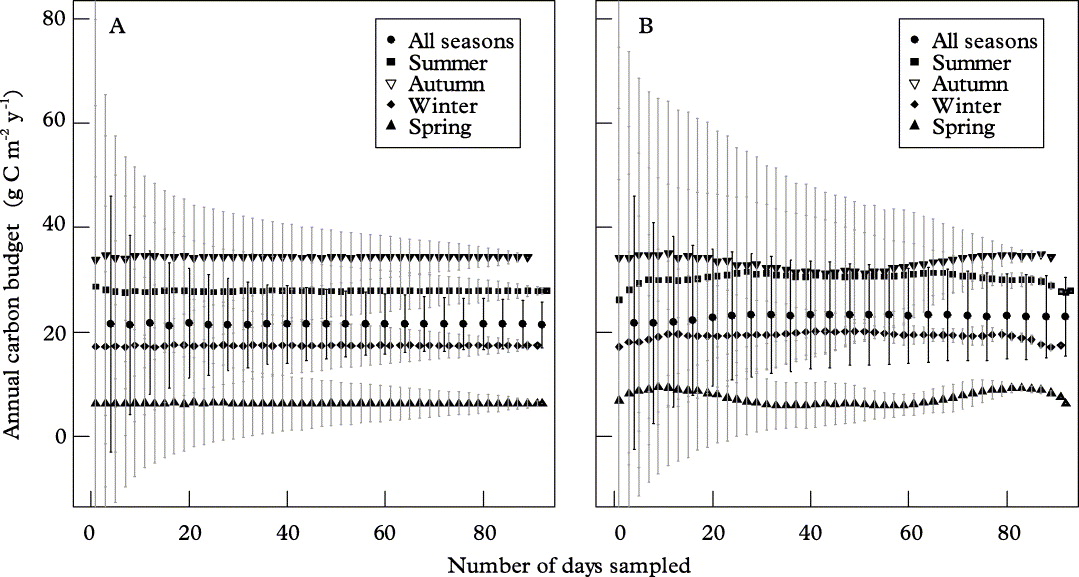
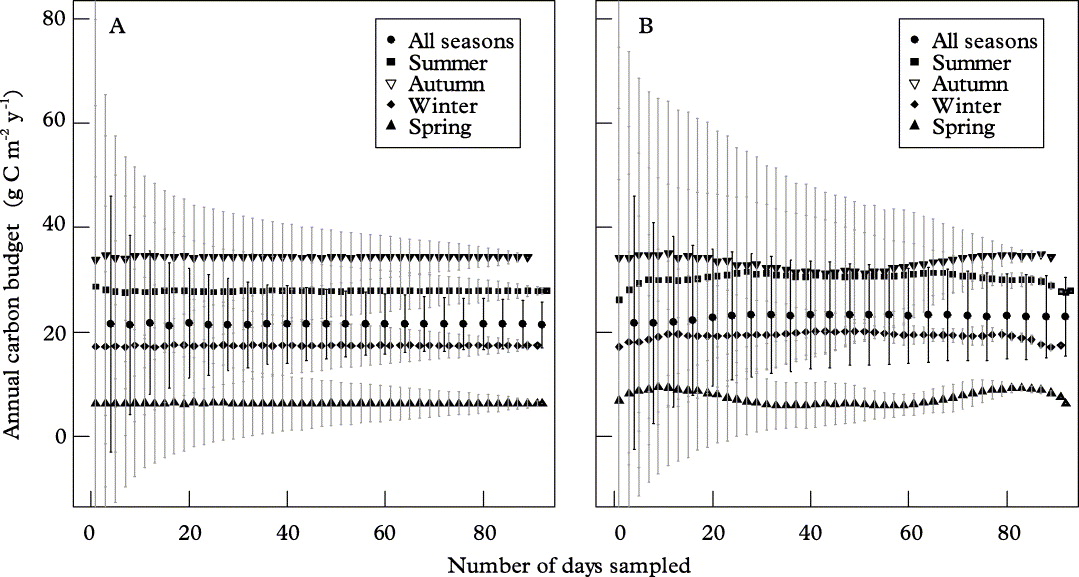
Limiting sampling efforts to a single season introduced a large bias in eAann (Fig. 6). The more intensely a season was sampled, the less likely was an estimate to be near the annual mean, as the seasonal mean was more closely approached. In this particular year, sampling only in autumn or summer, or only in spring would have given strong over- or underestimations of tAann, respectively.
Estimates of the annual carbon budget (eAann) in Lecanora muralis based on various sampling intensities in different seasons; A, randomly drawn single days; B, blocks of days starting on a random day. Means (symbols) and standard deviations (error bars) are based on 10 000 permutations. ‘All seasons’ is a random sampling stratified by season (A), or a block in each season, starting on random days (B). Starting days of blocks were restrained so that the block would not exceed the season. The variation in mean eAann in B is due to the relative over-sampling of days in the middle of these seasons, which happened to have, for instance, relatively low diel carbon balances in autumn and spring.
Discussion
Accuracy of different sampling schemes
To obtain the most accurate estimate of annual carbon gain from a fixed number of measuring days, a random or regular spacing of single days throughout the year is optimal. Still, even when sampling, for instance, 52 random days of the year, i.e. on average one day each week, the probability of reaching an estimate within 25% of the true annual budget, which arguably is a modest goal, does not exceed 60% (Figs 3 & 5). This is also demonstrated by the estimate based on the 30 days randomly selected for diel sampling (Table 1), which yields an over-estimation of the true budget of over 50%. A considerable investment of time (i.e. measuring days) thus seems unavoidable for obtaining reliable estimates of annual budgets.
Next to reducing the number of measuring days, a second possibility to save time would be to take fewer measurements during a day. Detailed diel courses of CO2 exchange offer important insights into an organism's functioning, but if estimating annual budgets were the principal objective of a study one might want to minimize the sampling effort within a day. Indeed, it is seemingly unnecessary to measure detailed diel courses; even when measuring only once every 12 hours, deviations due to the lower sampling frequency will cancel out for most days if enough days are measured. However, on some days the lower sampling frequency can cause extreme deviations from true diel budgets, in particular when one of the few measurements taken coincides with a short but high activity peak, and this can cause large errors in the annual budget estimates. Lowering the sampling frequency below hourly intervals introduced large deviations in diel budgets even for exposed foliage of rainforest trees (Zotz & Winter Reference Zotz, Winter, Mulkey, Chazdon and Smith1996), although these authors did not evaluate the effect of these deviations on annual budget estimates. For L. muralis the error also increases strongly at frequencies below once every 1·5 h. Lower sampling frequencies allow more individuals to be measured during the same day and reduce the disturbance caused by the measurement. For L. muralis, 1·5-hourly sampling may therefore be reasonable for estimating annual budgets, whereas for diel budgets and patterns 0·5-hourly sampling seems preferable (balancing disturbance and temporal resolution), though this can be relaxed at night.
Alternatively, the sampling frequency may be adjusted to the weather conditions, taking into account ‘weather response types’ such as those identified by Lange (Reference Lange2003a). These are characteristic weather-dependent diel CO2-exchange patterns, such as ‘lichen below snow’ or ‘nightly rain, subsequent diurnal drying’. Response types differ markedly in their temporal variability and hence the required sampling frequency. For instance, a lichen below snow requires fewer measurements than a lichen drying after nocturnal rain to obtain a reliable estimate of the diel carbon budget. Weather response types may further represent a useful tool for extrapolating measured diel budgets to other days with similar weather conditions, thereby potentially improving the accuracy of the annual carbon budget estimate. Different types of lichens respond differently to weather conditions, however, so that weather response types should be determined at least for each group of similar species, being defined by growth form and by special features (e.g. gelatinous cyanolichens).
Extrapolation to other species
Lecanora muralis is a crustose lichen that exhibits quick moistening and drying, resulting in very rapid fluctuations in CO2 exchange. Clearly, the diel activity patterns of this species are neither representative for all lichens (Lange Reference Lange2003a) nor are the optimal sampling schemes numerically identical for all lichens or poikilohydric plants. However, even if other lichens may react more slowly than L. muralis, hydration status and the general dependency on weather conditions are of general importance and cause strong fluctuations in activity for all species except those growing in continuously moist habitats. In fact, diel measurements over 106 to 174 days on five other lichen species in the temperate zone, ranging from gelatinous cyanolichens to fructicose green-algal lichens, showed that these were all metabolically active only between 35% and 65% of the time (Lange Reference Lange2000). Lowering the diel sampling frequency may cause less error for slowly-drying species than for fast-drying species such as L. muralis. However, variation in inherent hydration and dehydration kinetics is in the order of hours, so lowering the sampling frequency within a year should have similar effects for slow-drying as for fast-drying species.
Seasonality
Seasonality plays an important role for CO2-exchange patterns of lichens in the temperate zone. This is mainly due to the frequency of occurrence of different weather conditions in the four seasons (Lange Reference Lange2003b) and partly also to the acclimatization of respiration rates to varying temperatures (Lange & Green Reference Lange and Green2005). It is worth noting that the most important aspects of weather conditions were not related to temperature, but to differences in irradiance and, most importantly, precipitation, including dew, fog, and frost (Lange Reference Lange2003a). Seasonal differences are expected to be even more pronounced in the boreal and arctic zones, but should be of lesser importance in the subtropics and tropics. Still, although low latitudes are generally characterized by little thermal seasonality, hydric seasonality is common and of great relevance for lichens of the tropics. In regions with a pronounced dry season, lichens will be mostly inactive during this time, so the annual carbon budget is determined almost exclusively by rainy season conditions. In such a system measurements may arguably be restricted to one season and CO2 exchange may be assumed to be close to zero for the duration of the dry period (Zotz & Schleicher Reference Zotz and Schleicher2003; Zotz et al. Reference Zotz, Schultz and Rottenberger2003), if fog and dew can be excluded as water sources. In regions with a less pronounced dry season, CO2 exchange may take place during the whole year, but the contribution of the seasons may differ considerably. In such systems, it is indispensable to take measurements during both seasons.
The maximum number of diel CO2-exchange patterns that has been measured for a tropical lichen are 15 days for Psydocyphellaria aurata, blocked in one period in the rainy season (Lange et al. Reference Lange, Büdel, Meyer, Zellner and Zotz2004). Although measurements were taken in a lower montane rain forest with little seasonality, the variation in diel budgets was considerable (mean ± SD = 0·38 ± 0·91 mg C gd.wt−1 d−1), indicating that this number of days is not sufficient to estimate the annual budget – which the authors did not attempt either. In a few other studies with similarly small numbers of diel budgets, such estimates were made, in spite of similarly large variation between days (Lange et al. Reference Lange, Büdel, Zellner, Zotz and Meyer1994; Zotz et al. Reference Zotz, Schultz and Rottenberger2003). Lange et al. (Reference Lange, Büdel, Zellner, Zotz and Meyer1994) base their ‘tentative’ estimate on 14 consecutive days in the lower montane rain forest with little seasonality mentioned above. Zotz et al. (Reference Zotz and Schleicher2003), while also recognizing the limitations of their estimate, base it on seven random single days in the rainy season, extrapolating the average diel carbon gain of three individuals to 365 days, but taking into account 4 dry months with no carbon gain or loss. The variation between days in these studies was also considerable: mean ± SD = 2·88 ± 6·04 mg C gd.wt−1 d−1 and 0·14 ± 0·70 mg C gd.wt−1 d−1, respectively, which is higher than for Lecanora muralis (mean ± SD = 0·19 ± 0·43 mg C gd.wt−1 d−1). Due to this high variability and the small sample size, it is unlikely that the annual carbon budget estimates are representative values for these tropical lichens. Even if temporal variability was similar to that in L. muralis, the estimates would have only a 22% (7 single days) and 20% (14 blocked days) probability of being within 25% of the true value (Fig. 3). The value of these studies clearly lies in understanding diel CO2-exchange patterns and dependencies on environmental conditions rather than in predicting long-term balances, although they do show at least the order of magnitude of Aann.
Optimal sampling schemes
Up to now, our discussion has ignored practical considerations of measurement campaigns. For example, although measuring single days spread out throughout the year yields more reliable results, such an approach is simply not practical. Blocked measurements require less travelling and less setting-up of equipment and are therefore more economical and practical than measurements spread throughout the year. How to best distribute a certain number of measuring days over one or many blocks will depend on the weights of effort against required data accuracy for a certain project. It is hard to imagine a project, however, where an estimate of the annual carbon balance would be accepted with a seasonal bias of the magnitude shown here. In temperate zones it may therefore be set as a rule of thumb that at least four measuring periods, well spread over the year, are needed to arrive at a reliable estimate of the annual carbon balance. Such sampling schemes were used, for instance, for the gelatinous cyanolichen Collema cristatum (Lange Reference Lange2000) and the foliose-fructicose Cladonia convulata (Lange & Green Reference Lange and Green2003), with a total of about 110 diel measurements. The annual carbon balances estimated from these measurements were surprisingly similar to that of L. muralis (Lange Reference Lange2003b). Assuming similar temporal variability in these two species as in L. muralis, the estimates have a 64% probability of being within 25% of the true value and a 98% certainty to be within 50% (Fig. 3).
The previous considerations do not consider inter-annual variability. Clearly, even the most accurate estimate of an annual carbon budget has only limited predictive value for other years. Considerable differences between years can actually be deduced from our own data set: L. muralis was studied during two summer seasons, which showed substantial differences in CO2 budgets (Lange Reference Lange2003a).
Alternative methods for estimating carbon budgets
Estimating long-term carbon budgets of lichens and other poikilohydric autotrophs from simple extrapolations of diel carbon budgets does not give very satisfactory results, unless the number of days sampled is very large, which is impracticable in most projects. We therefore discuss some alternative approaches that could improve the quality of the estimate at a given research effort. A first alternative is the common practice to measure growth as a proxy for carbon gain (e.g. Gauslaa et al. Reference Gauslaa, Lie, Solhaug and Ohlson2006; Palmqvist et al. Reference Palmqvist, Dahlman, Jonsson, Nash and Nash2008). In some cases this is even the only possibility, for example in some lichens from Antarctica, where CO2-exchange rates are so low that growth measurements over many years are the only way to gather any information about carbon gain (Sancho et al. Reference Sancho, Green and Pintadoa2007). On the other hand, for some lichens, for example, fully or partially endolithic species, measuring growth is not possible and there is no alternative to gas-exchange measurements (Tretiach & Geletti Reference Tretiach and Geletti1997; Weber et al. Reference Weber, Scherr, Reichenberger and Budel2007). Often both types of measurements are possible, even if precise biomass determinations are often difficult, as in many epilithic species. When measuring growth, parallel CO2-exchange measurements could highlight diel patterns and dependencies on environmental conditions without the need for extensive data sets to obtain a reliable carbon balance estimate.
A second alternative already mentioned involves the use of ‘weather response types’ to adjust the extrapolation to the occurrence of different weather conditions. The application of this method is straightforward in habitats with only one or two dominant weather types, such as the coastal fog desert of Namibia, where days are either dry or have morning fog and dew. Here, CO2 exchange of the lichen Teloschistes capensis was measured during 8 days in autumn and 16 days in spring. Combined with meteorological information about the number of fog days in a year, these measurements should allow a reasonable estimation of the annual carbon balance (Lange et al. Reference Lange, Green, Melzer, Meyer and Zellner2006). But also in more complex climates, days can be classified in weather types and used to extrapolate measured or modelled diel balances (Bruns-Strenge & Lange Reference Bruns-Strenge and Lange1992). To strengthen such extrapolations, additional diel activity patterns could be determined via chlorophyll fluorescence (Schroeter et al. Reference Schroeter, Green, Seppelt and Kappen1992; Heber et al. Reference Heber, Bilger, Bligny and Lange2000; Maxwell & Johnson Reference Maxwell and Johnson2000; Lange Reference Lange2003a). With fluorescence measurements, more individuals can be measured manually during the same day, while the instrumental setup allows for easier automated long-term measurements compared to gas-exchange studies. Such automated fluorometers, even with data transmission via satellite telephone, are currently monitoring lichens, for example, on Livingston Island, maritime Antarctica; (L. G. Sancho and T. G. A. Green, pers. comm.). Fluorescence can only partially predict carbon fixation, due to competing processes such as photorespiration which in lichens increases strongly during suprasaturation depression of CO2 diffusion (Leisner et al. Reference Leisner, Green and Lange1997). However, fluorescence does indicate whether a lichen is metabolically active and can thus help to recognize the typical diel patterns that make up ‘weather responsetypes’. Apart from fluorescence, other parameters may be monitored to also strengthen the extrapolation of measured diel balances. For instance, during “wetting by nocturnal dew or frost” there are good correlations between Adiel, Amax, and the maximum daily hydration level (Lange et al. Reference Lange, Green, Melzer, Meyer and Zellner2006; Lange & Green Reference Lange and Green2008), so that in dew- and fog-dominated areas like coastal fog deserts, thallus hydration levels could be monitored as a proxy for Adiel, although hydration is not necessarily an easy parameter to measure or to estimate either (Coxson Reference Coxson1991; del Prado & Sancho Reference del Prado and Sancho2007).
As a final alternative, CO2 exchange could be modelled as a function of climatic conditions, possibly in connection with weather-type characteristics (Bruns-Strenge & Lange Reference Bruns-Strenge and Lange1992; Sundberg et al. Reference Sundberg, Palmqvist, Esseen and Renhorn1997). This is not an easy task due to the many interdependencies of photosynthetic responses and the complex time course of hydration and its effects on CO2 exchange (Sundberg et al. Reference Sundberg, Palmqvist, Esseen and Renhorn1997; Lange Reference Lange2003b). Still, even a less than perfect model could strongly improve the estimate compared to simple data extrapolation. The last two, mechanistic approaches still make measuring diel CO2-exchange patterns indispensible for defining response types or for model validation. However, by using the suggested more sophisticated extrapolation methods, a given number of diel patterns can yield a long-term estimate of much higher quality.
Conclusion
In conclusion, our analysis provides little optimism that a particular sampling scheme can allow a significant reduction in the necessary effort to obtain reliable estimates of annual carbon budgets from gas exchange measurements for poikilohydric autotrophs. Nevertheless, we identify clear differences among sampling schemes in the likelihood of obtaining reliable estimates with a comparable effort. Using the optimal sampling scheme, one could then, for instance, choose to obtain somewhat less accurate but more representative data by measuring more individual samples. Assuming similar day-to-day variability in other lichens, mosses and liverworts, we suggest that published estimates of annual carbon gain based on a limited number of diel measurements and on a limited number of individual samples should be treated with considerable caution.