Nomenclature
-
 $\psi$
-
percentage of propellant mass burned
-
$\chi$
,
$\lambda$
and
$\mu$
-
characteristic quantities of the propellant shape
-
$e$
-
burned thickness
-
$e_1$
-
arc thickness of the propellant
-
$\mu_1$
-
propellant burning rate coefficient
-
$n$
-
propellant burning rate index
-
$q$
-
leakage gas flow rate
-
$C_V$
-
flow coefficient
-
$A_f$
-
area of the gap
-
$\rho_g$
-
gas density
-
$p_a$
-
air pressure
-
$W_L$
-
mass of the leaked gas
-
$f$
-
propellant force
-
$\omega$
-
mass of the propellant
-
$\varphi$
-
secondary work calculation coefficient
-
$k$
-
adiabatic index
-
$l$
,
$l_p$
and
$l_d$
-
lengths
-
$m_d$
and
$m_p$
-
masses of the move body
-
$r_b$
-
diameters of the sealing band
-
$r$
-
radial movement distance of the sealing band skirt
-
$V$
-
chamber volume
-
$S$
-
area of the gun barrel
-
$\alpha$
-
residual volume of the propellant gas
-
$\rho$
-
density of the solid propellant
-
$a$
-
acceleration
-
$N$
-
normal stress on the contact surface
-
$F$
-
resistance
-
$M$
-
mass of the object
-
$v_d$
and
$v_p$
-
velocities of the projectile and balancing body
-
$E_{CE}$
-
Total chemical energy in the propellant
-
$E_{GI}$
-
Internal energy of propellant gas
-
$E_{wD}$
and
$E_{wp}$
-
kinetic energy of the projectile and balancing body
-
$E_{LQ}$
-
energy loss due to gas leakage


1.0 Introduction
The balanced gun, an essential experimental apparatus for studying penetration dynamics, material responses and coordinated joint warfare operations, employs an equal-caliber barrel design to mitigate barrel erosion from propellant gases and extend barrel longevity. However, this design compromises the seal between the projectile and the chamber, leading to propellant gas leakage and diminished thrust efficiency. The sealing band is pivotal in the mitigating gas leakage, augmenting propellant thrust, and optimising projectile velocity. To enhance chamber sealing performance during the launch process, a self-sealing band has been developed. Despite its importance, research on the sealing mechanisms of equal-caliber self-sealing bands remains insufficient, failing to meet the analytical and design demands of advanced gun weapon systems. Thus, a thorough investigation into these sealing mechanisms is imperative to advance high-performance gun technology.
To explore the sealing mechanisms of self-sealing band, numerous researchers have conducted extensive experimental studies. These include quasi-static engraving experiments [Reference Wu, Fang and Chen1–Reference White and Siewert3], laboratory dynamic impact engraving simulations [Reference Bin and Zheng4, Reference Bin, Zheng and Tian5], engraving experiments under real launching conditions [Reference Elbe and Knouse6, Reference Montgomery7] and friction wear mechanism experiments [Reference Hu, Chen and Cao8, Reference Yin, Zheng and Ni9]. These results provide the valuable reference and practical significance for the study of the sealing process of sealing bands. With the advancement of computational mechanics, numerical simulations based on finite element software and other methods have become important tools for studying the sealing process of sealing bands [Reference Cheng and Wang10–Reference Chen15]. Numerous researchers have conducted extensive numerical simulation studies in this field, with models becoming increasingly sophisticated, evolving from simple two-dimensional models to three-dimensional models capable of describing the complex structures of engraving systems. In these studies, the base pressure data of the projectile, acting as an active load, is typically pre-computed using classical interior ballistics equations [Reference Chen and Leach16–Reference Xu and Chen20]. Some researchers have coupled the interior ballistics programme with the structural response of the projectile and gun through an amplitude-customised subroutine interface for computational analysis [Reference Lu, Jiang and Cheng21–Reference Xiaoting, Yong and Hao30]. Although the existing modeling approaches provide a good reference for solving the dynamic response of the sealing process of sealing bands, current models still consider a limited number of factors, and the interior ballistics models involve numerous simplifications. For example, while some researchers have studied the leakage issues associated with sealing bands [Reference Jia, Wang and Zhao31–Reference Huang33], the impact of changes in assembly gaps during the sealing process has not yet been considered. This oversight is significant because variations in assembly gaps can affect the effectiveness of the seal and ultimately influence the overall performance of the sealing bands. Therefore, although the loads obtained from theoretical calculations closely approximate actual conditions, there is an urgent need to address load accuracy issues in the numerical modeling of the dynamic behaviour of sealing bands to ensure the accuracy and reliability of the simulation results. Based on this, this study employs a combination of experimental research and numerical simulation to establish a more comprehensive and refined coupling method for investigating the sealing mechanisms of self-sealing nylon bands in balanced gun.
This study focuses on the self-sealing band of a 65 mm short-barrel balanced gun and optimises classical interior ballistics theory while considering leakage mass. By developing an interior ballistics programme, the combustion process of the propellant in the chamber was simulated, and numerical simulation analysis was conducted using Abaqus finite element software. The interior ballistics programme was coupled with the dynamic calculation process through an amplitude-customised subroutine (VUAMP), thereby establishing a coupled computational model for the classical interior ballistics process and the mechanical interaction between the projectile and gun. This research aims to study the sealing mechanisms of self-sealing band in balanced guns of uniform caliber and further analyse the effects of varying propellant charges and different assembly gaps on the sealing performance. This will help address experimental challenges associated with large-caliber balanced guns and provide important references for the design of self-sealing band in subsequent equal-caliber balanced gun.
2.0 Mathematical model
This study focuses on the launch process of short-barreled equal caliber balanced guns, which can be primarily divided into two parts. The first part involves the response process of the projectile and the gun structure, while the second part pertains to the combustion process of the propellant, different gas equations of state are applicable under high-pressure conditions in the barrel [Reference Silva and Dias34, Reference Cheng and Tao35]. This study employs the Nobel-Abel equation of state to characterise the PVT relationship of gases within the combustion chamber [Reference Li, Wang and Chen36, Reference Li and Wang37]. To enhance classical interior ballistics theory by considering leakage mass, a coupled computational model has been established. This model describes the interaction between the classical interior ballistics process and the mechanical interactions between the projectile and the gun. Given the complexity of the entire coupling process, it is essential to construct predictive and control equations. To simplify the model, the following assumptions are made regarding the response process of the projectile and gun structure:
-
1) The temperature stress field of the barrel is neglected.
-
2) The gun barrel and projectile materials are elastic steel, while the band material is elastic-plastic nylon.
-
3) The influence of aerodynamic drag on the projectile is neglected.
-
4) It is assumed that there is no heat exchange between the balancing body, projectile and gun barrel, and that the launch process is an adiabatic process.
At the same time, in order to simplify the calculation process of propellant combustion, the following assumptions are made:
-
1) It is assumed that the combustion of the propellant follows the geometric burning law and the exponential burning rate law.
-
2) It is assumed that the combustion of the propellant and the motion of the projectile occur under average pressure conditions.
-
3) It is assumed that all ignited composition burns out instantaneously, igniting the entire surface of the propellant at that moment.
-
4) Throughout the entire launch process, the gas composition of the propellant combustion gases remains constant, and all characteristic quantities related to the properties of the propellant (such as propellant force, gas constant, and specific heat ratio) remain unchanged.
-
5) It is assumed that there is no heat loss during the launching process, and that heat dissipation through the gun barrel is considered in an indirect correction form.
2.1 Theoretical model
Based on the classical interior ballistics model and incorporating leakage mass considerations, this paper constructs a more refined version of the classical interior ballistics model. The model divides the interior ballistics equations into two parts: the combustion process of the propellant inside the chamber and the response of the projectile and gun structure. The equations governing the combustion of the propellant in the chamber are as follows:
 \begin{align}\left\{ {\begin{array}{*{20}{c}}{\psi = \chi Z\left( {1 + \lambda Z + \mu {Z^2}} \right)}\\[3pt]{\frac{{d{\rm Z}}}{{dt}} = \left\{ {\begin{array}{*{20}{c}}{\frac{{{\mu _1}}}{{{e_1}}}{p^n}}\, {}{{\rm Z} \lt 1}\\[3pt]0 {}\,{{\rm Z} \ge 1}\end{array}} \right.}\\[3pt]{q = {C_V}{A_f}\sqrt {\frac{{2\left( {p - {p_a}} \right)}}{{{\rho _g}}}} }\\[3pt]{\frac{{d{W_L}}}{{dt}} = {\rho _g}q}\\[3pt]{px = f\left( {\omega \psi - {W_L}} \right) - \frac{{k - 1}}{2}\varphi \left( {{m_d}v_d^2 + {m_p}v_p^2} \right)}\\[3pt]{{A_f} = \pi {R^2} - \pi {{\left( {{r_b} + r} \right)}^2}}\end{array}} \right.\end{align}
where
 $x$
and the gas density equation are given by:
 \begin{align*}x = V - \frac{{\omega \left( {1 - \psi } \right)}}{\rho } - \alpha \left( {\omega \psi - {W_L}} \right) + S\left( {l + {l_d} + {l_p}} \right)\end{align*}
 \begin{align*}{\rho _g} = \frac{{\omega \psi - {W_L}}}{{S\left( {l + {l_d} + {l_p}} \right)}}\end{align*}
In the equation:
 $\psi \;$
is the percentage of propellant mass burned;
 $\chi $
,
 $\lambda $
and
 $\mu $
are characteristic quantities of the propellant shape;
 $Z = e/{e_1}$
represents the relative thickness, which is the ratio of the burned thickness
 $e$
to the arc thickness of the propellant
 ${e_1}$
;
 ${\mu _1}$
is the propellant burning rate coefficient;
 $n$
is the propellant burning rate index; q is the leakage gas flow rate between the projectile, balancing body and gun barrel;
 ${C_V}$
is the flow coefficient;
 ${A_f}\;$
is the area of the gap;
 ${\rho _g}$
is the gas density;
 ${p_a}$
is the air pressure in front of the projectile and balancing body, taken as atmospheric pressure;
 ${W_L}$
is the mass of the leaked gas; p is the chamber pressure;
 $f$
represents the propellant force;
 $\omega $
represents the mass of the propellant;
 $\varphi \;$
is the secondary work calculation coefficient;
 $k$
is the adiabatic index;
 $l,{l_p}$
and
 ${l_d}$
represent the lengths of the chamber volume reduction, projectile motion distance and balancing body motion distance, respectively;
 ${m_d}$
and
 ${m_p}$
are the masses of the projectile and balancing body, along with the external recovery device;
 ${v_d}$
) and
 ${v_p}$
are the velocities of the projectile and balancing body, respectively;
 ${r_b}$
and
 $r$
are the diameters of the sealing band and the radial movement distance of the sealing band skirt, respectively; V is the chamber volume;
 $S$
is the internal cross-sectional area of the gun barrel;
 $\alpha $
is the residual volume of the propellant gas;
 $\rho $
is the density of the solid propellant.
The second part is used to control the structural response under the interior ballistics load. Due to the interaction issues of the projectile-gun structure being a problem of strong nonlinear coupling, all analyses are based on a significant number of simplifying assumptions. To establish an accurate response of the projectile-gun structure, the motion equations of the projectile and balancing body, as well as the velocity-displacement relationships in the improved classical interior ballistics equations, are solved in real-time using Abaqus software, as shown in Equation (2).
 \begin{align}a = \frac{{pS - {\mu _s}N - F}}{M}\end{align}
In the equation:
 $a$
is the acceleration;
 ${\mu _s}\;$
is the coefficient of friction; N is the normal stress on the contact surface; F is the resistance, excluding frictional resistance; M is the mass of the object.
To obtain the dynamic parameters of the projectile and balancing body in real-time, as well as the radius parameters for the movement of the sealing band skirt, which are involved in the coupling calculation. In the Abaqus software, multiple sensors are set up at the base of the projectile, the balancing body, and both sides of the sealing band skirt to obtain the displacements
 ${l_p}$
and
 ${l_d}$
, as well as the velocities
 ${v_d}$
and
 ${v_p}$
of the projectile and balancing body, along with the radius r of the skirt movement.
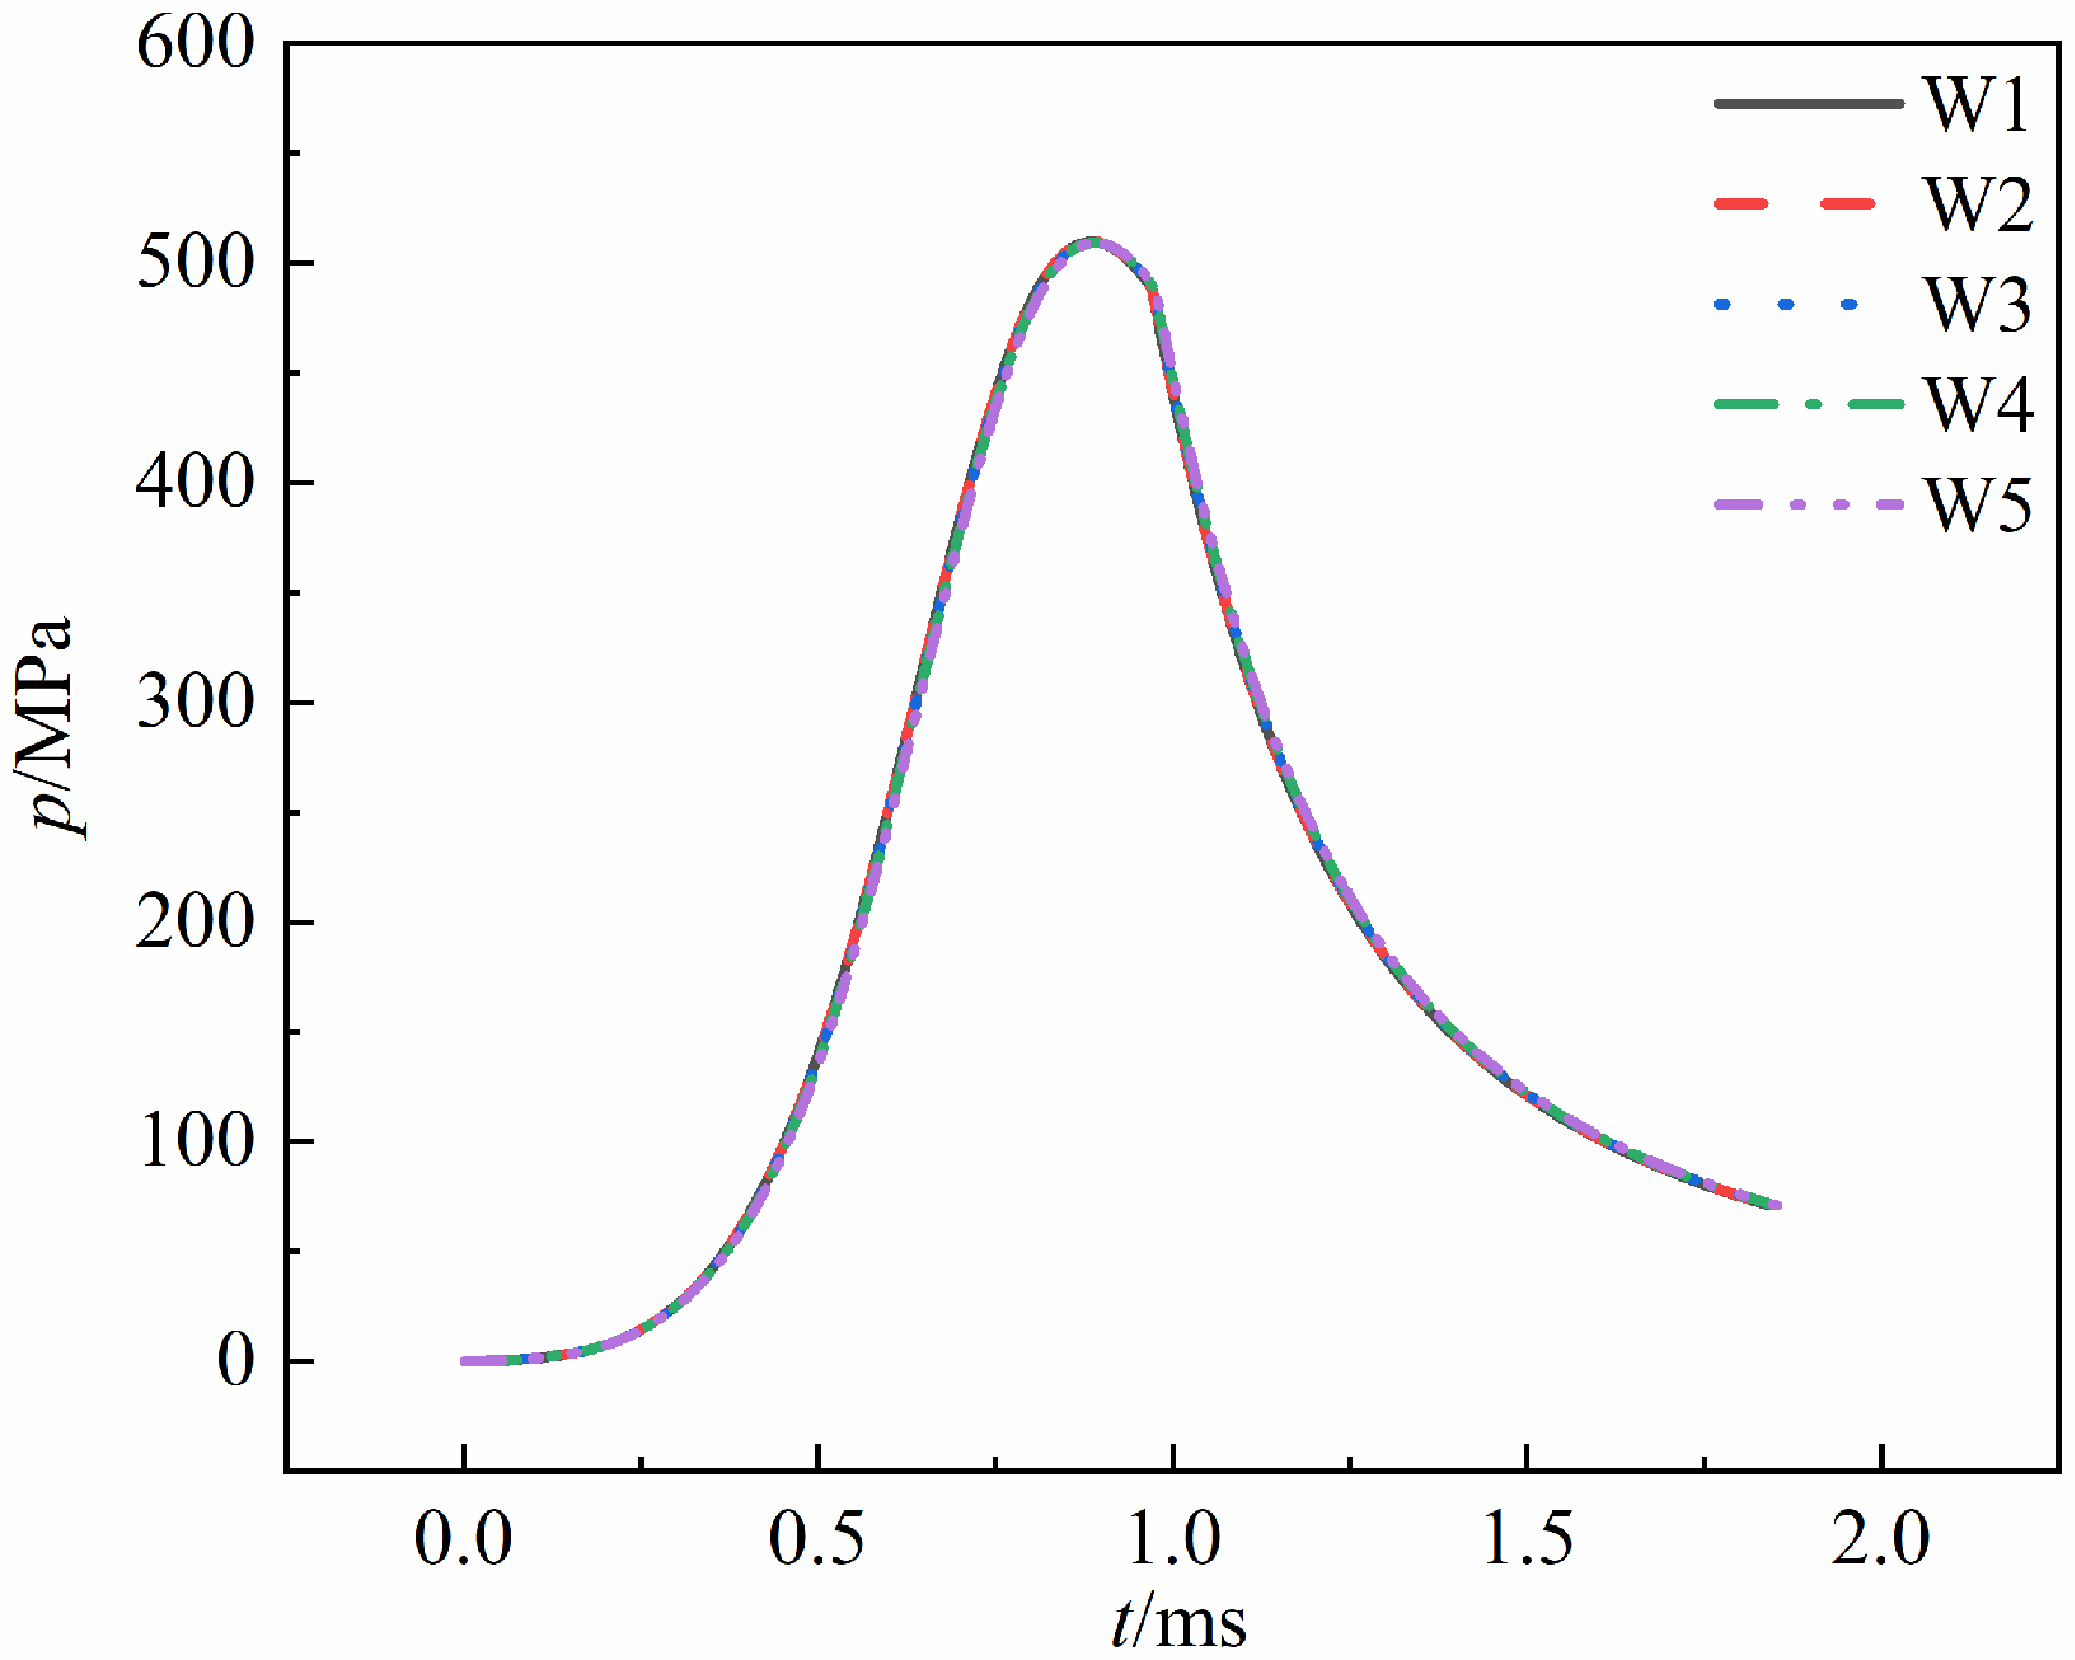
Chamber pressure under different mesh sizes.

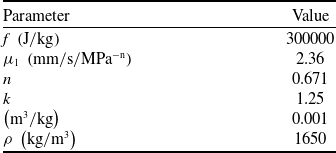
Calculated material parameters

2.2 Finite element model
According to the structural dimensions of the experimental apparatus, the short-barrel gun system is modeled as consisting of multiple components: the gun barrel, projectile, balancing body, sealing band and external recovery device. Each of these structures is represented using hexahedral elements. To ensure computational accuracy, the meshing in the sealing band region is refined. In contrast, due to the relatively high rigidity of the gun barrel and projectile compared to the sealing band, their meshes can be set relatively rough.
The stable time step in the finite element calculation is governed by the mesh size, which is determined using a trial-and-error approach. As the chamber pressure is the critical parameter in the coupled model, it is selected as the evaluation metric. The mesh sizes of the sealing band and barrel predominantly influence the results. Thus, these are prioritised for refinement. Figure 1 compares chamber pressures under different mesh sizes: W1 (sealing band: 0.4 mm, barrel: 3 mm), W2 (0.5 mm, 4 mm), W3 (0.6 mm, 5 mm), W4 (0.7 mm, 6 mm) and W5 (0.8 mm, 7 mm). The results exhibit negligible variations. Considering computational costs, the sealing band mesh (0.6 mm) and barrel mesh (5 mm) in W3 are selected as the optimal configuration. The final model comprises 799,992 elements, 862,368 nodes and uses C3D8R element types.
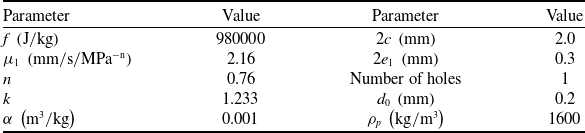
The material parameters related to the gun barrel, projectile, and balancing body are presented in Table 1. The sealing band is made of MC nylon, chosen for its cost advantages relative to other metallic materials while effectively meeting the requirements for gas sealing performance. Considering that the sealing band may undergo significant plastic deformation and damage evolution during the sealing process, it is essential to define the elastoplastic characteristics and damage models of the material. The mechanical properties of MC nylon are referenced from the data provided in [Reference Chen23]. The Poisson’s ratio of MC nylon is 31.9 GPa, which is about 10 times higher than that of the ordinary nylon [Reference Xiaoting, Yong and Hao30, Reference He, Tian and Yu38–Reference Wang, Wang and Zhang40]. Because the ordinary nylon has insufficient strength and cannot reliably seal the gas, the MC nylon with the higher strength is chosen as the material for the sealing band. The damage model utilises a combination of ductile and shear damage approaches to accurately simulate the failure behavior of the sealing band. In the MC nylon material model, the failure strain is set to 0.6. When the strain of any material element exceeds this threshold, that element will be automatically removed from the simulation. For contact modeling, a general penalty contact approach is employed, with the coefficient of friction between the gun barrel and the sealing band set to 0.15. The propellant used in this study consists of black powder mixed with 3/1 camphor powder, with the relevant propellant parameters detailed in Tables 2 and 3.
Performance parameters of black powder

Performance parameters of 3/1 camphor powder

2.3 Coupling strategy
To simulate the entire launching process of the short-barrel, equal-caliber balancing gun, a pressure load generated from the combustion of the propellant needs to be applied at the base of the projectile, the bottom of the balancing body and the wall of the sealing band.
In Abaqus software, the VUAMP user subroutine can be used to write the combustion process of the chamber and calculate the loads applied to the projectile, balance body and sealing band. As the programme progresses to the next time step, the subroutine obtains the current displacement and velocity of the projectile and the balancing body through sensors, as well as the moving radius of the self-sealing band’s skirt. Then, this information is fed back into the interior ballistics programme for amplitude calculations. The calculated pressure is transmitted as the amplitude to the actuator that begins the next step, and the actuator applies it to the model, thus completing one cycle. When the termination criteria are met, the programme halts its calculations. The entire coupling calculation process is illustrated in Fig. 2.
Flowchart of the coupling strategy.

3.0 Numerical Simulation and Experimental Verification
3.1 Numerical simulation
Figure 3 shows the stress contour plot at a certain moment for the assembly, which includes the balancing body, sealing band and projectile. Region 1 refers to the sealing band on the side of the balancing body, while Region 2 refers to the sealing band on the side of the projectile.
Stress contour plot at a certain moment.

Figure 4 displays the stress nephogram for Regions 1 and 2 from Fig. 3, illustrating the sealing process of the sealing band. It can be seen from the figure that as the applied load increases, the stress in the sealing band also continuously rises. The process of the sealing band fitting against the gun barrel represents the sealing process, which has a relatively short duration. In the initial stage of sealing, the stress at the top end of the sealing band’s skirt is relatively high. Under the applied load, the top end of the skirt gradually fits against the gun barrel. As the applied load increases, the area of contact between the skirt portion of the sealing band and the gun barrel continuously expands until the entire skirt section is in close contact with the gun barrel. At this point, the gas cannot escape through the assembly gap between the sealing band and the gun barrel, achieving optimal sealing effectiveness.
Sealing evolution diagram of the sealing band.

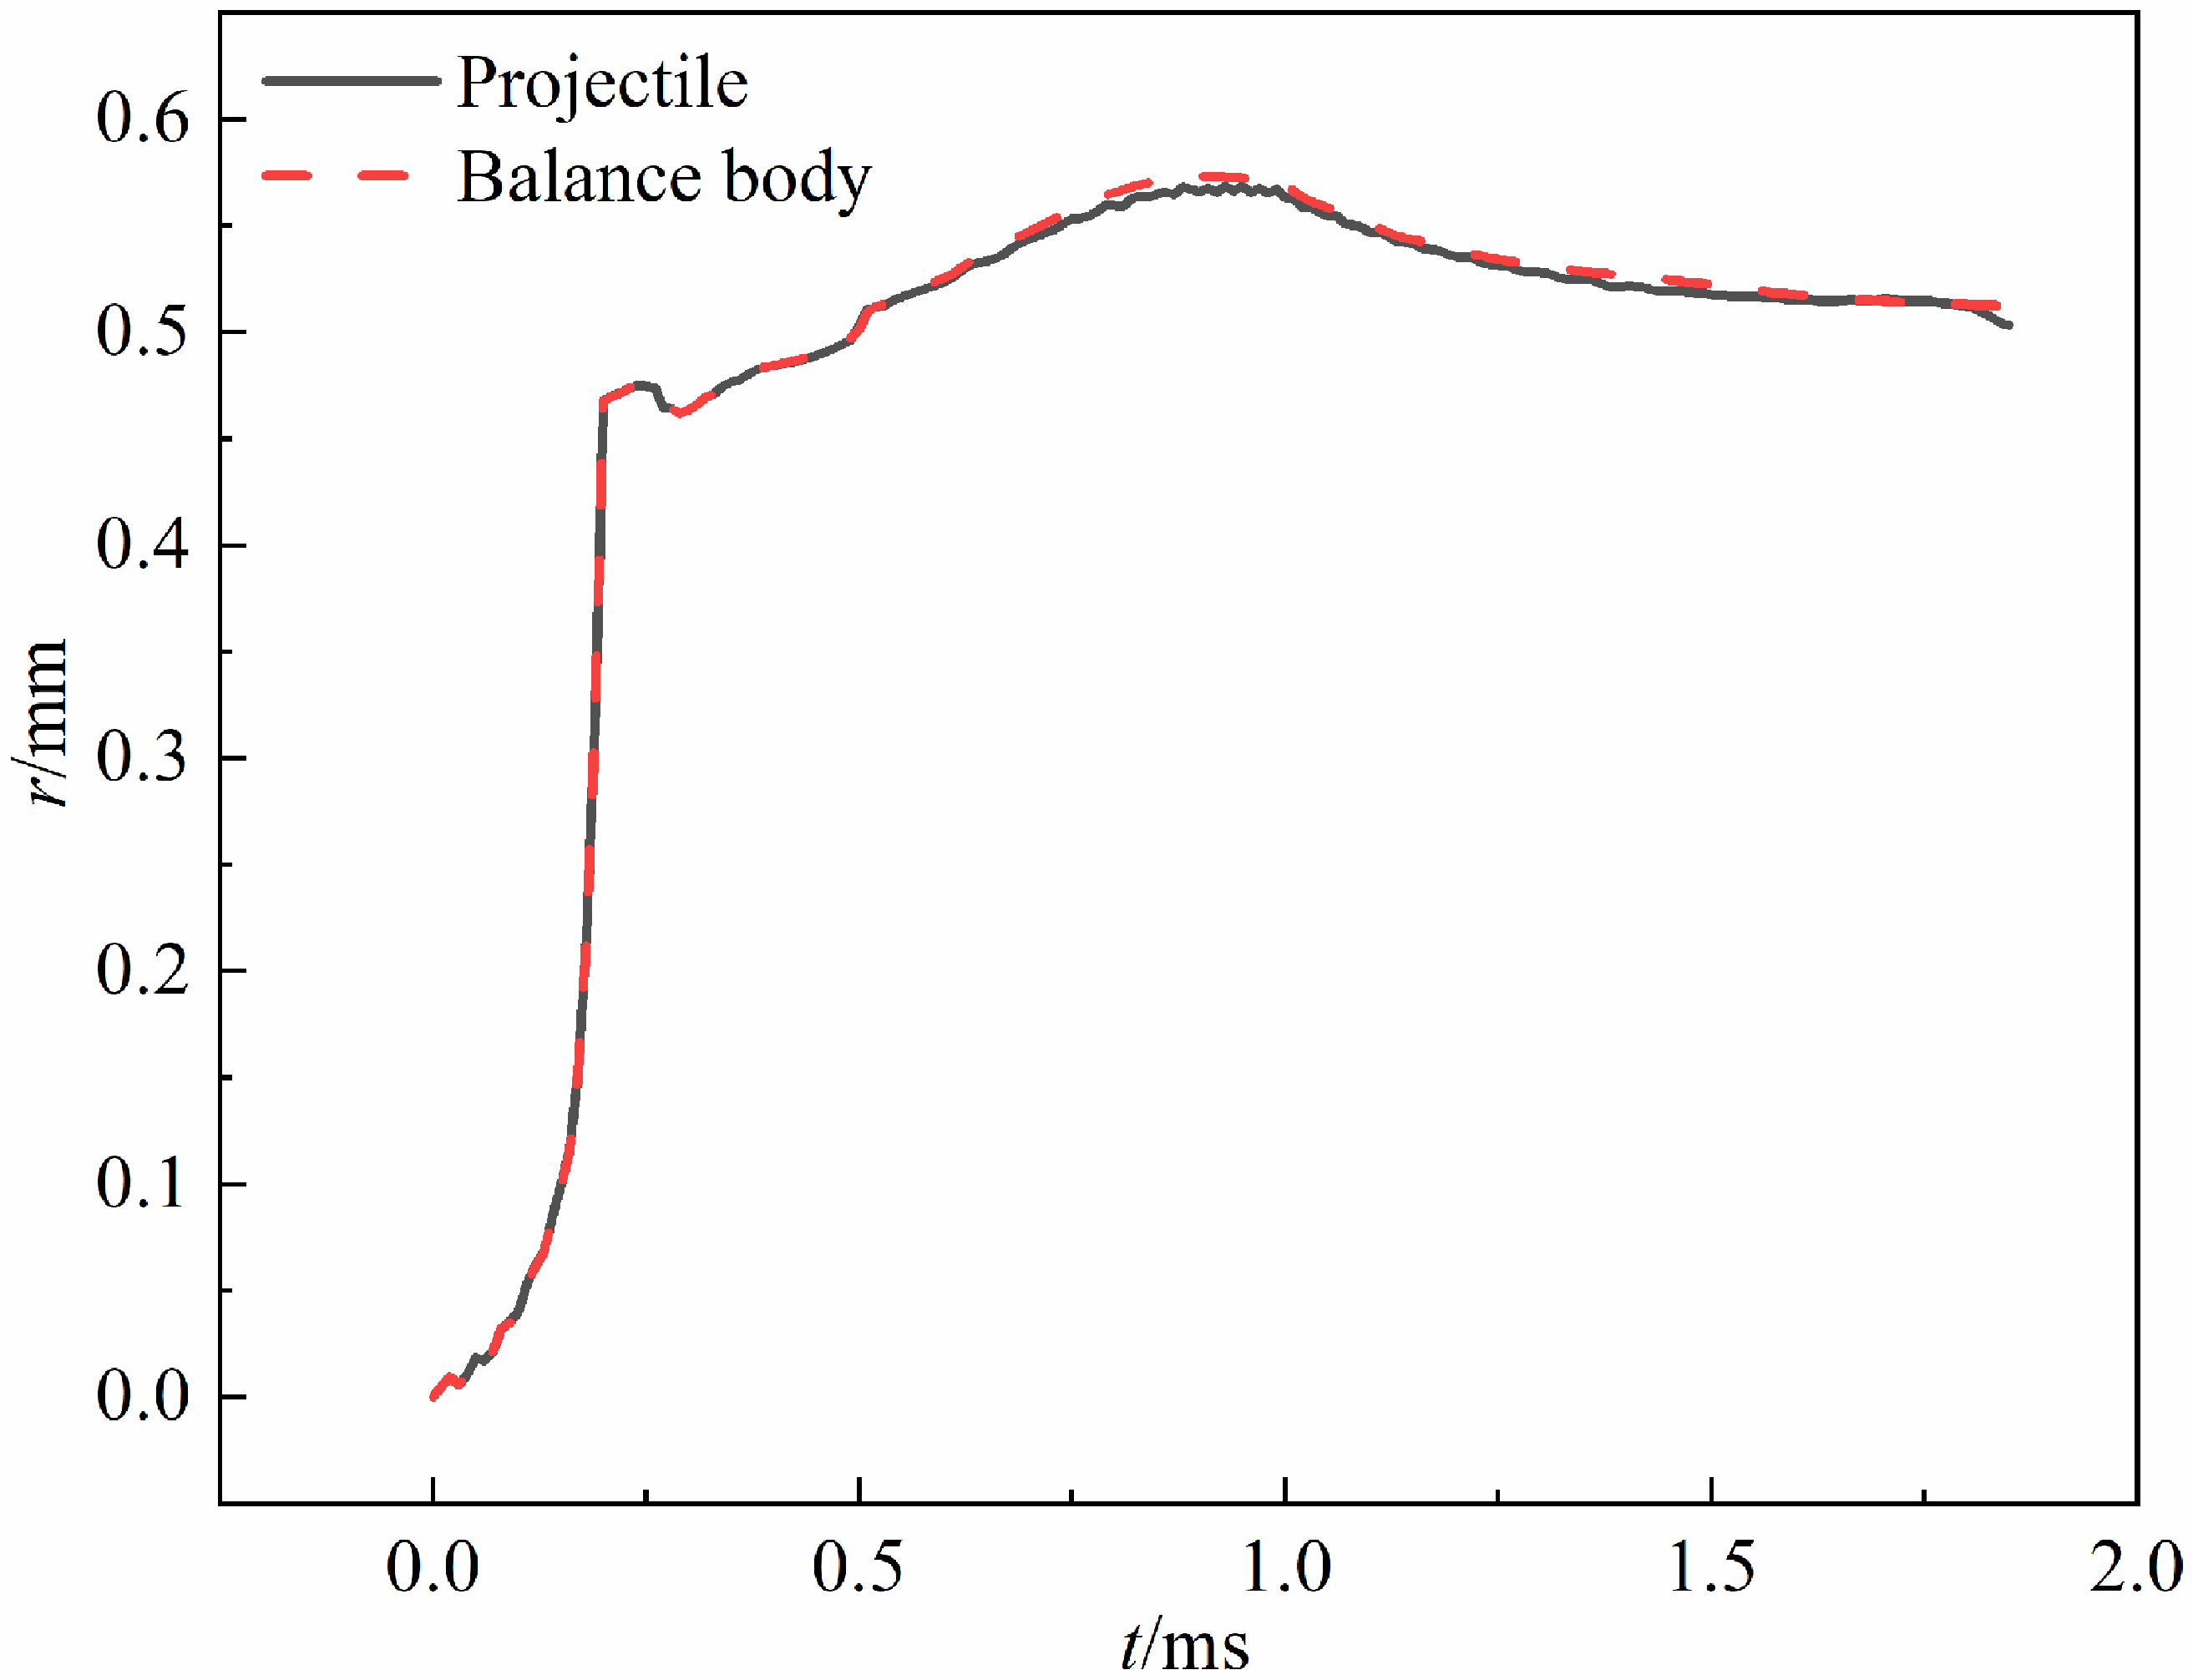
Figure 5 illustrates the schematic diagram showing the numbering of different observation points on the sealing band. Figure 6 presents the radial displacement of different observation points on the skirt of the sealing band. Figure 6 allows for a more intuitive observation of the entire sealing process, particularly the radial evolution of different observation points on the skirt of the sealing band. The data indicate that between 0 ms and 0.48 ms, the overall radial displacement trend of the upper and lower observation points of the sealing band is consistent. During the period from 0 ms to 0.35 ms, the radial displacement distances of the observation points, transitioning from A, B, C and D to A7, B7, C7 and D7, gradually decrease. This indicates that as the tail skirt section approaches the central position, its upward velocity decreases. Within this time frame, the observation points at which the upward rate of movement slows correspond to progressively smaller radial displacements. During this time period, the radial displacement distances of the observation points on the sealing band, corresponding to the moments of reduced upward rate, gradually decrease.
Schematic diagram of observation.

Radial deformation of barrel radius points on the sealing band.

Between 0.35 ms and 0.48 ms, the radial displacement distances of the observation points A, B, C, D, A1, B1, C1 and D1 on the sealing band begin to decrease compared to those of other observation points. After 0.48 ms, there is a significant difference in the radial displacement between the upper and lower observation points of the sealing band. For the upper observation points, the presence of the gun barrel restricts the upper section of the sealing band, causing it to closely conform to the gun barrel. In contrast, the lower section, which is not restricted by the gun barrel, undergoes compressive deformation due to the continuous loading conditions. After 0.9 ms, as the applied load begins to decrease, the amount of compression also diminishes. The displacement differences observed at various points on the lower side can be attributed to the varying distances from the fixed point, which results in different magnitudes of applied forces.
Furthermore, after 1.81 ms, the radial displacement of the upper side of the sealing band on the projectile side tends to move away from the gun barrel, in contrast to the sealing band on the balance body side. This phenomenon occurs because, under conditions of higher projectile velocity and reduced loading, the increased forward tension causes the axial force to exceed the upward radial force applied to the sealing band, resulting in the observed movement away from the gun barrel. The maximum radial displacement shown in the figure corresponds precisely to the maximum pressure point of the coupled simulation calculation curve.
Figure 6 shows the radial deformation of the barrel at three different positions. Point 1 indicates the radial displacement at the maximum pressure point, with the maximum deformation of the barrel being 0.067 mm, which corresponds to the maximum displacement on the upper side of the sealing band in Fig. 7. In Fig. 7(c) and (d), it can be observed that after 1.28 ms, the trend of the curves diverges significantly, with observation points on the sealing band at the projectile side starting from C1 exhibiting an upward movement trend. This phenomenon is even more pronounced in Fig. 7(a) and (b). Figure 8 illustrates the thickness changes of the sealing band tail skirt at different observation points over time. When the thickness is less than 1 mm, it indicates that the sealing band has undergone compression under the applied load. When the thickness exceeds 1 mm, it indicates that the sealing band has exhibited a ‘bulging’phenomenon. The reason for this is that the balanced body and the projectile move to different positions relative to the gun barrel at the same time. The varying distances to the centroid of the gun barrel result in different deformations of the gun barrel under the same applied load, leading to differing outcomes.
Corresponding radial displacements of different observation points. (a) Radial displacement of observation points on the sealing band at the balance body side. (b) Radial displacement of observation points on the sealing band at the projectile side. (c) Radial displacement of observation points on the lower sealing band at the balance body side. (d) Radial displacement of observation points on the lower sealing band at the projectile side.

Thickness of the sealing band tail skirt at different observation points. (a) Balance body side. (b) Projectile side.

3.2 Experimental verification
To validate the accuracy of the model, it is necessary to design effective experiments to verify the coupled model.
3.2.1 Experimental apparatus
A 65 mm short-barrel balance gun launch apparatus is used in this experiment. The schematic diagram of the designed launch apparatus, projectile and balance body is shown in Fig. 9. Figure 9(a) presents the experimental apparatus of the balance gun, which is equipped with a reusable external recovery device. The recovery device measures 1 meter in length, has an outer diameter of 130 mm, and weighs 104 kg. Figure 9(b) displays the three-dimensional assembly diagram of the apparatus, excluding the external recovery device. Figure 9(c) presents the experimental schematic diagram of the projectile and the balance body. Figure 9(d) shows the schematic diagram of the newly designed self-sealing band structure, which consists of three sections: the tail skirt, the middle section, and the fixed section. In the self-sealing band, the tail skirt section is located on the left side and features a rectangular design with a relatively thin thickness. Under the action of high-pressure gas within the chamber, the tail skirt can quickly lift and closely adhere to the gun barrel, ensuring effective sealing in the initial stage. The thickness of the tail skirt is H, and the width is L. The middle section has a trapezoidal design, with its inner wall inclined at a certain angle relative to the axis, thereby increasing the effective area of interaction between the inner wall of the sealing band and the high-pressure gas in the chamber. The fixed section serves as the assembly point between the sealing band and the projectile, ensuring the stable operation of the sealing band. The thickness of the fixed section is H1, and the width is L1. The propellant scheme used in the experiment consists of a combination of 5 g black powder and 180 g of 3/1 camphor powder.
Experimental apparatus diagram. (a) 65 mm short-barrel balance gun launch apparatus. (b) Three-dimensional assembly diagram. (c) Projectile and balance body experimental apparatus. (d) Self-sealing band structure.

Figure 10 shows the 65 mm equal-caliber balance gun experimental apparatus, which consists of the balance gun experimental launch apparatus, high-speed camera, six-channel synchronous trigger, pressure sensor, transient data recorder and protective wall.
Experimental arrangement diagram.

3.2.2 Experimental system
The experimental system for the launching study of the 65 mm short-barrel equal-caliber balance gun comprises two distinct components: the imaging technology and the sensor measurement technology. First, a projectile motion parameter measurement system utilises the high-speed imaging technology, which integrates a high-speed digital camera (maximum resolution: 1280 × 240 pixels, frame rate: 10,000 fps) with image processing software to capture and analyse muzzle velocity. Second, a dynamic pressure measurement system employing piezoelectric pressure sensors and a transient data recorder to acquire in-bore pressure profiles at the measurement port. During the experiment, the high-speed camera is orthogonally aligned with the ballistic trajectory for optimal imaging, while the pressure sensor is directly mounted in the measurement hole with shielded cabling for the signal integrity. All acquired data undergo post-experiment processing to extract key ballistic parameters.
3.2.3 Comparison of numerical simulation and experimental results
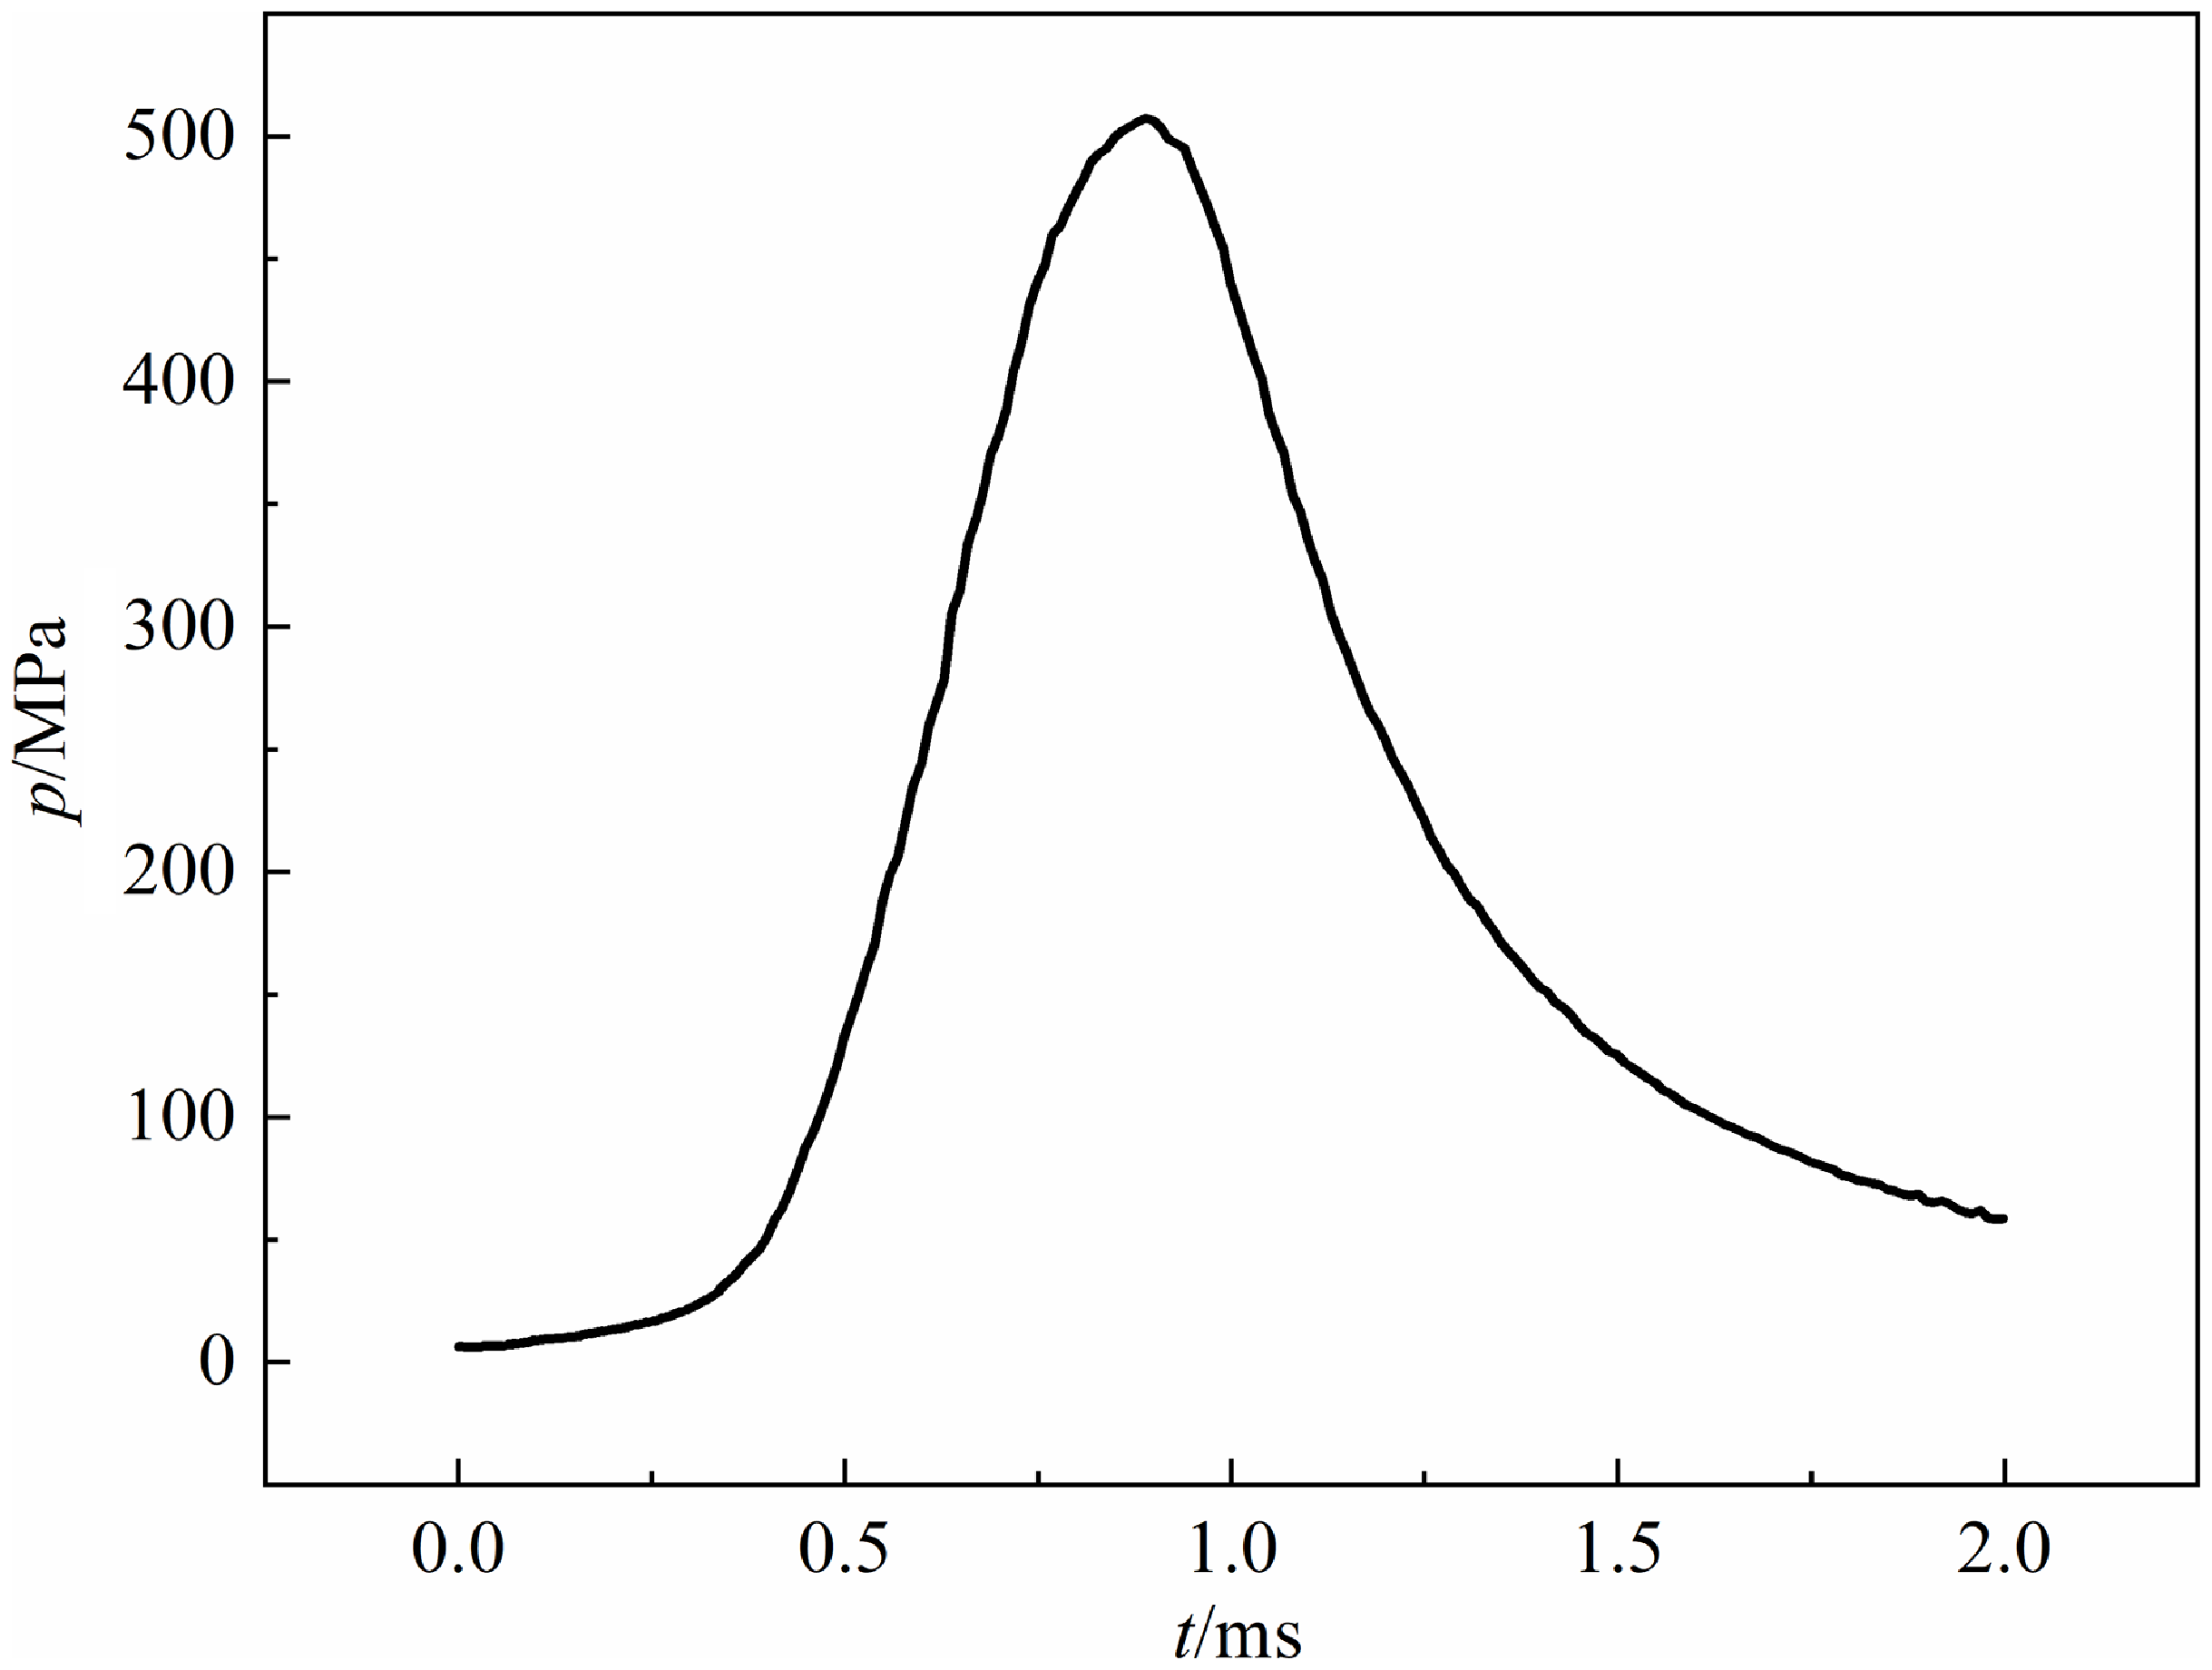
Figure 11 shows the combustion chamber pressure curve at Test Point #1 during the balance gun launching experiment. The maximum chamber pressure value is 507.47 MPa at 0.89 ms.
Experimental pressure curve.

Figure 12 shows the moment the projectile exits the muzzle as captured by the high-speed camera. After data processing, the muzzle velocity is recorded as 485 m/s.
High-speed experiment.

The coupled model is divided into two parts: the simulation and calculation process of the combustion of the propellant inside the chamber, and the structural dynamics calculation process of the projectile-gun structure response. In order to verify the accuracy of the structural dynamics parameter settings, this paper applies the experimental pressure curve to the base of the projectile, the bottom of the balance body, and the wall of the obturator using an amplitude table in ABAQUS software, and validates the results against the projectile’s muzzle velocity. This method is referred to as the pressure boundary method in this paper. Figure 13(a) shows the projectile velocity and displacement curve obtained from the simulation based on the pressure boundary method. From the figure, it can be seen that at a distance of 0.42 m, the velocity of the projectile is 485.96 m/s, thereby validating the accuracy of the structural dynamics parameter settings.
Velocity-displacement curve. (a) The pressure boundary method. (b) The coupled method.

Figure 13(b) shows the projectile velocity and displacement curve obtained from the simulation of the coupled model. From the figure, it can be observed that at a distance of 0.42 m, the velocity of the projectile is 482.8 m/s. This value shows a small error compared to the muzzle velocity of 485 m/s obtained from high-speed measurements in the experiment. Thus, this result validates the accuracy of the coupled model.
Figure 14 shows the comparison curve of classical interior ballistic calculated pressure, coupled model simulated pressure and experimentally measured pressure under the condition of no leakage. From the figure, it can be seen that the pressure curve calculated by the coupled model is closer to the experimental pressure curve. The difference between the maximum pressure point obtained from the coupled model and the maximum pressure value measured in the experiment is smaller compared to the pressure difference derived from the classical interior ballistic calculations, and it nearly coincides with the experimental maximum pressure point. This indicates that the simulation results of the method are in good agreement with the experimental results, thereby validating the accuracy of the coupled method model. It also shows that although the amount of leakage is small, it still has an impact on interior ballistic performance. Therefore, the coupled computational model established in this paper, which takes into account the leakage amount during the classical interior ballistic combustion process and the mechanical interaction process between the projectile and the gun, is more comprehensive and offers higher precision.
Pressure curve.

Figure 15 compares the energy variables within the system:
 ${E_{CE}}$
(total chemical energy in the propellant),
 ${E_{GI}}$
(internal energy of propellant gas),
 ${E_{wD}}$
and
 ${E_{wp}}$
(kinetic energy of the projectile and balancing body), and
 ${E_{LQ}}$
(energy loss due to gas leakage, 63.4 J). Though
 ${E_{LQ}}$
constitutes a minor proportion of the total energy, Fig. 14 demonstrates its non-negligible impact on the results.
Comparison of energy variables within the system.

3.3 Analysis of sealing gas mechanism
The equal-caliber experimental apparatus studied in this paper employs a sealing band. This design differs from the common interference fit of the sealing band. Therefore, it is particularly important to study the leakage amount of the sealing band skirt when it is not fully in contact. Figure 16 shows the maximum radial displacement at observation points at the same time. From the figure, it can be observed that under load, the tail skirt of the sealing band deforms to compensate for the clearance gap between the sealing band and the chamber. When the sealing band makes contact with the inner wall of the barrel, the propellant gas no longer leaks.
Radial displacement distances at observation points A and D of the sealing band.

Figure 17 shows the curve of the calculated gas flow rate and the volume of leaked gas. From the figure, it can be observed that the maximum gas flow rate on both the projectile side and the balancing body side is 0.079 m3/s, and the total volume of gas leaked from both sides is 28.45 cm3. Between 0.48 ms and 1.86 ms, the gas flow rate is 0, indicating that the overall sealing performance of the sealing band is optimal during this period.
Gas flow rate and volume of leaked gas. (a) The projectile side. (b) The balance body side.

Figure 18 shows the resistance curves of the sealing band on the projectile side and the balancing body side, where F 1 represents the resistance on the projectile side and F 2 represents the resistance on the balancing body side. From the figure, it can be observed that between 0 and 1.82 ms, the trends of the two curves are basically consistent. However, after 1.05 ms, the resistance on the projectile side begins to be approximately 2 kN lower than that on the sealing band side. After 1.82 ms, the resistance on the projectile side decreases significantly, mainly because the projectile has been ejected from the front of the barrel, resulting in a rapid reduction in friction, which in turn lowers the total resistance.
Resistance curve.

4.0 The Impact of Propellant Charge and Assembly Gaps on Interior Ballistic Performance
The impact of gas leakage on interior ballistic performance is discussed under different propellant charges and assembly gaps, based on the high-precision coupled method established in the previous text.
4.1 Effects of different propellant charges
Different propellant charges directly affect the chamber pressure, which in turn influences the gas leakage and interior ballistic performance. As shown in Fig. 19, the effects of different propellant charges on the resistance of the projectile and balancing body are significant. This is because as the propellant charge increases, the load exerted on the sealing band also rises, increasing the normal stress between the sealing band and the barrel. Additionally, the rheological properties of the MC901 nylon sealing band can lead to an increase in the contact area with the barrel, further augmenting the resistance. For example, the maximum resistance value at a propellant charge of 0.2 kg is 81% higher than that at a propellant charge of 0.16 kg.
Resistance curves for different propellant charges.

Figures 20 and 21 illustrate the effects of different propellant charges on chamber pressure and projectile velocity, respectively. It can be observed that an increase in propellant charge leads to a corresponding rise in chamber pressure as well as muzzle velocity. When the propellant charge is 0.2 kg, the maximum chamber pressure increases by 65.13% compared to that at a charge of 0.16 kg, while the muzzle velocity improves by 16.61%. Thus, it can be concluded that by adjusting the propellant charge parameter, the maximum pressure is more easily controlled compared to the muzzle velocity. This is attributed to the fact that the motion of the projectile is dictated by both the base pressure and the resistance acting upon it, and this motion directly influences the volume of the combustion chamber, consequently affecting the pressure. Consequently, when the resistance increases significantly, the rate of expansion of the combustion chamber volume is relatively slow, while the pressure rises sharply.
Pressure curves for different propellant charges.

Velocity curves for different propellant charges.

Figures 22 and 23 respectively illustrate the effects of varying propellant charges on gas flow rate and the volume of leaked gas. From these two figures, it can be concluded that the propellant charge has a negligible effect on the maximum gas flow rate. However, it significantly influences the volume of leaked gas. With the increase in propellant charge, the volume of leaked gas gradually decreases. This phenomenon occurs because a larger propellant charge generates a corresponding rise in pressure, which increases the load acting on the sealing band’s tail skirt. As a result, the engagement of the sealing band with the barrel occurs earlier, leading to a reduction in the volume of leaked gas.
Gas flow rate curves for different propellant charges.

Gas leakage mass for different propellant charge.

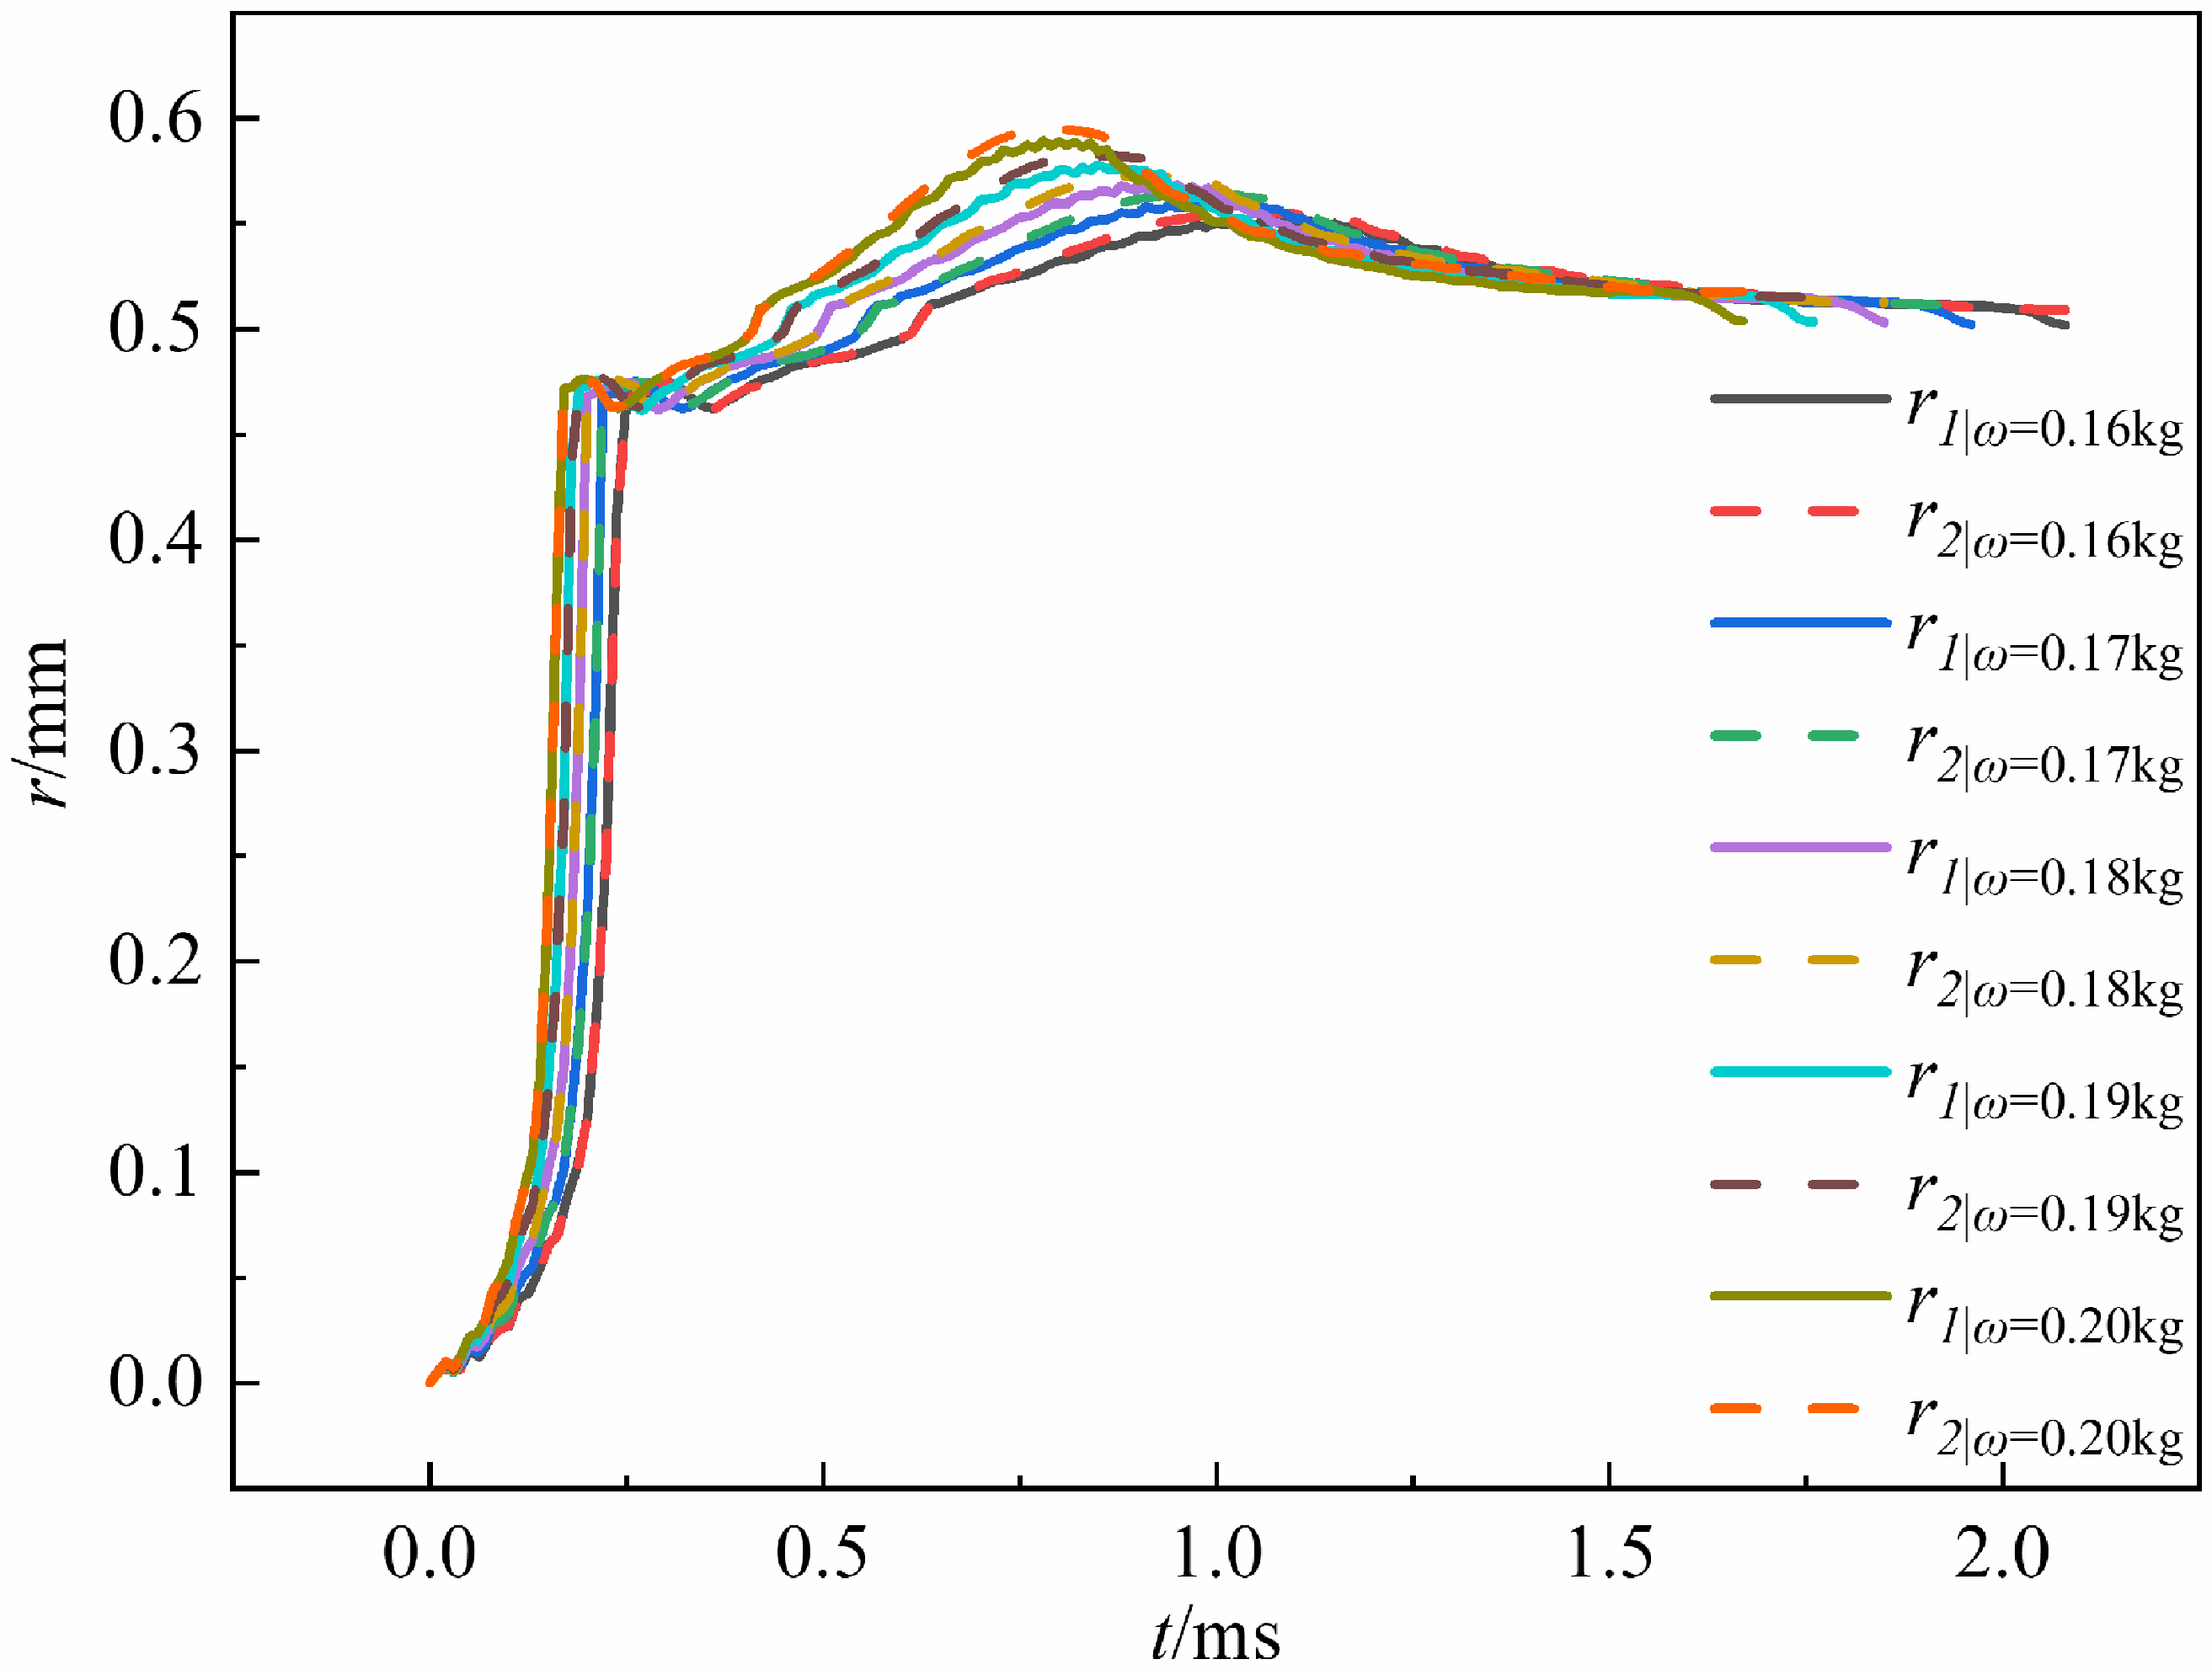
Figure 24 illustrates the radial displacements at the observation points of the sealing band under varying propellant charges, where r 1 indicates the radial displacement on the projectile side and r 2 represents the radial displacement on the balancing body side. According to the data presented in the figure, it can be inferred that as the propellant charge increases, the time for the sealing band to engage with the barrel decreases, resulting in a reduction in gas leakage. Notably, the radial displacement of the sealing band on the projectile side exhibits a significant decrease during the latter stages of launching, which is more pronounced than the changes observed on the balancing body side. This finding provides further evidence for the abrupt reduction in resistance on the projectile side, as depicted in Fig. 19, towards the end of the launching phase. Moreover, a consistent relationship exists between the maximum radial displacement and the maximum pressure.
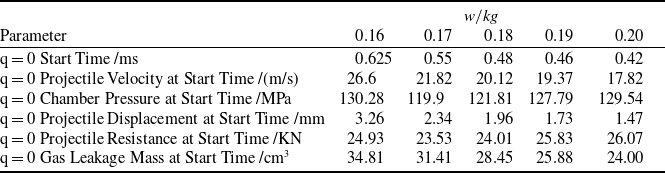
The characteristic parameters calculated for various propellant charges are presented in Table 4. It is evident from the table that as the propellant charge increases, the time at which the gas flow rate reaches zero decreases, and the volume of leaked gas correspondingly diminishes, which aligns with the previous analysis. According to the data presented in Table 4, as the propellant charge increases incrementally, the projectile velocity, projectile displacement and volume of leaked gas gradually decrease. This is consistent with the previously mentioned analysis.
Calculated characteristic parameters for different propellant charges

Maximum radial displacement at observation points of the sealing band for different propellant charges.

According to the data presented in Table 4, as the propellant charge increases incrementally, the projectile velocity, projectile displacement and volume of leaked gas gradually decrease. At a propellant charge of 0.17 kg, both the chamber pressure and resistance reach their minimum values among the five different conditions. This indicates that a larger propellant charge is not always advantageous. While increasing the propellant charge can reduce gas leakage, it also results in increased resistance, which consequently slows down the projectile velocity and affects the expansion rate of the combustion chamber volume. As a result, this may lead to elevated pressure levels, thereby posing a risk of barrel rupture. If the propellant charge is too small, it may lead to increased gas leakage, which in turn affects the chamber pressure and projectile velocity. Therefore, to achieve optimal interior ballistics performance, it is essential to select an appropriate propellant charge for experiment while keeping the structural assembly conditions fixed.
4.2 Effects of different assembly gaps
Different assembly gaps directly affect the cross-sectional area (
 ${A_f}$
) of the clearance between the barrel and the sealing band, which in turn impacts gas leakage and interior ballistics performance.
Figure 25 illustrates the resistance curves for the projectile and balancing body under different assembly gaps. From the figure, it can be observed that as the assembly gap increases, the maximum resistance value gradually decreases. This phenomenon can be further explained by the pressure curves shown in Fig. 26: when the assembly gap enlarges, the maximum chamber pressure correspondingly decreases. This reduction in load acting on the sealing band alleviates the normal stress at the interface between the sealing band and the barrel, leading to a decrease in resistance. At the same time, the one-to-one correspondence between the points of maximum resistance and maximum pressure across different conditions further demonstrates the direct relationship between resistance and pressure.
Resistance curves for different assembly gaps.

Pressure curves for different assembly gaps.

Figure 27 presents the velocity curves under different assembly gaps. The figure shows that when the assembly gap is less than 1.5 mm, increasing the gap results in an increase in projectile velocity. However, when the assembly gap exceeds 1.5 mm, the projectile velocity begins to decrease. Under the same propellant charge conditions, a 1.5 mm assembly gap yields a muzzle velocity that is 7.3 m/s higher compared to the case with a 0 mm gap. Considering overall interior ballistics performance, it can be concluded that an assembly gap of 1.5 mm represents the optimal condition.
Projectile velocity curves for different assembly gaps.

Figures 28 and 29 illustrate the effects of different assembly gaps on the gas flow rate and volume of leaked gas, respectively. It is evident from the figures that varying assembly gaps significantly influence both gas flow rate and leak volume. The maximum gas flow rate at (d = 2 mm) increases by 763.92% compared to (d = 0.5 mm), while the volume of leaked gas increases by 1195.85%. This is because a larger assembly gap results in a greater cross-sectional area (
 ${A_f}$
), leading to a larger volume of leaked combustion gases, slower pressure rise, and a reduced acceleration of the load acting on the sealing band. Consequently, the time during which the sealing band is in contact with the barrel increases, increasing the volume of leaked gas. The fitting curve for assembly gap and leakage mass is given by (Q = −1.08+101.52d–104.01d2+72.71d3), with an (R2) value of 0.9963, indicating a good fit. A comparison between Figs 20 and 26 suggests that the impact of the assembly gap on gas leakage is more pronounced than that of the propellant charge.
Gas flow rate for different assembly gaps.

Volume of leaked gas for different assembly gap.

Maximum radial displacement at observation points on the sealing band for different assembly gaps.

Figure 30 shows the maximum radial displacement at observation points on the sealing band for different assembly gaps. The figure indicates that there are significant differences in the radial displacements at the observation points under varying assembly gaps. As the assembly gap increases, the time taken for the sealing band to fully contact the barrel also increases. This can explain the reasons for the significant differences in both gas flow rate and leakage mass. The figure clearly shows that when the assembly gap is 0 mm, its radial displacement curve differs significantly from the curves of the other four conditions. In addition, there are also notable differences between the radial displacement curves of the sealing bands on the balance body side and the projectile side. This is due to the fact that, at an assembly gap of 0 mm, the curve can be interpreted as reflecting the radial displacement variations of the barrel at the point of contact with the sealing band. The discrepancy is attributed to the varying distances between the deformation locations and the center of mass of the barrel, leading to different magnitudes of deformation. Therefore, this elucidates one of the reasons for the significant reduction in both the resistance experienced by the projectile and the radial displacement of the sealing band on the projectile side during the final stages of launching.
5.0 Conclusion
A high-precision coupled calculation model is proposed for interior ballistics that simultaneously concludes the gas leakage and the mechanical interaction between the projectile and the gun. Based on this model, the sealing gas evolution process, gas flow rate, total leakage mass and interior ballistic parameters of a 65 mm short-barrel equal-caliber balanced gun equipped with a self-sealing band were solved. Moreover, a detailed analysis of how different propellant charges and assembly gaps influence the sealing performance of the self-closing sealing band is conducted. The main conclusions are as follows:
-
1) The high-precision interior ballistics coupling algorithm proposed in this paper accurately simulates the evolution of the self-sealing band’s sealing process and effectively calculates the impact of leakage on interior ballistics performance. The accuracy and high precision of this model have been validated through comparisons with experimental results, and it can precisely capture small structural changes.
-
2) The study shows that leakage significantly affects the interior ballistics performance of the cannon. During firing, the maximum volume of leaked gas is 28.45 cm³, and the sealing performance reaches its optimum between 0.48 ms and 1.86 ms.
-
3) Increasing the charge amount can reduce leakage, but it also leads to higher resistance and lower muzzle velocity. Therefore, an appropriate charge amount is crucial to ensure optimal interior ballistics performance. Specifically, when the charge amount is 0.17 kg, leakage is reduced while muzzle velocity is increased.
-
4) The assembly gap significantly affects interior ballistics performance. As the gap increases, both leakage and gas flow increase significantly. When the assembly gap is 1.5 mm, the muzzle velocity reaches its optimum, representing the best assembly configuration.
This study provides strong theoretical support for the design of self-sealing band cannons and can serve as a reference for future cannon performance analysis and optimisation.
Acknowledgements
This research was supported by the National Natural Science Foundation of China(Grant No. 12372030).
Postgraduate Research & Practice Innovation Program of Jiangsu Province.
Data Availability Statements
The data that supports the findings of this study are available within the article (and its supplementary material).