Peer victimization among children is a severe problem in many countries around the world. Overall, survey data indicate that up to 30% of children are being beaten up, threatened, taunted, or humiliated by their peers: Sweden and Norway (Olweus, Reference Olweus, Albee, Bond and Monsey1992, Reference Olweus1993), England (Boulton & Underwood, Reference Boulton and Underwood1992), the United States (Nansel et al., Reference Nansel, Overpeck, Pilla, Ruan, Simons-Morton and Scheidt2001), Australia (Rigby & Slee, Reference Rigby and Slee1991), Ireland (O'Moore & Hillery, Reference O'Moore and Hillery1989), Italy (Genta, Mensini, Fonzi, & Constabile, Reference Genta, Mensini, Fonzi and Constabile1996), Belgium (Vettenburg, Reference Vettenburg, Smith, Morita, Junger-Tas, Olweus, Catalano and Slee1999), Switzerland (Alsaker & Brunner, Reference Alsaker, Brunner, Smith, Morita, Junger-Tas, Olweus, Catalano and Slee1999), Japan (Morita, Soeda, Soeada, & Taki, Reference Morita, Soeda, Soeada, Taki, Smith, Morita, Junger-Tas, Olweus, Catalano and Slee1999); Spain (Ortega & Mora-Merchan, Reference Ortega, Mora-Merchan, Smith, Morita, Junger-Tas, Olweus, Catalano and Slee1999), Germany (Wolke, Woods, Stanford, & Schultz, Reference Wolke, Woods, Stanford and Schulz2001), and Canada (Craig, Wang, Goldbaum, Peters, & Silverman, Reference Craig, Wang, Goldbaum, Peters and Silverman2000). Notably, peer victimization is especially prevalent in the elementary school years, with a mean rate of 23% across five different countries (Smith, Madsen, & Moody, Reference Smith, Madsen and Moody1999). Thereafter, the frequency of peer victimization incidences steadily declines to about 5% of senior high school students who report being the victim of peer abuse at age 16 years. The greater frequency of peer victimization in elementary school is in part explained by the fact that many children have not yet acquired the coping strategies to deal effectively with incidents of peer victimization. Indeed, younger children more often report having cried or run away when being abused by peers than older children, strategies that are unlikely to stop the abuse and that may actually encourage further victimization (Smith et al., Reference Smith, Madsen and Moody1999).
It has been suggested that repeated peer victimization induces a chronic state of stress that endangers children's healthy development (Rigby, Reference Rigby1998). In line with this notion, a substantial body of research indicates significant links between peer victimization and concurrent and subsequent aggressive and disruptive behavior (e.g., Camodeca, Goossens, Meerum, Teruogt, & Schuengel, Reference Camodeca, Goossens, Meerum Terwogt and Schuengel2002; Craig, Reference Craig1998; e.g., Hanish & Guerra, Reference Hanish and Guerra2002; Kochenderfer & Ladd, Reference Kochenderfer and Ladd1997; Salmivalli & Nieminen, Reference Salmivalli and Nieminen2002; Schwartz, McFadyen-Ketchum, Dodge, Pettit, & Bates, Reference Schwartz, McFadyen-Ketchum, Dodge, Pettit and Bates1998; Troop-Gordon & Ladd, Reference Troop-Gordon and Ladd2005). Not all children who are victimized by their peers display elevated aggressive behavior, however. Research to date has mainly concentrated on psychosocial variables in an attempt to identify potential moderating factors in the link between peer victimization and children's maladjustment. Based on the diathesis–stress perspective (Monroe & Simons, Reference Monroe and Simons1991; Zuckerman, Reference Zuckerman1999), the present study tested an alternative possibility, namely, that aggression is mainly observed in victimized children who are genetically vulnerable for such behavior.
The Link Between Peer Victimization and Aggression
Being victimized by peers may result in victimized children exhibiting high levels of externalizing difficulties such as aggressive behaviors as a means to retaliate against peers (Kochenderfer & Ladd, Reference Kochenderfer and Ladd1997). Although many studies support the notion that victimized children may be at risk of increased aggressive behavior, effect sizes traditionally have been rather modest. Obviously, not all children who are victimized by their peers display aggressive behavior as a result of this negative experience. What could explain this variability? Researchers in search of potential moderating factors in the link between peer victimization and children's developmental adjustment problems have traditionally focused on psychosocial factors, either internal or external to the individual, that may buffer from or exacerbate the negative effect of peer victimization. For example, there is evidence that a higher global self-worth may mitigate the link between victimization and anxiety symptoms, at least in boys (Grills & Ollendick, Reference Grills and Ollendick2002). Other research shows that having friends can offset the effects of victimization on internalizing and externalizing behavior problems (Hodges, Boivin, Vitaro, & Bukowski, Reference Hodges, Boivin, Vitaro and Bukowski1999).
Apart from these psychosocial moderating factors, there is another potential mechanism that may explain the relatively modest association observed between peer victimization and children's aggressive behavior. Even in young children, aggressive behavior is at least partly explained by genetic factors (for reviews see Cadoret, Leve, & Devor, Reference Cadoret, Leve and Devor1997; DiLalla, Reference DiLalla2002; Miles & Carey, Reference Miles and Carey1997; Rhee & Waldman, Reference Rhee and Waldman2002), and recent evidence suggests that this applies to various forms of aggressive behavior, including physical and indirect aggression (Brendgen, Markiewicz, Doyle, & Bukowski, Reference Brendgen, Dionne, Girard, Boivin, Vitaro and Pérusse2005) as well as proactive and reactive aggression (Brendgen, Vitaro, Boivin, Dionne, & Pérusse, Reference Brendgen, Vitaro, Boivin, Dionne and Pérusse2006). As such, interindividual variability in the link between peer victimization and aggression could also be explained by genetically influenced individual differences in children's susceptibility to such behavior. In other words, the effect of peer victimization on aggressive behavior may only be evident in children with a strong genetic risk for such behavior, whereas children without such genetic vulnerability may show little or no aggression, regardless of whether they are victimized by their peers or not. This mechanism is referred to as “gene–environment interaction” (G × E; Kendler & Eaves, Reference Kendler and Eaves1986; Rutter & Silberg, Reference Rutter and Silberg2002). The G × E is consistent with the diathesis–stress hypothesis of disease, according to which an environmental stressor should be most likely to lead to maladjustment in individuals with preexisting genetic vulnerabilities (Monroe & Simons, Reference Monroe and Simons1991; Zuckerman, Reference Zuckerman1999).
Support for a G × E in the link between experiences of victimization and aggressive behavior has been provided by a recent study by Jaffee and her colleagues (Reference Jaffee, Caspi, Moffitt, Dodge, Rutter and Taylor2005). Specifically, these authors examined the link between physical abuse by parents and conduct disorder in 5-year-old twin children. Previous research by these authors had revealed that physical abuse by parents represents an environmental variable that is largely unrelated to heritable factors, that is, with an estimated genetic contribution of 7% that was nonsignificant (Jaffee et al., Reference Jaffee, Caspi, Moffitt, Polo-Tomas, Price and Taylor2004). In their follow-up study, the researchers found significant evidence for a G × E in the link between physical abuse by parents and conduct disorder in the child. Thus, children at highest genetic risk for conduct disorder had a much higher probability of a conduct disorder diagnosis when they were abused by their parents than when they were not (70 vs. 46%). In contrast, children at lowest genetic risk for conduct disorder had almost a zero probability of being diagnosed with conduct disorder, regardless of whether they were abused by their parents or not (4 vs. 2%). It is unclear, however, whether a similar G × E can be found in regard to the link between victimization by peers and children's aggressive behavior problems.
The Present Study
In an attempt to explain the interindividual variability in the link between peer victimization and children's aggressive behavior observed in previous studies, the present study was aimed at examining a potential G × E as an underlying mechanism of this variability. To analyze G × E with real precision, ideally one would have to directly measure not only the environmental variable (i.e., peer victimization) but also the genotype. Although evidence suggests aggression in children is to a significant extent explained by genetic factors (e.g., Brendgen et al., Reference Brendgen, Dionne, Girard, Boivin, Vitaro and Pérusse2005; Happonen et al., Reference Happonen, Pulkkinen, Kaprio, Van der Meere, Viken and Rose2002; Rice, Harold, & Thapar, Reference Rice, Harold and Thapar2002; Thapar & McGuffin, Reference Thapar and McGuffin1995; van der Valk, van den Oord, verhulst, & Boomsma, Reference van der Valk, van den Oord, Verhulst and Boomsma2003) the specific genes at play are largely unknown. As an alternative solution, data from monozygotic (MZ) and dizygotic (DZ) twin pairs can be used to study the interplay between genetic and environmental risks.
When data are collected on twins, a child's genetic risk for aggressive behavior can be estimated as a function of his or her co-twin's level of aggressiveness and the pair's zygosity (i.e., MZ or DZ twins; Andrieu & Goldstein, Reference Andrieu and Goldstein1998; Ottman, Reference Ottman1994). These analyses are based on the testable assumption that the investigated behavior problem is to a significant extent explained by genetic influences. Because MZ twins share 100% of their genes, it can be inferred that a child's genetic risk for aggression is highest if aggression is present in his or her MZ co-twin and lowest if aggression is absent in his or her MZ co-twin. In other words, if aggression is to a significant extent explained by genetic influences, and if a child's MZ co-twin shows this type of behavior, then that child's genetic risk of also showing aggressive behavior is highest because the child necessarily shares all of the susceptibility genes for aggression with his or her MZ co-twin. However, if a child's MZ co-twin does not show aggressive behavior, then that child's genetic risk for being aggressive him- or herself is lowest because none of the two children may possess the susceptibility genes for aggressive behavior. In contrast to MZ twins, DZ twins share on average only half their genes. As a result, if aggression is present in a child's DZ co-twin, then the child's genetic risk for also being aggressive is still high (but not as high as for MZ twins whose co-twin is aggressive), because the child may or may not share the susceptibility genes with his or her DZ co-twin. If aggression is not present in a child's DZ co-twin, then that child's genetic risk for aggression is lower (but still not as low as for a child whose MZ co-twin is not aggressive), because the child may have inherited susceptibility genes while his or her DZ co-twin did not. MZ and DZ twins can thus be placed along a continuum of genetic risk as a function of the presence or absence of aggressive behavior in their co-twin. A child's genetic risk is highest if his or her co-twin is aggressive, and the pair are MZ and a child's genetic risk is lowest if his or her co-twin is not aggressive. DZ twins' genetic risk falls in between these two groups. Using information about a child's genetic risk status in regard to aggressive behavior, it is then possible to assess a potential interaction between genetic risk and peer victimization.
In the present study we also examined potential gender differences in regard to G × Es in the link between peer victimization and child aggression. Specifically, given that aggressive behavior is more atypical in girls compared to boys (Crick & Zahn-Waxler, Reference Crick and Zahn-Waxler2003), we expected that highly victimized girls would be most likely to show high levels of aggression if they also possessed a genetic disposition for such behavior. In contrast, because aggressive behavior is more normative in boys, the link between peer victimization and aggressive behavior in boys may be less dependent on individual genetic risk for such behavior.
Method
Sample
Participants in the present study were part of an ongoing longitudinal study (Quebec Newborn Twin Study) of a population-based sample of twins from the greater Montreal area who were recruited at birth between November 1995 and July 1998 (N = 648 twin pairs). For same-gender twin pairs, zygosity was assessed at 18 months based on physical resemblance via the Zygosity Questionnaire for Young Twins (Goldsmith, Reference Goldsmith1991). For a subsample of these same-gender twin pairs (n = 123), a DNA sample was evaluated with respect to 8–10 highly polymorphous genetic markers. The comparison of zygosity based on the similarity of these genetic markers with zygosity based on physical resemblance revealed a 94% correspondence rate, which is similar to rates obtained in older twin samples (Forget-Dubois et al., Reference Forget-Dubois, Perusse, Turecki, Girard, Billette and Rouleau2003). Eighty-four percent of the families were of European descent, 3% were of African descent, 2% were of Asian descent, and 2% were Native North Americans. The remaining families (9%) did not provide ethnicity information.
The demographic characteristics of the twin families were compared to those of a sample of single births that is representative of the large urban centers in the province of Quebec (SantéQuébec, Jetté, Desroisers, & Tremblay, Reference SantéQuébec, é, Desrosiers and Tremblay1998) when the children were 5 months of age. The results showed that the same percentage (95%) of parents in both samples lived together at the time of birth of their child(ren), 44% of the twins compared to 45% of the singletons were the first-born children in the family, 66% of the mothers and 60% of the fathers of the twins were between 25 and 34 years old compared to 66% mothers and 63% fathers of the singletons, 17% of the mothers and 14% of the fathers of the twins had not finished high school compared to 12 and 14% of the parents of the singletons, the same proportion of mothers (28%) and fathers (27%) in both samples held a university degree, 83% of the twin families and 79% of singleton families held an employment, 10% of the twin families and 9% of the singleton families received social welfare or unemployment insurance, and 30% of the twin families and 29% of the singleton families had an annual total income of less than $30,000, 44% (42%) had an annual total income between $30,000 and $59,999, and 27% (29%) had an annual total income of more than $60,000. These results indicate extremely similar sociodemographic profiles in the twin sample and the representative sample of single births.
The sample was followed longitudinally at 5, 18, 30, 48, and 60 months focusing on a variety of child-related and family-related characteristics. A sixth wave of data collection was completed at 6 years of age to assess children's social adaptation in kindergarten. The present paper describes findings from the data collection in kindergarten. The average age at assessment was 72.7 months (3.6 SD). Attrition in the sample averaged at approximately 7% per year, resulting in a total of 370 twin pairs for the data collections at age 6 years (MZ males = 72, MZ females = 77, DZ males = 51, DZ females = 53, DZ mixed gender = 117). Twins remaining in the study at 6 years of age did not differ from those lost in regard to zygosity status or parent-rated temperament at 5 months of age. The lost twin families also did not differ from the remaining twin families in regard to any of the sociodemographic measures mentioned previously except that fathers in the remaining study sample had a slightly higher level of education than fathers of the twins who were lost from the study. Notably, because estimation of genetic models rests mainly on the comparison of MZ and same-gender DZ twins (Neale & Cardon, Reference Neale and Cardon1992; see more detailed description below), the 117 mixed-gender DZ pairs were not included in the analyses, resulting in a final study sample of 253 twin pairs.
Measures and procedure
All instruments were administered in either English or French, depending on the language spoken by the children (see description of measures below). Following the procedure suggested by Vallerand (Reference Vallerand1989), instruments that were administered in French but were originally written in English were first translated into French and then translated back into English. Bilingual judges verified the semantic similarity between the backtranslated items and the original items in the questionnaire. The research questions and instruments were approved by the institutional review board and the school board administrators. Prior to data collection, active written consent from the parents of all the children in the classroom was obtained. Data collection took place in the spring of the kindergarten year, to ensure that children had enough time to get to know each other. The sociometric procedure took approximately 45 min per class. Children were encouraged not to share their responses with each other.
Peer victimization
Children's level of peer victimization was assessed through peer nominations using two items selected from the Victimization subscale of the modified Peer Nomination Inventory (Perry, Kusel, & Perry, Reference Perry, Kusel and Perry1988): “He/she gets hit and pushed by other kids” and “He/she gets called names by other kids.” The victimization subscale of the modified Peer Nomination Inventory has been shown to have good predictive validity and test–retest reliability. Although only two items were used because of the young age of the children, even single-item peer nomination assessments tend to be highly reliable because the scoring is generated on the basis of multiple respondents (e.g., Hodges, Malone, & Perry, Reference Hodges, Malone and Perry1997; Perry et al., Reference Perry, Kusel and Perry1988). Moreover, because peer abuse is usually witnessed by other children but not always by adults (O'Connell, Pepler, & Craig, Reference O'Connell, Pepler and Craig1999), peers are an excellent source for evaluating the occurrence of peer abuse (Juvonen, Nishina, & Graham, Reference Juvonen, Nishina, Graham, Juvonen and Graham2001). Booklets of photographs of all the children in a given class were handed out. Two research assistants ensured that all children recognized the photos of all their classmates by presenting them individually. The children were then asked to circle the photos of two children who best fit a given descriptor. On the following page, children were asked to circle the faces of two children who best fit another descriptor, and so forth. For each descriptor, the total number of received nominations was calculated for each child and z standardized within classroom to account for differences in classroom size. The correlation between verbal and physical peer victimization was .37 (p < .001). The verbal and physical victimization scores were then averaged to yield a global peer victimization score, Cronbach α = .55, which was again z standardized within classroom.
Aggressive behavior
Child aggressive behavior was assessed using reports from peers and from teachers. Peer-nominated aggression was measured using items inspired by the Preschool Behavior Questionnaire (PBQ; Behar & Stringfield, Reference Behar and Stringfield1974). Previous studies have shown good predictive validity and test–retest reliability of the peer nominated PBQ items (Vitaro, Gagnon, & Tremblay, Reference Vitaro, Gagnon and Tremblay1990; Vitaro, Tremblay, & Gagnon, Reference Vitaro, Tremblay and Gagnon1990; Vitaro, Tremblay, Gagnon, & Boivin, Reference Vitaro, Tremblay, Gagnon and Boivin1992). Children were asked to circle the photos of up to two classmates who best fit four behavioral descriptors (“gets into a lot of fights,” “hits and kicks other children,” “says mean things about others,” and “is often angry”). For each descriptor, the total number of received nominations was calculated for each child and z standardized within classroom. The respective z standardized individual item scores were then summed up to yield a total peer-nominated aggression score (Cronbach α = .89), which was again z standardized within the classroom. Teacher-rated aggression was assessed using five items inspired by the Preschool Social Behavior Scale (Crick, Casas, & Mosher, Reference Crick, Casas and Mosher1997). Teachers indicated to what extent the child “gets into fights,” “physically attacks others,” “hits, bites, or kicks others,” “reacts aggressively when teased,” “says bad things about another child.” Responses were given on a 3-point scale (0 = never, 1 = sometimes, 2 = often). The respective individual item scores were summed up to yield a total teacher-rated aggression score, Cronbach α = .87. The correlation between teacher and peer rated aggression was .59 (p < .001). Because of this significant convergence between the two raters, the peer-rated and teacher-rated aggression scores were first z standardized across the whole sample and then summed to a composite aggression score. Because this composite aggression score was positively skewed, an inverse and reflect transformation was applied to normalize the data (Tabachnik & Fidell, Reference Tabachnik and Fidell2001). The correlation between the composite aggression score and the global victimization score was .52 (p < 0.001).
Genetic risk
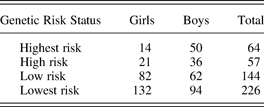
A continuous score of genetic risk for aggressive behavior was computed based on a formula developed by Ottman (Reference Ottman1994). This method has been used in several studies to test the presence of G × Es with an epidemiological twin design (e.g., Jaffee et al., Reference Jaffee, Caspi, Moffitt, Dodge, Rutter and Taylor2005; Kendler, Kessler, Walters, & MacLean, Reference Kendler, Kessler, Walters and MacLean1995; Samaras, Kelly, Chiano, Spector, & Campbell, Reference Samaras, Kelly, Chiano, Spector and Campbell1999). Specifically, one twin from each twin pair was selected as the “target twin” and the second twin as the “co-twin.” Each twin pair was represented in the data set twice, first with the elder twin as the target and the younger twin as the co-twin, and second with the younger twin as the target and the elder twin as the co-twin. The continuous score of genetic risk for aggression was computed as a function of (a) zygosity and (b) the presence or absence of aggression in the co-twin. To represent presence or absence of aggression, the combined aggression scale was dichotomized using the 75th percentile as the cutoff, which corresponded to 0.60 SD above the mean of the distribution. The 75th percentile was chosen as a cutoff (a) because a similar cutoff has been used in previous studies to distinguish between children with externalizing behavior symptoms from others (Vitaro, Tremblay, Kerr, Pagani, & Bukowski, Reference Vitaro, Tremblay, Kerr, Pagani and Bukowski1997) and (b) because it ensured sufficient sample size at the different levels of the genetic risk factor. Children whose aggression score was at or above the 75th percentile value of the sample distribution were considered as being aggressive. Children whose aggression score was below the 75th percentile value of the sample distribution were considered as not being aggressive. The presence or absence of aggression in the co-twin was then combined with information on the pair's zygosity into an index of genetic risk for aggression. Thus, the target twin's genetic risk for aggression was considered to be highest when he or she was part of an MZ pair and when aggression was present in the co-twin. The target twin's genetic risk for aggression was somewhat lower when he or she was part of a DZ pair and when aggression was present in the co-twin. The target twin's genetic risk for aggression was even lower when he or she was part of a DZ pair and when the co-twin was not aggressive. Finally, the target twin's genetic risk for aggression was lowest when he or she was part of an MZ pair and when the co-twin was not aggressive. The number of boys and girls at each level of genetic risk for aggression is provided in Table 1. Notably, all analyses described subsequently were also conducted with a genetic risk index based on two additional cutoffs for aggression, that is, the 65th and the 85th percentile, with extremely similar results.
Number of girls and boys by genetic risk status

Note: Sample sizes in the different risk groups do not sum to the overall sample size of 506 individuals (i.e., 253 pairs) because of occasional missing data for a co-twin, which was necessary for the calculation of the genetic risk status variable (see text). However, even cases where the genetic risk status information was missing were included in the analyses using full information maximum likelihood estimation (Muthén & Muthén, Reference Muthén and Muthén1998–2004).
Results
Preliminary analyses
Preliminary analyses were conducted with the Mplus statistical package (Muthén & Muthén, Reference Muthén and Muthén1998–2004) to examine potential differences between boys and girls and between MZ and DZ twins in regard to victimization and aggressive behavior. To facilitate the interpretation of results, the two variables were z standardized prior to analyses. In a few cases (i.e., 1.5% of all data points) a child had a missing value on a study variable although his or her co-twin had valid data. These cases were included in the analyses using full information maximum likelihood estimation (Muthén & Muthén, Reference Muthén and Muthén1998–2004). Results from hierarchical linear modeling using Mplus (see detailed description below) revealed that girls were less victimized than boys, β = −.48, p < .01, and showed lower levels of aggressive behavior than boys, β = −.55, p < 0.001. No differences were found between MZ and DZ twins with respect to either of the two study variables, β = .01, ns, for victimization, β = −.13, ns, for aggressive behavior.
Assessing the relative contribution of genes and environment to aggressive behavior and peer victimization
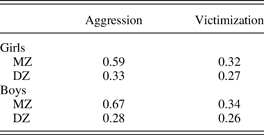
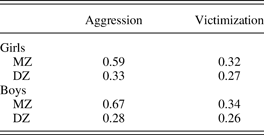
For the logic of the genetic risk index it is important to demonstrate that individual differences in aggressive behavior among the young children in our sample are at least to some extent explained by genetic factors. The twin design makes it possible to assess the relative role of genetic factors and environmental factors associated with a given phenotype (Neale & Cardon, Reference Neale and Cardon1992). By comparing within-pair correlations for MZ twins and DZ same-gender twins, sources of variability of a given phenotype can be estimated in terms of genetic and environmental factors (Falconer, Reference Falconer1989). Rough estimations of genetic and environmental sources of variance can be obtained by comparing within-pair correlations for MZ and DZ same-gender twins on each phenotype. Thus, the relative strength of additive genetic factors on individual differences is approximately twice the MZ and same-gender DZ correlation difference. The relative strength of shared environmental factors that affect twins within a pair in a similar way can be estimated by subtracting the MZ correlation from twice the DZ correlation. Finally, nonshared environmental factors that uniquely affect each twin in a pair are approximated by the extent to which the MZ correlation is less than 1. The within-twin pair correlations of peer victimization and aggression are depicted in Table 2, separately for boys and girls.
Within-pair twin correlations for aggression and victimization
Note: MZ, monozygotic; DZ, dizygotic.
As can be seen, MZ correlations appear to be almost twice as high as same-gender DZ correlations for aggressive behavior, in girls as well as in boys. This suggests a substantial contribution of genetic factors on individual differences in aggressiveness, whereas shared environmental influences may play a negligible role. The overall magnitude of the correlations is not very high, however, indicating a significant contribution of nonshared environmental factors to aggressive behavior. In contrast, MZ and same-gender DZ correlations for victimization are rather similar, also both for girls and for boys, which suggests that this phenotype may be explained more by shared environmental factors than by genetic factors. Again, however, the overall magnitude of the correlations is rather small, indicating a significant contribution of nonshared environmental factors to victimization in boys and girls.
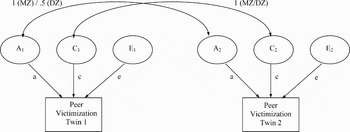
Although the comparison of intrapair correlations across MZ and DZ twins can provide rough approximations of the relative contributions of genetic, shared environmental, and nonshared environmental factors to a given phenotype, structural equation modeling using a maximum likelihood fit function enables a more precise estimation of the genetic and environmental parameters (for a detailed description of the use of structural equation modeling in behavioral genetic analyses, see Neale & Cardon, Reference Neale and Cardon1992). Specifically, univariate modeling of variance decomposition provides estimations of the contribution of latent additive genetic (A), latent shared environmental (C), and latent nonshared environmental (E) factors to the observed variance of a given phenotype (for an example, see the ACE model in Figure 1). This model is fitted to the data in a two-group model where (a) the genetic correlations between twins in a pair are fixed to 1.0 for MZ twins and to 0.5 for DZ twins, (b) the shared environmental correlations between twins in a pair are fixed to 1.0 for both MZ twins and DZ twins, and (c) the nonshared environmental correlations between twins in a pair are fixed to zero for both MZ twins and DZ twins. The estimated coefficients a, c, and e, which are fixed to be equal across the two twins in a pair and across MZ and DZ twins, are the factor loadings that provide information about the relative contribution of the latent factors A, C, and E to the total variance of each phenotype P, with the variance of P = a 2 + c 2 + e 2.
The univariate ACE model. Parameters A, C, and E refer to additive genetic, shared environmental, and nonshared environmental factors, respectively.

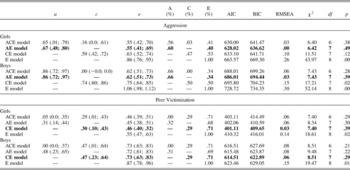
In the first series of analyses, such a univariate model was fitted to the data, separately for aggressive behavior and for peer victimization. Specifically, a series of models was fitted comparing the full ACE model to a series of submodels (i.e., AE, CE, E). To determine the most probable model given the pattern of intercorrelations observed within twin pairs, model fit was assessed based on the χ2 statistic, the Akaike information criterion (AIC), the Bayesian information criterion (BIC), the comparative fit index (CFI), and the root mean square error of approximation (RMSEA). The latter two statistics are two parsimony indexes that take into account both the model chi-square and the associated degrees of freedom, thus correcting for model complexity. Table 3 provides a summary of the tested univariate genetic models. We also fitted additional models specifying a dominance genetic effect D for the three variables. The D path was not significant for any of the three phenotypes and these models are therefore not reported here.
Amount of variance explained in aggression and peer victimization: univariate genetic models

Note: Best fitting models are in bold. a, factor loading of the latent additive genetic factor (A); c, factor loading of the latent shared environmental factor (C); e, factor loading of the latent nonshared environmental factor (E); A, percentage of explained variance due to the latent additive genetic factor; C, percentage of explained variance due to the latent shared environmental factor (C); E, percentage of explained variance due to the latent nonshared environmental factor (E); AIC, Aikaike information criterion; BIC, Bayesian information criterion; RMSEA, root mean square error of approximation; df, degrees of freedom. Bootstrap confidence intervals for parameter estimates are presented in parentheses.
As can be seen, the variance of aggression was best described by an AE model, suggesting that genetic factors significantly contribute to interindividual differences in this context. Specifically, in the best fitting model (AE) for girls' aggression, heritability accounted for 60% of the variance, whereas the remaining 40% were explained by nonshared environmental sources. Shared environmental factors did not play a significant role in explaining girls' aggression, however. Similarly, in the best fitting model (AE) for boys' aggression, heritability accounted for 66% of the variance, whereas the remaining 34% were explained by nonshared environmental sources. Shared environmental factors also did not play a significant role in explaining boys' aggression.
The variance of peer victimization was best described by the CE model for both girls and boys. In fact, the estimate of the genetic factor A was equal to zero in the ACE model for boys and very small (i.e., .05) for girls. In the best fitting model (CE), shared environment accounted for 29% of the variance of peer victimization, whereas the remaining 71% were explained by nonshared environmental sources. Notably, these estimates were the same for boys and girls. These results suggest that children's victimization at the hand of peers constitutes a largely environmentally driven phenomenon that has very little, if any, basis in a child's genetic disposition. This latter finding is important for examining a potential G × E in subsequent analyses, because finding statistical support for a G × E is difficult if the environmental stimulus is under the control of genes (e.g., if genetic characteristics in the child evoke victimization experiences).
Assessing G × E in the link between peer victimization and aggression
In the next set of analyses, we examined whether a G × E may account for the link between peer victimization and aggressive behavior in children. These analyses were performed using multilevel regression analysis. In a two-level model, a hierarchy consists of lower level observations (i.e., Level 1 unit of analysis) nested within higher level observations (i.e., Level 2 unit of analysis). In the context of the present study, each individual child is nested within a twin pair. It is assumed that observations across twin pairs are independent from one another. However, because siblings within a given pair share genetic and environmental factors, observations within a given pair are interdependent, thus violating the assumption of independent observations in traditional linear models. Multilevel models allow for the estimation of within-pair and between-pair effects while simultaneously adjusting for the amount of data interdependency.
In the present study, the Level 1 unit of analysis represents each individual child, whereas the Level 2 unit of analysis represents each individual twin pair. The Level 1 variance estimates describe the degree to which twins within a pair differ from each other (i.e., within-pair variance), whereas the Level 2 variance indicates the degree to which twin pairs differ from one another (i.e., between-pair variance) with respect to the dependent variable. Because of the genetic structure of the data, both the within-pair (i.e., Level 1) variance and the between-pair (i.e., Level 2) variance may differ between MZ and DZ twins. Therefore, separate estimates for Level 1 and Level 2 variance in MZ twins and DZ twins, respectively, were included in the multilevel model, such that

where y ij is the phenotype (aggression) of individual j (Level 1) in the ith pair (Level 2), MZi and DZi are observed indicator variables denoting zygosity, and μ is a fixed parameter that represents the intercept. The random (latent) variables ηiMZ(B) and ηiDZ(B) vary only between twin pairs and represent the between-pair variation for MZ and DZ twins, respectively. The random (latent) variables ηijMZ(W) and ηijDZ(B) vary between individuals and represent the within-pair variation for MZ and DZ twins, respectively. The term βX indicates all the others predictors (independent variables) included in the model. Child-specific predictors (i.e., independent variables) are included in multilevel analyses as fixed effects. The fixed effect estimates provide information about the unique link between each child-specific predictor (i.e., gender, genetic risk for aggression, and peer victimization) and the dependent variable (i.e., aggressive behavior) and can be interpreted in a similar way as regression coefficients in a multiple regression.
The results from the previous set of analyses had shown that, although there were no significant genetic effects, 29% of the variance of peer victimization in kindergarten were explained by environmental factors that were shared between the two twins in a pair. Because we were interested in the additive and interactive effects of a child's own peer victimization on aggression, we created a residual peer victimization variable that only contained the nonshared variance component. This was achieved by regressing peer victimization on both the shared and the nonshared variance components, such that y ij = μ + ηi(B) + ηij(W) where y ij is the observed variable (victimization) of individual j in the ith pair, μ is the intercept, ηi(B) is the between-pair (shared) variation, and ηij(W) is the within-pair (nonshared) variation. Fitting this two-level model, the nonshared residual can be obtained as  where
 is the estimate of the within-pair residual, y ij is the observed variable (victimization) of individual j in the ith pair,
 is the estimate of the intercept and
 is the estimate of between-pair residual (shared variation).
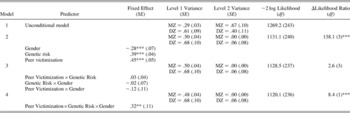
The newly created residual peer victimization variable, which only contained the nonshared or unique portion of the variance of peer victimization, was then used as the independent variable “peer victimization” in the multilevel analysis. The new victimization residual was also used to create the interaction term between genetic risk and peer victimization. A G × E would be evidenced if the predictive effect of peer victimization on aggression varied as a function of a child's genetic risk of displaying such behavior, indicated by a significant interaction between genetic risk and peer victimization. We also examined whether any potential G × E would be moderated by gender. Specifically, a series of consecutive models of increasing complexity were estimated where each subsequent model was compared to the preceding one to evaluate whether the inclusion of additional predictors provided a better fit to the data. Goodness of fit for each model was evaluated based on the −2 log likelihood estimate and a likelihood ratio test was used to evaluate the difference in fit between subsequent models. Table 4 presents the results from the multilevel analyses. For each model, the fixed effects of the predictor variables, the Level 1 and Level 2 variance parameters, the model fit (i.e., −2 log likelihood), and the likelihood ratio are provided.
Multilevel analyses assessing gene–environment interaction in predicting child aggression

Note: Gender is coded so that a higher value (1) represents girls. MZ, monozygotic; DZ, dizygotic; Δ, difference of model fit between consecutive models. Each model is tested against the respective preceding model.
**p < .01. ***p < .001.
The first model tested was an unconditional model, without including any predictors. The unconditional model provided preliminary information about the total within-pair (i.e., Level 1) and between-pair (i.e., Level 2) variance of aggression. Calculations based on the variance estimates in Model 1 (i.e., unconditional model) revealed that 30% of the variance of aggression in MZ twins and 60% of the variance of aggression in DZ twins were attributable to within-pair differences, whereas 70% of the variance in MZ twins and 40% of the variance in DZ twins were explained by between-pair differences. In the second model, three Level 1 (i.e., child specific) predictors were added to the equation as fixed effects: gender, genetic risk for aggression, and peer victimization. As indicated by the likelihood ratio test, the addition of the predictors in Model 2 significantly improved model fit compared to the unconditional model, likelihood ratio difference = 138.10 (3), p < .001. Moreover, all three predictors were significantly associated with children's aggressive behavior. Specifically, girls showed lower levels of aggression than boys (β = −.28, p < .001), children with a higher genetic risk for aggression showed a higher level of aggressiveness than children with a lower genetic risk (β = .39, p < .001), and children who were more victimized by their peers showed higher levels of aggression (β = .45, p < .001). The interaction term between peer victimization and genetic risk for aggression in the subsequent model was not significant (β = .03, ns).
Results from the next model indicated, however, that the interaction between peer victimization and genetic risk was significantly moderated by gender (β = .32, p < .01). Further probing revealed that peer victimization significantly interacted with genetic risk for aggression in predicting aggressive behavior in girls (β = .30, p < .01), but not in boys (β = −.03, ns). To break down the interaction between peer victimization and genetic risk for girls, the effect of peer victimization on girls' aggression was examined at the four levels of genetic risk (highest, high, low, lowest). The results showed that the effect of peer victimization on aggression in girls gradually diminished with decreasing genetic risk for such behavior, β = 1.00, p < .001 for the girls in the highest genetic risk group, β = .74, p < .001 for girls in the high genetic risk group, β = .45, p < .001 for girls in the low genetic risk group, and β = .17, p < .05 for girls in the lowest genetic risk group.
Discussion
Peer victimization poses a serious risk for children's healthy development, and has been linked with high levels of aggressive and disruptive behavior in both concurrent and longitudinal data (e.g., Camodeca et al., Reference Camodeca, Goossens, Meerum Terwogt and Schuengel2002; Craig, Reference Craig1998; e.g., Hanish & Guerra, Reference Hanish and Guerra2002; Kochenderfer & Ladd, Reference Kochenderfer and Ladd1997; Salmivalli & Nieminen, Reference Salmivalli and Nieminen2002; Schwartz et al., Reference Schwartz, McFadyen-Ketchum, Dodge, Pettit and Bates1998; Troop-Gordon & Ladd, Reference Troop-Gordon and Ladd2005). Not all children who are victimized by their peers display high levels of aggression, however. Based on the diathesis–stress perspective (Monroe & Simons, Reference Monroe and Simons1991; Zuckerman, Reference Zuckerman1999), the present study examined whether this variability could be explained by the fact that victimization is related to aggressive behavior problems mainly in those children who are genetically vulnerable to such problems. To this end, the present study aimed at examining a possible G × E in the association between peer victimization and aggressive behavior in young children.
Genetic and environmental contribution to aggressive behavior and peer victimization
Prior to examining a potential G × E in the link between peer victimization and child aggression, genetic and environmental contributions to the different variables at play were tested. With respect to aggressive behavior, this test was necessary to establish the existence of a genetic component that could interact with peer victimization. With respect to peer victimization, we needed to ascertain that the putative environmental variable (i.e., peer victimization) indeed represented a “true” environmental factor that was under little or no control of genes. Both sets of these preliminary criteria were satisfied. Specifically, our findings corroborated previous results that genetic effects account for more than 50% of the variance of aggression in children, whereas the remainder is explained by nonshared environmental effects (for reviews see Cadoret et al., Reference Cadoret, Leve and Devor1997; DiLalla, Reference DiLalla2002; Miles & Carey, Reference Miles and Carey1997; Rhee & Waldman, Reference Rhee and Waldman2002). In contrast, peer victimization clearly emerged as an environmentally driven variable that is unrelated to children's genetic disposition. Specifically, 29% of the variance of peer victimization were explained by environmental factors shared between two twins in a pair and the rest was explained by nonshared environment.
What may these environmental factors be, that influence children's risk of victimization by the peer group? One possible shared environmental risk factor for peer victimization may be maladaptive parenting behavior. For example, some evidence suggests that victimized children experience more overprotective, or punitive, hostile, and abusive family treatment than nonvictimized children (Finnegan, Hodges, & Perry, Reference Finnegan, Hodges and Perry1998; Schwartz, Dodge, Pettit, & Bates, Reference Schwartz, Dodge, Pettit and Bates1997). Another important determining factor might be the social context in the school. Thus, teachers may not always be aware of victimization incidences (Fekkes, Pijpers, & Verloove-Vanhorick, Reference Fekkes, Pijpers and Verloove-Vanhorick2005) or may not perceive the incident as sufficiently problematic to warrant intervention (Newman & Murray, Reference Newman and Murray2005). Other influential factors may include peer attitudes and reactions toward bullying in the classroom (Salmivalli, Kaukiainen, & Voeten, Reference Salmivalli, Kaukiainen and Voeten2005) as well as the availability of friends who can offset the risk for later victimization (Hodges et al., Reference Hodges, Boivin, Vitaro and Bukowski1999; Schwartz, Dodge, Pettit, & Bates, Reference Schwartz, Dodge, Pettit and Bates2000). Although identification of the specific sources of shared and nonshared environmental influences on peer victimization was beyond the scope of this study, establishing that peer victimization is an environmentally driven phenomenon is an important first step. Specifically, this finding suggests, that, similar to child abuse by parents (Jaffee et al., Reference Jaffee, Caspi, Moffitt, Polo-Tomas, Price and Taylor2004), abuse by peers at school entry does not seem to be an experience that is “evoked” as a function of children's heritable traits.
G × E in the link between peer victimization and aggression
The finding that peer victimization is a “true” environmental factor, together with the finding that aggressive behavior is to a significant extent explained by genetic factors, pave the way for a possible G × E in the link between peer victimization and aggression. Indeed, as in previous research (e.g., Camodeca et al., Reference Camodeca, Goossens, Meerum Terwogt and Schuengel2002; Craig, Reference Craig1998; e.g., Hanish & Guerra, Reference Hanish and Guerra2002; Kochenderfer & Ladd, Reference Kochenderfer and Ladd1997; Salmivalli & Nieminen, Reference Salmivalli and Nieminen2002; Schwartz et al., Reference Schwartz, McFadyen-Ketchum, Dodge, Pettit and Bates1998; Troop-Gordon & Ladd, Reference Troop-Gordon and Ladd2005), high levels of victimization were related to high levels of aggression in our study. Moreover, our results of a significant G × E indicated that the link between victimization and girls' aggressive behavior varied depending on the girls' genetic vulnerability to such behavior. Specifically, victimized girls showed high levels of aggression mainly if they had a high genetic risk of being aggressive, whereas the link between victimization and aggressiveness was weak in girls with a very low genetic risk of aggressive behavior. A similar G × E in the link between peer victimization and aggression was not found in boys, however. Instead, a high level of peer victimization was related to a high level of aggression regardless of whether boys had a high or a low genetic disposition to such behavior.
At least for girls, the present findings are in line with a diathesis–stress hypothesis of disease, according to which an environmental stressor such as peer victimization should lead to a greater risk for maladjustment in individuals with preexisting genetic vulnerabilities (Monroe & Simons, Reference Monroe and Simons1991; Zuckerman, Reference Zuckerman1999). Our results also concord with those obtained by Jaffee and colleages (Reference Jaffee, Caspi, Moffitt, Dodge, Rutter and Taylor2005), who found that physical abuse by parents was related to a very high probability of conduct disorder in children with a very high genetic risk for such disorder, whereas children with a very low genetic risk had almost a zero probability of conduct disorder, regardless of whether they were abused by their parents or not. Together, these findings suggest that experiences of abuse, whether from parents or peers, may constitute a risk factor for the development or maintenance of aggressive behavior especially in children with a genetic disposition to such behavior. In contrast, children without a genetic disposition to aggressive behavior may be more resilient to displaying aggression when faced with abuse from parents or peers.
The question arises, why a G × E in the link between peer victimization and aggression was only found for girls but not for boys. The answer may lie in different socialization experiences in girls' compared to boys' peer groups. Thus, boys have been shown to display more aggressive, confrontational behavior in their social interactions with friends and with nonfriends than girls (Brendgen et al., Reference Brendgen, Markiewicz, Doyle and Bukowski2001; Denton & Zarbatany, Reference Denton and Zarbatany1996; Maccoby & Jacklin, Reference Maccoby and Jacklin1980; Phillipsen, Reference Phillipsen1999). Moreover, at least with respect to relational forms of aggression, girls rate aggressive behavior as more unacceptable than boys even when displayed in response to an aggressive provocation from peers (Goldstein, Tisak, & Boxer, Reference Goldstein, Tisak and Boxer2002). When faced with provocation and victimization from others, girls may therefore be most likely to behave aggressively if they are genetically disposed to do so. In contrast, because aggressive responses to hostile peer provocations may be more acceptable for boys, many victimized boys may retort with aggression regardless of whether they have a genetic disposition for such behavior or not.
Strengths, Limitations, and Conclusion
This study is the first to assess the question of a possible G × E in the link between peer victimization and children's aggressive behavior. By the same token, the study presents first data showing that victimization by peers, similar to physical abuse by parents, represents an environmental factor that is unrelated to children's genetic makeup. A main advantage of the present study is the fact that, in addition to teacher reports of child behavior, peer victimization as well as aggressive behavior was assessed by peers. Peers are a highly reliable source of children's social and behavioral adjustment (e.g., Hodges et al., Reference Hodges, Malone and Perry1997; Juvonen et al., Reference Juvonen, Nishina, Graham, Juvonen and Graham2001; Perry et al., Reference Perry, Kusel and Perry1988), but are rarely employed as a reporting source in twin studies.
Our study also has several limitations, which need to be kept in mind when interpreting the present results. One limitation is the relatively small sample size in the present study, compounded by the substantial loss of participants because of attrition. The extremely high costs associated with sociometric peer ratings in several hundred classrooms of young children unable to read, however, rendered the assessment of a larger sample difficult. Moreover, attrition analysis suggested that the final study sample was not overly biased. In addition, the small sample size did not seem to compromise statistical power in the present study, as indicated by significant three-way interaction effects between child gender and genetic and environmental risk factors. Nevertheless, future studies need to replicate the present findings using larger samples before definite conclusions can be drawn in regard to G × Es in the link between peer victimization and child aggression. Caution also needs be taken in trying to generalize the present results beyond the assessed age. Thus, it is unknown whether peer victimization remains unrelated to individual genetic dispositions in older children. As such, the mechanisms linking peer victimization and aggression in older children may be based not only on a G × E but also, and perhaps even more so, on a gene–environment correlation. In other words, whereas a genetic disposition to aggressiveness may not increase the risk of peer victimization in young children, it may increase the risk of peer victimization in older children. Despite its limitations, we believe the present study demonstrates that behavioral genetic designs can make a substantial contribution to the question of the link between peer victimization and child behavior problems. Specifically, the results from the present study underline the sometimes complex transactions between genetic and environmental risk factors (and child gender) at play in the development of child psychopathology.