


Introduction
The centralised compulsory school system in England is well placed to influence child health through developing good food habits and using national standards to drive nutritional improvement strategies.(Reference Kovacs, Messing and Sandu1) School meals represent a powerful lever to impact health on a population scale(2) and England has a long history of using school meals to address national nutritional shortfalls.(Reference Passmore and Harris3) However, as political priorities changed from a focus on welfare to economics,(Reference Passmore and Harris3,Reference Mozaffarian, Angell, Lang and Rivera4) the attention shifted to a closer examination of the cost of providing such public services.(Reference Morgan and Sonnino5) Consequently, the responsibility for provision of school meals was devolved to school leaders in the 1980s in an effort to cut cost.(Reference Morgan and Sonnino5) The introduction of academies in England in 2002 enabled schools to operate independently from local authority control, whilst still receiving funding from the state.(Reference Male6) Over time, as more schools made individual decisions about where they source their meals, provision has become increasingly fragmented(Reference Morley and Morgan7) and the transparency at a central level has been lost. More recently, as the child health crisis in England has become increasingly urgent(8) with child obesity rates more than doubling between the time children start and leave primary school (4–11 years),(9) focus has returned to the potential of school meals to address child health and inequalities.(10) Children in England receive free school meals (FSM) in infant schools (5–7 years); however, only the most disadvantaged are eligible from the age of 8 years.(11) Primary school children are presented with a limited choice of plated meals for a set price.(Reference Haney, Parnham and Chang12) The alternative is to bring a packed lunch from home, which studies have found to be often of inferior nutritional quality and contain higher levels of ultra processed food than school meals.(Reference Parnham, Millett and Vamos13,Reference Evans, Melia, Rippin, Hancock and Cade14) Universal FSMs have been introduced in Scotland (reception, infant and the following two years), Wales (all primary school) and London (all primary school for a limited time period); however, despite a government pledge to make ‘this the healthiest generation ever’,(15) there are no plans to introduce a universally free provision in England at the time of writing.
The school food provider has the potential to be the main influence over the nutritional quality of school food consumed by primary school children. Whilst compliance with government issued School Food Standards(16) is required, there is currently no national compulsory system of monitoring of compliance with those standards in England. Therefore, many meal providers are effectively left to self-assess the acceptability of the quality of their provision. A recent pilot adding basic compliance checks for a small sample of School Food Standard requirements to food safety audits found that this could add valuable insight, but that support for required remedial action was not always available for schools.(Reference Jebb17)
Headcount and geography serve as important indicators of the financial viability of school meals services in the absence of actual financial data.(Reference Dimbleby and Vincent18,19) Larger urban schools can achieve a higher number of school meals served and once the fixed costs of the service are covered, the incremental cost of providing additional meals is much smaller. A 2024 UK report calculated that a primary school needs to serve 150 meals per day for the school meal provision to break even financially.(20) Means tested FSM eligibility is an additional indicator of the financial viability of the provision as it influences meal uptake(Reference Cohen, Hecht, Hager, Turner, Burkholder and Schwartz21) and additional funding is received through pupil premium for every child registered to receive means tested FSM.(22) The additional pupil premium funding received by the school may mean that there is less pressure for the school meal service to generate profit for the school, or, provide funds to enable the subsidisation of the meals service from the school budget. A potential connection between the financial viability of the school meals service, and the quality of food provided, has been noted by several other researchers in the UK recently, however it lacks conclusive evidence.(Reference Passmore and Harris3,Reference Devine, Gallagher, Briggs and Hill23–Reference Pallan, Murphy and Morrison25)
Given the influence of the school food provider over the nutritional quality of school meals and the requirement for them to effectively self-monitor compliance with standards it is important to understand who provides the meals in schools. However, there is no central record of who provides school meals in England despite it being the largest area of public sector food spend at approximately £700m per annum.(26,Reference Bonfield27) Previous survey data collected on school lunch take-up by the School Food Trust and the Department for Education is over a decade old.(Reference Wollny, Lord, Tanner, Fry, Tipping and Kitchen28,Reference Nelson, Lever and Nicholas29) The difficulty in obtaining data on school food provision was highlighted with both surveys noting a lower than expected response rate. The Department for Education survey(Reference Wollny, Lord, Tanner, Fry, Tipping and Kitchen28) identified three models of catering provision; (1) local authority catered, (2) private company catered, and (3) in-house catered, and noted differences by school type with more academies choosing commercial or in-house catering services. The School Food Trust survey(Reference Nelson, Lever and Nicholas29) collected data from local authorities and, therefore, did not include all data for those schools not using the local authority catering service. The report identified six models of catering provision with the three models above further divided to show, where an external caterer was used, whether the caterer was contracted by the local authority or the school. This data was used by the Department for Education for the 2013 review of the English school food provision, The School Food Plan.(Reference Dimbleby and Vincent18) Without an up to date understanding of the current provision, it is difficult to put in place effective policies to manage such a complex system to meet and support public health goals. Addressing the gap in knowledge of who provides our school meals would support a population approach to the dietary health crisis and rising obesity levels in children through policy and practice to improve the visibility of, and required compliance with standards for, the nutritional quality of children’s meals. This study therefore had a timely aim to investigate and map the range of primary school food providers, taking a case study approach across a large and diverse geographical area of Yorkshire, UK. In addition, the study established if there were differences in indicators of financial viability and, therefore, the potential quality of school meals between the types of providers identified, including school headcount (size), deprivation (FSM%), geography (urban or rural), cultural diversity (EAL%) and school type (local authority maintained or academy).
Methods
Design
An observational case study was conducted to gather information on who provides primary school food across a region of the UK, called Yorkshire, using a variety of triangulated approaches; (1) school survey, (2) lists from caterers and public health teams, (3) desk-based website review. Cross-sectional data on school characteristics of size, deprivation, geography, cultural diversity, and school type, were gathered from a central government database(30) and compared to establish differences between provider types (Figure 1).
Study data and sources: showing the number of schools (n) that each source provided data for, and the type of data provided.

Setting
Yorkshire, a region of the UK, has 1,772 state funded primary schools in 15 local government areas (known as local authorities in England) attended by 481,000 children. This study included data from state maintained primary schools and academies and excluded secondary schools, special schools, independent schools and pupil referral units due to the differing funding allocations and meal provisions. It provides a study population with a diverse range of procurement methods, geographical settings, deprivation factors, ethnicties, and school sizes. This population represents just over 10.0% of the 4.7m children in the 17,000 state funded primary and nursery schools in England,(30) yet is of a size where good contacts for data collection and a controllable data set could be established.
Data measures and collection
A variety of triangulated approaches were used to capture data on school food provision across Yorkshire. (1) Two questions were incorporated in an existing survey which was sent to all 1,772 state funded Yorkshire primary schools in February 2023 (with non-respondents chased every school term thereafter until July 2024). One, multiple choice, question asked who was responsible for the school catering: in-house team; academy trust catering; outsourced caterer; or local authority; and the second, open text, question asked for the name of the caterer. Methods to increase engagement such as an online design, short completion time of less than 10 minutes and simple multiple-choice questions were used.(Reference Liu and Wronski31) As it is difficult to engage schools in research due to many competing priorities for their limited resources, additional ‘in kind’ incentives for completion relating to food and sustainability were offered alongside free support for their whole school approach to food policies through links to existing websites.(Reference Holtom, Baruch, Aguinis and A Ballinger32) (2) The catering and public health departments for all 15 local authorities and the five largest commercial caterers were also contacted to request a list of all schools catered for. (3) Finally, gaps in data provision were sourced through reviewing the websites of all remaining schools, to establish if the caterer could be identified from menus or newsletters. The provider type was derived from the source document or from the provider website where this was not included on the documentation. Demographic information on the school characteristics was obtained from publicly available data(30) as follows:
-
• School size – using headcount from form entry;
-
• Deprivation – using FSM eligibility %;
-
• Cultural diversity – using English as additional language (EAL) %;
-
• Geography – using rural or urban classification:
-
• School type – using local authority maintained or academy status.
Cultural diversity, represented by English as an additional language (EAL),(Reference Strand, Malmberg and Hall33) was used in this study as an indicator of the complexity of providing meals to cater for cultural and religious food preferences. It is accepted that this may not capture all relevant scenarios for example, traditional Catholics requiring fish on Fridays and that speaking a different language at home may not be an accurate measure of cultural diversity.
To assess the impact of the missing catering provider data for 206 schools (11.6%) the mean values for the key characteristics of headcount, FSM% and EAL% were compared to the mean values for the other 1,565 schools to establish if they were representative of the population as a whole. ANOVA testing established that there was no significant difference in the mean characteristics (P > 0.05) of the unknown category compared to that of the remaining population, therefore, the decision was taken to close data collection and commence analysis.
Data analysis
The data (Figure 1) were uploaded to SPSS (IBM SPSS Statistics Version 29.0.2.0 (20)) for analysis. Data accuracy was checked by reviewing histograms and checking any outliers back to source data. One school was removed, as its data was found to relate to both secondary and primary pupils and separate data for primary pupils was not available. Data were tested for normality using histograms and the Shapiro-Wilk tests suitable for large datasets (n > 25). The variables of interest returned normal distribution curves on the histogram and Shapiro Wilks scores of >0.05 for headcount (P = 0.965), FSM% (P = 0.944), and EAL% (P = 0.682). Descriptive statistics for mean and standard deviation for headcount, FSM% and EAL% were run for provider type and local authority area. The 1,771 schools were summarised by school food provider and provider type for each local authority and presented in visual maps of provision (Figures 2–4) using Kumu mapping software.(34)
School meal provision in Yorkshire state funded primary schools by local authority area and provider type. Dark blue circles represent local authority areas, each local authority is denoted by a different number. School meals were provided by local authority caterers (light blue circles denoted with LAC plus a sequential number for each individual caterer), commercial caterers (yellow circles denoted with CC plus a sequential number for each individual caterer), or in-house caterers (one red circle denoted with IH). Circles and arrows are sized in proportion to the number of schools they represent.

Focused map of local authority catering school meal provision in Yorkshire state funded primary schools by local authority area. Dark blue circles represent local authority areas, each local authority is denoted by a different number. Light blue circles represent school meals provided by local authority caterers denoted with LAC plus a sequential number for each individual caterer. Circles and arrows are sized in proportion to the number of schools they represent.

Focused map of commercial catering school meal provision in Yorkshire state funded primary schools by local authority area. Dark blue circles represent local authority areas, each local authority is denoted by a different number. Yellow circles represent school meals provided by commercial caterers denoted with CC plus a sequential number for each individual caterer. Circles and arrows are sized in proportion to the number of schools they represent.

Figure 4. Long description
A focused map of commercial catering school meal provision in Yorkshire state-funded primary schools by local authority area. Dark blue circles represent local authority areas, each denoted by a different number. Yellow circles represent school meals provided by commercial caterers, denoted with CC plus a sequential number for each individual caterer. Circles and arrows are sized in proportion to the number of schools they represent.
The significance of differences between the continuous dependent variables of headcount, FSM% and EAL% and the independent categorical variable of provider type were tested. Whilst there was independence of observation in that no one school could have more than one provider, and the data met tests for normality, Levene’s test revealed that variances were not homogenous for all 3 characteristics tested; headcount (P = 0.005), FSM% (P = 0.001), and EAL% (P = 0.002). Therefore, Welch ANOVA with Games-Howell post hoc analysis was performed.
Findings
The majority of data were captured from lists provided by catering providers and public health departments (n = 1,243 schools), followed by the desk-based website review (n = 252 schools) with the survey establishing data for 70 schools (response rate: 3.9%). This left 206 schools for which no data was available, hereinafter referred to as ‘unknown’. The study identified three main provider contract types serving the 1,771 state funded primary schools in Yorkshire; (1) local authority caterer (49.3% of schools), (2) commercial caterer (30.2% of schools) and (3) in-house caterer (8.9% of schools). Mapping the supply of school meals in the area illustrated how complex and fragmented the provision was in Yorkshire (Figures 2–4). In local authorities that had a local authority catering service, except for one, they served most (between 49.4% and 92.3%) of the schools in their area. At the time of data collection, four local authorities had withdrawn from providing a local authority managed school catering service completely, one local authority serviced less than five schools, another outsourced provision to a commercial provider and another offered a partial provision where the school employs the kitchen staff. Where there was no local authority catering service in operation, schools were able to outsource to a local authority caterer from a different authority, or to a commercial caterer, or take provision in-house. Even in the areas which had their own local authority catering service, some schools used a local authority caterer from another area. The local authority area with the most schools using a local authority catering service (91.6%) had also been awarded Food For Life (Food For Life (part of the Soil Association) is a charity with an accreditation scheme to verify that the food served in a school demonstrates a commitment to climate, nature and health(60)) silver status. Commercial caterers serviced the most schools in three of the local authorities without a local authority catering service (80.9%, 78.8% and 64.0%) and the local authority where the service was outsourced (69.9%). Just five companies accounted for 78.3% of the commercial catering service and varied in size and structure from family businesses to global corporations. Each local authority area tended to have one particularly prominent commercial caterer. The other two areas without an active local authority catering service had high levels of unknown providers (52.4% and 49.3%). It is possible these were in-house catered as the providers could not be identified from the school websites. There were marginally more local authority maintained schools (51.7%), than academies (48.3%). A larger proportion of the academies used commercial (39.9%), or in-house (13.1%), caterers, compared to local authority maintained schools (21.1% and 5.0% respectively).
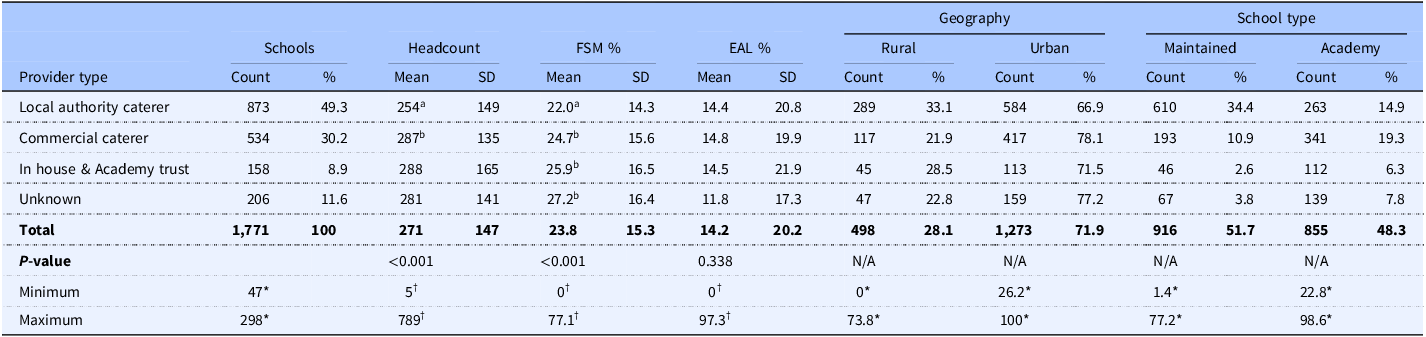
The characteristics of school size, FSM%, EAL%, geography and school type, of the schools, by each provider type, is summarised in Table 1. Approximately half of schools (49.3%) were served by a local authority caterer, commercial caterers served 30.2% of schools and in-house catering was less prevalent at 8.9%. The number of primary schools within each local authority area ranged from 47 schools to 298 schools and schools varied widely in size from 5 to 789 children (M = 271, SD = 147). The FSM% for schools ranged from 0 to 77.1% (M = 23.8%, SD = 15.3) and this wide variation occurred across all local authorities and provider types. There were also wide ranges in EAL% from 0 to 97.3% (M = 14.2% SD = 20.2) in all local authorities and provider types. The split of schools between urban and rural by local authority area varied widely from 26.2% in one area to another local authority with 100.0% of schools in urban locations. The majority of schools (71.9%) were in urban areas reflecting the large cities and towns in Yorkshire, with commercial caterers having a higher proportion of urban schools (78.1%) compared to local authority caterers (66.9%). The majority of rural schools (65.9%) were local authority maintained with the remainder (34.1%) being academies.
Number and percentage of state maintained primary schools in Yorkshire and characteristics by school meal provider type: headcount; deprivation (FSM eligibility %); cultural diversity (EAL %); geography; and school type

Table 1. Long description
The table summarizes the characteristics of schools by provider type, including headcount, FSM percentage, EAL percentage, geography, and school type. It has 10 rows and 12 columns. The columns are Provider type, Schools Count, Schools Percent, Headcount Mean, Headcount SD, FSM Percent Mean, FSM Percent SD, EAL Percent Mean, EAL Percent SD, Geography Rural Count, Geography Rural Percent, Geography Urban Count, Geography Urban Percent, School type Maintained Count, School type Maintained Percent, School type Academy Count, School type Academy Percent. The rows are Local authority caterer, Commercial caterer, In house & Academy trust, Unknown, Total, P-value, Minimum, Maximum. Row 1: Local authority caterer, 873, 49.3, 254, 149, 22.0, 14.3, 14.4, 20.8, 289, 33.1, 584, 66.9, 610, 34.4, 263, 14.9. Row 2: Commercial caterer, 534, 30.2, 287, 135, 24.7, 15.6, 14.8, 19.9, 117, 21.9, 417, 78.1, 193, 10.9, 341, 19.3. Row 3: In house & Academy trust, 158, 8.9, 288, 165, 25.9, 16.5, 14.5, 21.9, 45, 28.5, 113, 71.5, 46, 2.6, 112, 6.3. Row 4: Unknown, 206, 11.6, 281, 141, 27.2, 16.4, 11.8, 17.3, 47, 22.8, 159, 77.2, 67, 3.8, 139, 7.8. Row 5: Total, 1771, 100, 271, 147, 23.8, 15.3, 14.2, 20.2, 498, 28.1, 1273, 71.9, 916, 51.7, 855, 48.3. Row 6: P-value, <0.001, <0.001, 0.338, N/A, N/A, N/A. Row 7: Minimum, 47, 5, 0, 0, 0, 0, 0, 0, 1.4, 1.4, 22.8, 22.8. Row 8: Maximum, 298, 789, 77.1, 97.3, 73.8, 100, 77.2, 98.6.
a,b Mean values within a column with unlike superscript letters were significantly different (P < 0.05).
* Relates to data for local authorities.
† Relates to data for schools.
There were 372 schools (21.0%) with fewer than the 150 pupils necessary to financially breakeven.(20) The majority of these schools were local authority maintained (69.9%) and local authority catered (61.3%). The two local authority providers with the highest proportion of rural schools, (73.8% and 64.2%), also had the highest proportion of schools with less than 150 pupils at 59.1% and 43.1% respectively. The 25 smallest schools were all in rural locations situated in two of the 15 local authorities and 17 of these schools were catered by the local authority. Commercial caterers supplied only 20.2% of smaller schools. Local authority and commercial caterers had similar proportions of larger schools at 5.2%, 5.4% respectively, but in-house caterers had 8.9% of their portfolio with over 500 pupils. Overall, the difference in headcount means between provider types was significant (F 3-479 = 7.132, P < 0.001), with local authorities providing meals to much smaller schools (M = 254) than commercial and in-house (M = 288, 285 respectively). These significant findings in headcount were driven by differences between the two largest categories of local authority and commercial caterers.
Schools with a higher proportion of children eligible for FSMs were less likely to have a local authority catering provider (FSM%: M = 22.0%, SD = 14.3%,) compared to commercial caterers (FSM%: M = 24.6 SD = 15.5). Though it catered for fewer schools, in-house catering provided more food to families with the highest levels of deprivation (FSM%: M = 25.9 SD = 16.7). The difference in FSM% by provider type was statistically significant (F 3-470 = 8.813, P<0.001). There was no significant difference in EAL% of the children by provider type (F 3-492 = 1.458, P = 0.225), indicating that the complexity arising from cultural and religious food requirements may be similar between provider types.
Discussion
Given the significant public sector investment in financing school meals in England,(Reference Bonfield27) the link to improved child health outcomes,(Reference Holford and Rabe35,Reference Sharma, Coleman and Nixon36) and the current population health crisis(Reference Dimbleby37,38) it is surprising there is no central record of school meal providers. The provider types identified in this study were consistent with existing, but outdated, data for England.(Reference Wollny, Lord, Tanner, Fry, Tipping and Kitchen28,Reference Nelson, Lever and Nicholas29) The complex and fragmented school meal system in operation throughout Yorkshire revealed in this study, was also in line with previous international research,(Reference Nixon, Bryant, Sheard, Padgett and Doherty39) which may mean that the individual choice of provider is potentially more influential than the provision type. Furthermore, the lack of oversight and transparency in provision found in this study may have perpetuated a system where quality and compliance with school food standards is not consistently prioritised, measured or addressed. These shortcomings in the current system could conflict with public health objectives to address the current child health crisis. This is of particular importance given the increased advocacy and attention on the expansion of the public funding of FSMs as an intervention to address food insecurity and inequality for children.(8)
In line with previous findings,(Reference Morley and Morgan7,Reference Wollny, Lord, Tanner, Fry, Tipping and Kitchen28,Reference Nelson, Lever and Nicholas29,Reference Nixon, Bryant, Sheard, Padgett and Doherty39) provision of school meals fell into three categories of provider types: local authority caterer, commercial caterer, and inhouse caterer. The proportion of provision across these three catering types, has changed considerably in Yorkshire, since the School Food Plan in 2013,(Reference Nelson, Lever and Nicholas29,Reference Dimbleby and Vincent40) with fewer schools now serviced by local authority caterers (49.3% compared to 81.6%). More schools are now serviced by commercial caterers (30.2% compared to 14.8%) or have in-house caterers (8.9% compared to 3.5%). This study also provided a more complete picture of the region than the previous surveys with data for all 15 local authorities and commercial caterers included. The structure of the provision has also changed. Four of the 15 local authorities in Yorkshire had withdrawn their own schools catering service entirely, the numbers of another were so low that financial viability was unlikely, and two more operated hybrid models in collaboration with commercial or in-house providers. One explanation for this migration could be the academisation of schools which allowed state funded schools to operate independently of local authority control.(Reference Male6) Academies manage their own budgets and operations enabling school leaders to cut costs or make a profit from their school meal service.(Reference Swensson and Tartanac41,Reference Hacking42) Whilst academies existed at the time of the school food plan in 2013, the numbers were relatively small (1,000 schools representing 6.0% of English state funded primary schools) and their prevalence has since increased dramatically.(Reference Male6) Of the 1,771 schools in this study, 48.3% were academies compared to 7.0% in 2013,(30) although this varied considerably by local authority. Of these academies, 30.8% were serviced by local authority caterers, 39.9% by commercial caterers, and 13.1% had an in-house caterer which compared to a split of 66.6%, 21.1%, and 5.0% respectively for local authority maintained schools. The 2015 Department for Education survey(Reference Wollny, Lord, Tanner, Fry, Tipping and Kitchen28) also noted that, on a national basis, more (61.0%) local authority maintained schools had a contract with a local authority caterer and that academies had a more diverse service (41.0%, local authority catering, 35.0% private catering, and 22.0% having an in-house provision). There was also a lack of transparency over provision for 11.6% of schools where it was not possible to identify the provider from publicly available records, increasing from 0.1% since the last survey data was collected for the School Food Plan.(Reference Dimbleby and Vincent18,Reference Nelson, Lever and Nicholas29) This decrease in transparency has coincided with the increase in academisation, with unknown data for academies more than double that of local authority maintained schools in this study (16.3% and 7.3% respectively).
In Yorkshire, around a third of schools had their school meals provided by commercial caterers, with just five catering companies supplying almost 80.0% of these schools. The five commercial caterers varied in size and structure, from family businesses to global corporations with a turnover ranging from £46m to £31bn.(43) Previous research has noted that reasons for using commercial caterers were often related to decreasing the cost of meal provision through market competition and economies of scale.(Reference Williams, Moyo, Papa, Miller and Beyler44,Reference Ebdon, Chen, Bryce Hoflund, Jones and Pautz45) However, it also found this did not always occur in practice, as costs for the management of the contract often offset any economies of scale from the contractors and winning the contract at too low a price could lead to costly renegotiations and some contractors not meeting expectations on cost or quality.(Reference Ebdon, Chen, Bryce Hoflund, Jones and Pautz45,Reference Chiaverina, Raynaud, Fillâtre, Nicklaus and Bellassen46) Research has found that good practice was possible across all provider types and the individual choice of provider may be more important than the type.(Reference Nixon, Bryant, Sheard, Padgett and Doherty39) However, the issues over financial viability and the reduction in local authority provision found in the current study mean that choice of provider for schools may be more limited in the future as the ability for any dissatisfied schools to return to their previous public sector service may have disappeared.(Reference Nixon, Bryant, Sheard, Padgett and Doherty39) This could have an undesirable impact on quality as competition reduces in an unmonitored market place where providers are left to self-regulate.
In this study, it was not possible to identify who supplied 11.6% of the schools from publicly available information. Better records and a more collaborative and comprehensive approach between providers and public health teams would be needed to understand and effectively manage school food quality in such a complex and fragmented system. Without this, it is difficult to fully understand whether school meals adequately support public sector health goals or to devise an appropriate and effective strategy to address any shortcomings.
The wide variation in the size of the schools found across Yorkshire added further complexity to the provision. As 21.0% of schools (n = 372) had less than the 150 pupils needed for a school meal service to financially break even(20) this may impact on the quality of school meals. Moreover, if a typical 70% uptake figure is applied to the 150 meals served,(20) the total number of pupils required in a school for a financially viable school meals service increases to 215 and suggests that 41.2% (n = 729) of Yorkshire schools are unlikely to break even. This is likely to have exacerbated in recent years as food prices have risen and caterers have been forced to cut costs.(Reference Hacking42) The data indicated that the profitability potential was likely to differ by provider. For example, the commercial caterers had the most potentially profitable profile, with the biggest proportion of large, urban schools and a higher mean FSM% entitlement of the three provider types. By contrast, local authority caterers were more likely to cater for small, rural schools with the lowest levels of FSM% entitlement, which is the least potentially profitable profile and was likely to affect their financial viability. In the past, this may have been managed on a whole portfolio basis, whereby profits made from the larger schools could be used to fund the meal service in the smaller schools.(Reference Morley and Morgan7,47) Schools with greater registration of means tested FSM can increase uptake of school meals to more profitable levels, and the school receives linked additional pupil premium funding for every child who is registered for FSM. This would suggest that the provision of FSMs may have a role to play in supporting the financial viability of the school meals service through increased uptake. This study found a higher proportion of FSM eligibility in the schools catered in-house and commercially compared to those served by local authority caterers. These key indicators of school meal profit potential may signal that local authorities are more likely to struggle with the financial viability of their provision and may explain why four of the Yorkshire authorities no longer have their own catering service.
Many school leaders have the freedom to choose the provider of their school meals, enabling larger schools with higher meal uptake (and therefore higher potential profitability), to either outsource their provision to a commercial provider or to cater in house to generate additional income for the school.(Reference Williams, Moyo, Papa, Miller and Beyler44,Reference Ebdon, Chen, Bryce Hoflund, Jones and Pautz45) This is supported by the study findings that in-house and commercially catered schools were larger and had higher deprivation rates. The financial records of the commercial caterers reveal they were profitable overall(43) which was in direct contrast to the local authorities found to be operating school meal services at breakeven or loss.(Reference Hacking48)
Research has found that quality was often compromised where school meal provision was not financially viable.(Reference Hacking42) This, in part, related to the relative expense of healthy food which UK research, looking at consumer pricing, found to cost £0.81 per 100 kcal compared to £0.33 per 100 kcal for less healthy alternatives.(Reference Hoenink, Garrott, Jones, Conklin, Monsivais and Adams49) In addition, rising costs and the lack of ring-fencing of school meal budgets, has led to some school leaders redistributing funds to other budget areas such as education, further impacting food quality.(Reference Hacking42,47) The poor dietary health of children, which is worse in deprived areas,(50,Reference Goisis, Sacker and Kelly51) means it is important to understand the provision and to ring-fence budgets to ensure that funding goes directly to the provision of high-quality school meals. Research(Reference Holford and Rabe35) found that providing high quality FSMs subject to rigorous nutritional requirements reduced the prevalence of obesity and BMI within a year. However, this research has highlighted a complex and fragmented system, which make it a challenge to fully understand the level of meal quality being provided for children.
The suitability of a devolved model for the provision of key public services, such as school food and the impact on the quality of meals provided is debated.(Reference Morley and Morgan7,Reference Dimbleby and Vincent40,52) Whilst all provider types were found to struggle to operate a financially viable service in competition with ‘cheap junk food’(Reference Morgan and Sonnino5) there were differences in organisational drivers, which could impact a provider’s attitude towards food quality. For example, previous research noted that the competing priorities of commercial providers included the potentially conflicting purpose of making a profit.(Reference Swensson, Hunter, Schneider and Tartanac53,Reference Galli, Brunori, Di Iacovo and Innocenti54) Local authorities were often constrained in terms of budget availability, higher staff costs and responsibility for subsidising small schools which are not financially viable.(Reference Morgan and Sonnino5,Reference Dimbleby and Vincent18) In-house cooks were found to lack the purchasing power to keep supply costs low and had limited access to nutritional and operational support.(Reference Ebdon, Chen, Bryce Hoflund, Jones and Pautz45) Without a transparent and collaborative system it is difficult to establish how all providers could receive adequate economic returns to facilitate a high quality provision without making an excessive profit at the expense of scarce public funds.(Reference Morgan and Sonnino5,55)
Strengths and limitations
This study addressed the gap in knowledge relating to who provides the school meals across a large geographical area (Yorkshire) through mapping an up-to-date picture of provision by triangulation of a variety of sources. The urgency of the child health crisis and increased advocacy for extending FSMs means the research is both timely and relevant. The provision in Yorkshire may not accurately reflect the national provision; however, in the absence of any other current data, mapping the provision of 10.0% of the English primary school population provides a useful approximation for research, policy and practice.
The lack of public record and difficulty obtaining information from individual schools, where busy school leaders have many other priorities, makes this research novel and valuable. However, these difficulties also meant that a complete data set could not be included. To mitigate the risk of the incomplete data not being representative of the Yorkshire primary school provision, the mean values for the characteristics from the missing schools were compared to the mean values of the population as a whole to ensure they were representative.
The nuances in provision required assumptions to be made with the categorisation of provider types. There were 76 schools outsourced by the local authority which were included in the commercial caterer category. Arguably, they could have been classified as local authority; however, it was felt that the commercial catering category better aligned with the type of provision because the commercial caterer was providing the meals on a day-to-day basis. To reclassify these schools as provided by the local authority would increase the local authority catered to 53.6% and reduce the commercial catered to 25.9%. Similarly, the 97 schools with local authority catering support to in-house staff employed by the school were classified as local authority provision for the purpose of this study as the majority of the service was provided by the local authority. To reclassify these schools as an in-house provision would increase the in-house catered to 14.4% and reduce the local authority catered to 43.8%.
Further research and implications for policy
This study provides a better understanding of the provision of primary school meals in Yorkshire. Further work to understand how the provider types identify, define and specify the nutritional quality of the meals provided, alongside insight into the motivations, challenges and key influences driving the choice of provision type, would help to establish whether the school food system may better support the provision of high-quality meals. This is important, given the significant public sector investment and urgent requirement to improve child health in England.
When these findings are taken in conjunction with no one central government department being responsible for school food(Reference Parsons and Barling56) it may explain why such an influential lever to address the current health crisis has remained largely unmanaged and untapped to date. Given that local authorities are tasked with supporting public interests, there are opportunities to link social, health and environmental goals through a well-managed school meal provision. Some English local authorities are actively prioritising school food in this way,(57–59) however, robust, independent evaluation is lacking. Furthermore, the small number of commercial providers (just 5 companies accounted for 78.3% of the commercial provision) should facilitate a transparent, beneficial working relationship with public health departments to ensure a high quality school meal provision at an acceptable level of remuneration as was previously demonstrated in Italy.(Reference Morgan and Sonnino5)
Conclusion
This study addressed the lack of knowledge over who provides school meals to children. It confirmed findings from existing, but often outdated, research that the school food system is complex and fragmented. The large migration from a public sector school meal provision, mainly to commercial caterers, occurring over the last decade has contributed to a lack of transparency for public health teams. Furthermore, the significant differences in school characteristics by provider type and subsequent issues with financial viability found are likely to affect the quality of meals served to children. The current opaque system could perpetuate the provision of poor-quality meals which do not meet the nutritional needs of children without public knowledge or redress. The increased fragmentation in the provision makes it more difficult to monitor and establish the quality of school food being provided to children and to devise an effective strategy to discover and address any shortcomings. The relatively small number of caterers operating in the area provides potential for adequately resourced public health teams to work collaboratively, monitor quality and address any shortcomings. The findings from this study can be used to devise a systems approach to policy and practice appropriate to this complex and fragmented system which will optimise the potential for public sector investment in school meals to address declining child health.
Author contribution
Conceptualisation, methodology, investigation, formal analysis, writing: Nicola Nixon Supervision, review & editing: Maria Bryant, Bob Doherty.
Financial support
This work is supported by the FixOurFood programme (BB/V004581/1) funded by the UK Research and Innovation (UKRI) Transforming UK Food Systems Programme.
Competing interests
None.



 Open access

