I. INTRODUCTION
Meso-, Micro-, and nanoporous dielectrics used as insulating materials between on-chip interconnects are a crucial component in the leading-edge microelectronic products to reduce electrical signal delay and power loss.Reference Maex, Baklanov, Shamiryan, Iacopi, Brongersma and Yanovitskaya1 Beyond the current state-of-the-art 22 nm complementary metal oxide semiconductor technology, the insulating materials need a dielectric constant, k, below 2.2 and elastic modulus, E, above 5 GPa. These stringent requirements for dielectric properties and mechanical stability can be achieved for porous organosilicate glass (OSG) by optimizing molecularReference Dubois, Volksen, Magbitang, Miller, Gage and Dauskardt2 and poreReference Gates, Dubois, Ryan, Grill, Liu and Gidley3 structures. However, the structure–property relationship for porous OSG is highly complex and not fully understood yet.
The relationship between elastic modulus (E) and porosity (p) for OSG films is conventionally described by a simple power law equationReference Dubois, Volksen, Magbitang, Miller, Gage and Dauskardt2,Reference Jain, Rogojevic, Gill, Plawsky, Matthew, Tomozawa and Simonyi4 :
 $$\eqalignb{ \;\;\;E = C{\rm{(}}1 - p{\rm{)}}^n\quad , \cr \!\!\!\!\!\!\!\!{\rm{\rho /\rho }}_{\rm{s}} = 1 - p\quad, \cr}$$
where C is a constant dependent on the stiffness of the solid matrix, ρ and ρs are the density of the composite and the matrix, respectively. It was shown that the power law exponent, n, can be correlated with the pore interconnectivity of porous silica films,Reference Jain, Rogojevic, Gill, Plawsky, Matthew, Tomozawa and Simonyi4 e.g., n < 2 for closed-cell “foam” and n > 2 for opened-cell foam. Dubois et al.Reference Dubois, Volksen, Magbitang, Miller, Gage and Dauskardt2 showed n = 1 for OSG with a Si–C–Si network structure, and n > 1 for OSG with a Si–CH3 terminal structure. Overall, the power law equation is useful for the qualitative demonstration of the E–p relationship for the porous material. However, during an increase of p from 0 to a higher value, the degree of pore interconnectivity can change as well. Therefore, the power law equation is not sufficient to model the relationship between porosity, pore topology, and elastic modulus of an OSG film quantitatively.
In this study, OSG films with several porosity levels and different pore topology are characterized using nanoindentation (NI) and positron annihilation spectroscopy (PAS). Furthermore, a general map of the relationship between porosity, pore topology, and elastic modulus is simulated for porous materials using finite-element modeling (FEM). The elastic modulus values determined from NI for several porosity levels are plotted into the simulated map to predict the OSG pore structure or topology. PAS results are used to evaluate the accuracy of the pore topology prediction, particularly the prediction of a threshold value where pore interconnectivity will suddenly increase.
II. ORGANOSILICATE GLASS
Table I presents the physical properties of porous OSG thin films fabricated using plasma-enhanced chemical vapor deposition (CVD-OSG) and a self-assembly process (SA-OSG). The SA-OSG films with uniform microporesReference Smirnov, Vanstreels, Verdonck, Ciofi, Shamiryan, Baklanov and Phillips5 (narrow pore size distribution, translation-symmetric arrangements of the pores) are achieved via alignment of an alcohol-based hydrolyzed alkylated silica sol by amphiphilic triblock copolymers in a sol–gel template synthesis process.Reference Zhao, Feng, Huo, Melosh, Fredrickson, Chmelka and Stucky6 The precursor sol is deposited on a bare Si or on a SiCN-coated Si substrate by spin coating. The amphiphilic triblock copolymers act as porogen and are evaporated upon thermal or UV curing, leaving a porous silica network connected to alkyl groups as part of the network or terminal bonds. On the other hand, the CVD-OSG filmsReference Wang, Ganor, Rokhlin and Grill7,Reference Grill, Patel, Rodbell, Huang, Baklanov, Mogilnikov, Toney and Kim8 are used as reference materials to compare the elastic modulus values of several OSG materials with different pore topologies quantitatively.
Sample description for CVD-OSG and SA-OSG films.

The surface topography of both CVD-OSG and SA-OSG films are measured using an atomic force microscope (AFM). All the films have extremely flat surfaces. The maximum peak-to-valley roughness value found on a 2 × 2 μm scan area on the OSG film is <1 nm. Therefore, the influence of surface roughness on the indentation contact area on these OSG films is small. Since the surface roughness can only lead to a small random error on the indentation results, it was neglected to simplify the finite-element analysis.
III. EXPERIMENTAL METHODOLOGY
A. Nanoindentation
Small (penetration depth, h < 20 nm) and precise displacement-controlled indentations (feedback speed, 78 kHz) on both types of OSG films listed in Table I were performed using a Hysitron TI950 nanoindenter tool (Hysitron Inc., Minneapolis, MN). In these indentation experiments, only the rounded end of the Berkovich diamond indenter tip was in contact with the samples. The effective radius of curvature, R, of the tip was calibrated from a series of small indentations on a fused quartz sample, applying the Hertz model,Reference Yeap, Kopycinska-Muller, Hangen, Zambaldi, Hubner, Niese and Zschech9
 $$P = \left( {{4 \over {3{\rm{\pi }}}}} \right)E_{\rm{r}} R^{0.5} (h - h_0 )^{1.5} \quad,$$
where E r is the reduced modulus (combining tip and sample), and h 0 is a fitting parameter for zero position. In our previous study,Reference Yeap, Kopycinska-Muller, Hangen, Zambaldi, Hubner, Niese and Zschech9 a Berkovich indenter tip was calibrated with several isotropic and anisotropic materials (Appendix). The effective tip radius, R, was determined to be about 114 nm for penetration depths in the range of 1–15 nm. The same Berkovich tip was used in this study. Using the calibrated tip radius, R = 114 nm, the E r values of the OSG films were determined by fitting the load–penetration (P−h) curves with the Hertz model. Since the penetration depth was about 10 nm and the film thickness was >500 nm, the effect of the Si substrate on the E R value was negligible.
B. Positron annihilation spectroscopy
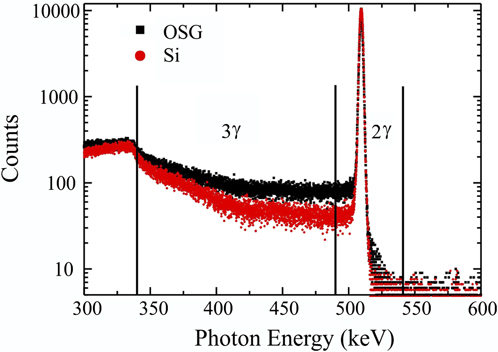
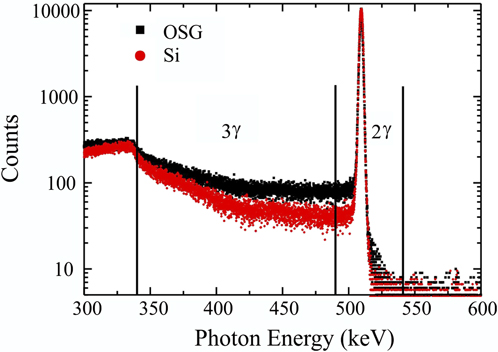
In PAS, positrons were generated by applying a 22-Na source. In a porous system, positronium (Ps) can be formed as a bound state between a positron and an electron. The majority of the Ps is generated as ortho-positronium (triplet state, o-Ps) with parallel spins (3γ decay), while the rest is generated as para-positronium (singlet state, p-Ps) with opposite spins (2γ decay).Reference Grill, Patel, Rodbell, Huang, Baklanov, Mogilnikov, Toney and Kim8,Reference Schultz and Lynn10 In vacuum, the lifetimes of o-Ps and p-Ps are 142 and 0.125 ns, respectively. The p-Ps lifetime is insensitive to the changes of the porous structure. On the other hand, the o-Ps lifetime can be reduced from 142 to 0.7 ns by a “pick-off” annihilation mechanism, depending on porosity and pore interconnectivity. Basically, the o-Ps can bounce between pore walls and exchange the electron of the parallel spin to the electron of the opposite spin, leading to a wide range of photon energy. Using a high-purity Ge detector, photon energy spectra (Fig. 1) were collected to determine the 3γ annihilation ratio, 3γ/(3γ + 2γ), or namely the R parameter, as a function of the positron energy or the depth of travel. The R parameter was used to determine the threshold value for pore overlapping. In addition, the measurements were performed with a Tungsten aperture being attached to filter away positronium, which could have escaped through widely connected pores into the vacuum. For porous structures with overlapping pores, the probability for positronium to escape into the vacuum is significantly higher. Therefore, the comparison of the R parameter for measurements with and without aperture can indicate the threshold value for pore overlapping.
PAS photon energy spectra for an OSG film and for a Si wafer.
IV. FINITE-ELEMENT MODELING
Finite-element simulations were performed using the commercial software ABAQUS.11 Two kinds of representative microstructures encountered in the porous films, i.e., randomly distributed poresReference Roberts and Garboczi12 and ordered pores, corresponding to CVD-OSG and SA-OSG films, respectively, were modeled applying the concepts of representative volume element (RVE) and repeating unit cell (RUC). The microstructures were explored for porosity levels in the range of 0–50%. The effective elastic modulus, E eff, was calculated from the average stress and strain quantities defined in the RVE or RUC concepts, using Hooke’s law
 $${{\bar \sigma }} = E^{^{{\rm{eff}}} } {{\bar \varepsilon }}\quad.$$
The underlying hypothesis of the FEM calculation of the effective mechanical properties is that the matrix material is homogeneous down to the molecular scale. The FEM calculation of E eff only accounts for the influence from different pore topologies (size distribution, shape, and arrangement of the pores). To predict the pore topology by comparing the experimentally measured E values with the values of E eff from simulation, it is important to ensure that the indentation elastic deformation zone includes only a single domain with identical pore topology. All FEM calculations in this study were performed using 10-node quadratic tetrahedral elements. Also, a mesh refinement with a seed size 10 times smaller than the characteristic pore diameter was used in the vicinity of the pores.
A. Random model
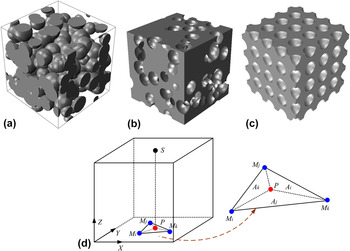
Random models, also referred to as statistical models, are generated using the “Boolean” scheme: objects are placed at random (uncorrelated) points in space.Reference Roberts and Garboczi13 Since the objects are uncorrelated, they can overlap. In this study, we considered an overlapping solid spheres model [Fig. 2(a)] and its inverse, an overlapping spherical pores model. The latter model was obtained by creating pores in a solid matrix [Fig. 2(b)].
Scheme of the models for porous materials: (a) random overlapping spherical solids model, (b) random overlapping spherical pores model, (c) ordered nonoverlapping pores model. (d) Scheme of the triangular shape function used to maintain periodicity on the top and the bottom faces for the ordered nonoverlapping pores model.

Since the properties of a homogeneous material are independent of the boundary conditions, it is expected that the effective material properties of a statistically homogeneous material are also independent of the boundary conditions. Therefore, the effective stiffness of these porous structures was calculated by imposing a homogeneous normal displacement on two opposite faces of the cube, while enforcing traction-free boundary conditions on the other faces. The loaded faces were allowed to contract or to expand laterally without any constraint. The average normal stress was calculated from the nodal reaction forces on one of the loaded faces and the nominal cross-sectional area. At least five random structures were examined for each level of porosity to evaluate variations caused by the statistical nature of the microstructure. The pore diameter was kept ≤2% of the edge length of the model. A relative standard deviation below 2% was observed for these five random structures, validating the RVE concept.
B. Ordered model
The ordered model was created by cutting spherical pores at selected positions according to a simple cubic structure. All the spherical pores have a fixed pore diameter. Figure 2(c) shows the ordered model consisting of a “unit cell” that includes 64 pores. The distances between two adjacent pores were kept larger than the pore diameter to prevent overlapping of pores and adjusted until the target porosity was reached. This model has a threshold value of 52.5% porosity. Above this threshold value, the spacing of the pores approaches the pore diameter and the pores start to overlap.
Since each unit cell is indistinguishable from the next, the response of the entire array of unit cells under macroscopically uniform loading is identical to the response of a single cell under the same loading. The value of E eff was obtained by imposing uniaxial (normal) displacement, D z, on the top and bottom faces, X−Y planes, of the unit cell, while subjecting them to periodic in-plane displacements. Regarding the other four faces, the in-plane displacements are constraint with periodicity while enforcing traction-free boundary conditions in the normal directions.
Figure 2(d) demonstrates a node constraining strategy applied to the model to ensure that Eq. (2) is valid for the evaluation of the effective modulus. The displacement difference between any node S and its corresponding projection on the counterpart face, P, can be expressed as
 $$u_S^x = u_P^x {\rm{,}}\,u_S^y = u_P^y ,\,u_S^z = u_P^z - D_z \,\,{\rm{for}}\,\,X - Y\,{\rm{plane}}{\rm{\quad.}}$$
Simultaneously, the Y−Z plane (including left and right faces) and X−Z plane (including front and back faces) are enforced by the following constraining equations:
 $$\eqalign{ u_S^y = u_P^y {\rm{,}}\,u_S^z = u_P^z ,\,T_S^x = T_P^x = 0\quad \,{\rm{for}}\,Y - Z\,{\rm{plane,}} \cr u_S^x = u_P^x {\rm{,}}\,u_S^z = u_P^z ,\,T_S^y = T_P^y = 0\,\quad {\rm{for}}\,X - Z\,{\rm{plane}}{\rm{.}} \cr}$$
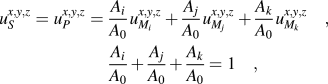
These periodic boundary conditionsReference Xia, Zhang and Ellyin14 cause one important issue when the model is meshed. It is not guaranteed that the nodes on counterpart faces would perfectly coincide with each other on two faces. These node mismatches present a particular challenge for maintaining periodic boundary conditions during deformation, as it is impossible to define node–node pairs directly. To solve this problem, a simple triangular shape function is proposed. As shown in Fig. 2(d), the node S and its corresponding projection on the counterpart face, P, probably do not coincide with a node of the mesh but fall within a triangle enclosed by three mesh nodes of M i, M j, and M k. To maintain periodicity on two counterpart faces, the displacement of these mesh nodes are tied together by the following equations:
 $$\eqalignb{ u_S^{x,y,z} = u_P^{x,y,z} = \,{{A_i } \over {A_0 }}u_{M_i }^{x,y,z} + {{A_j } \over {A_0 }}u_{M_j }^{x,y,z} + {{A_k } \over {A_0 }}u_{M_k }^{x,y,z} \quad, \cr\, {{A_i } \over {A_0 }} + {{A_j } \over {A_0 }} + {{A_k } \over {A_0 }} = 1\quad, \cr}$$
where A i, A j, and A k are the areas of the three sub-triangles in Fig. 2(d) and A 0 is the sum of three. The concept presented above can also be extended to other shape functions depending on the specific element type.
V. RESULTS AND DISCUSSIONS
A. Pore structure
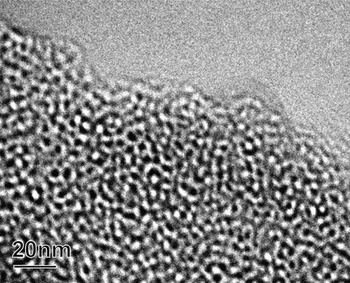
Figure 3 shows a transmission electron microscopy (TEM) image of the SA-OSG2 material with 42% porosity after thermal curing. Since the thickness of the TEM lamella is more than 10 times larger than the pore size, the observed structure might be a result of a superposition of two or more pores located at different depths within the TEM lamella. From this TEM image, it is difficult to determine whether the pores are interconnected by a small neck or whether they are overlapping at a large degree. To predict the threshold value at which the pores start to overlap at random positions, a combined FEM simulation and NI study is performed. Additionally, PAS is performed to confirm the threshold value for the closed-pores to connected-pores transformation based on the decay of Ps in the SA-OSG films.Reference Petkov, Wang, Weber, Lynn and Rodbell15
TEM image of a thermally cured SA-OSG film with 42% porosity (SA-OSG2).

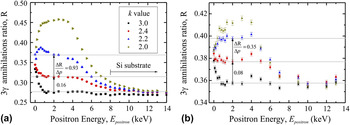
The PAS R parameterReference Petkov, Wang, Weber, Lynn and Rodbell15 is used here to determine the threshold value. Figure 4 shows the R parameter (3γ annihilation ratio) as a function of the positron energy for measurements (i) without and (ii) with aperture. The higher the positron energy, E positron, the deeper the positron migrates into the sample. The mean depth of the positron is given byReference Schultz and Lynn10,Reference Garcia, Schut, Siebbeles and van Veen16
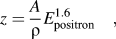 $$z = {A \over {\rm{\rho }}}E_{{\rm{positron}}}^{1.6} \quad,$$
where A is an empirical parameter (4 μg/cm keV−r) and ρ is the film density (0.9–1.3 g/cm). At E positron = 2 keV, the calculated mean depth of travel in porous OSG is approximately 100 nm. At E positron < 1 keV, the R parameter is affected by an undesired surface effect.Reference Schultz and Lynn10 Therefore, the comparisons of R parameter for SA-OSG with different porosity and k values are made at E positron = 2 keV. Also, it is important to note that the R parameter for measurements with aperture is generally higher than those without aperture due to the Compton scattering in the aperture.Reference Schultz and Lynn10 For comparing the results without and with aperture, the variation of R parameter per unit increase of porosity should be determined instead of the exact value of the R parameter.
PAS R parameter obtained from several positron energies in SA-OSG films with different porosity levels: (a) without and (b) with aperture.

The SA-OSG film with k = 3 and no porogen is used as the reference line in the R–E plot (Fig. 4). When the film porosity is close to zero, the R parameter is equal to 0.35 at the film surface, and it declines to 0.27 in the film and near the Si substrate for the measurement without aperture [Fig. 4(a)]. The increment of porosity obviously causes an increase of the R parameter, as the free volume promotes 3γ and 2γ annihilations while the matrix promotes 2γ annihilation. The magnitude of this effect can be calculated as the change in R parameter per unit increase of porosity, ∆R/∆p. As the porosity is increased from 0 to 0.24, the values of ∆R/∆p for measurements without and with aperture are 0.16 and 0.08, respectively. At further increment of p from 0.24 to 0.3, the values of ∆R/∆p for measurements without and with aperture are 0.93 and 0.35, respectively. Comparing the first increment of p (0–0.24) to the second increment of p (0.24–0.3), the values of ∆R/∆p for measurements without and with aperture in the second increment of p are about 6 times and 4 times larger than those in the first increment of p. o-Ps confined in a pore loses its energy during inelastic interaction with the pore walls, leading to a lower R parameter. A randomly overlapping pore structure presents “express routes” for the o-Ps to quickly escape to the film surface with less interaction with the pore walls. Therefore, the R parameter increases to a larger extent, i.e., ∆R/∆p is higher for an overlapping pore structure. This R parameter analysis clearly indicates that the threshold for the transition from a nonoverlapping to an overlapping pore structure occurs at P = 0.3 for the SA-OSG films.
Comparison of the ∆R/∆P values for measurements without and with aperture provides further evidence of the pore topology transition threshold value. When the aperture is attached, the differences in ∆R/∆P values between the two porosity ranges become smaller, i.e., [(∆R/∆p)0.24<P<0.3 − (∆R/∆p)0<P<0.24]aperture < [(∆R/∆p)0.24<P<0.3 − (∆R/∆p)0<P<0.24]no aperture. 3γ annihilation from the Ps escaped into vacuum is discounted by the aperture, while 3γ annihilation from the Ps within the pore is accounted in both measurements with and without aperture. A porous structure with overlapping pores would promote both of these 3γ annihilation mechanisms. On the other hand, only by increasing porosity without pore overlapping would not promote Ps to escape into vacuum. In other words, at the transition threshold, the measurement without aperture would record significantly higher ∆R/∆P values as compared to the measurement with aperture (as shown in Fig. 4). The differences in the ∆R/∆P values for different porosity ranges and for measurements without and with aperture pose strong evidence of the pore structure transition threshold.
B. Relationship between porosity, pore topology, and Young’s modulus
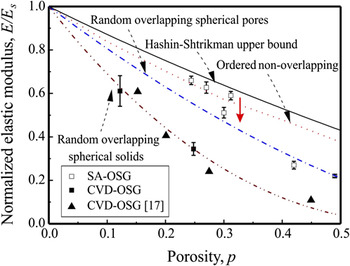
A general map of the relationship between porosity, pore topology, and Young’s modulus is developed to allow the estimation of one parameter if two others are known. Figure 5 shows the map of normalized elastic modulus, E/E s versus porosity p for several pore topologies. For simplicity, we categorize the pore structure for OSG films into three types: (i) random overlapping spherical solids, (ii) random overlapping spherical pores, or (iii) ordered nonoverlapping spherical pores.Reference Li, Lin, Tsui and Vlassak17 The Hashin–Shtrikman (HS) model for the optimal pore structure is added as the upper bound.Reference Hashin and Shtrikman18 As shown in Fig. 5, the E/E s values at a defined p differ significantly for different pore structures.
Plot of the normalized elastic modulus against porosity (E/E s versus p) for several FEM models: random overlapping spherical solids, random overlapping spherical pores, ordered nonoverlapping pores, and HS upper bound. Experimental results for SA-OSG (opened boxes) and CVD-OSG (closed boxes and triangles) films are inserted.

Besides porosity and pore topology, the chemical bonding in the network of the OSG matrix, e.g., Si–C–C–Si or Si–O–Si, also affects the E values of OSG materials.Reference Dubois, Volksen, Magbitang, Miller, Gage and Dauskardt2 However, the normalized E/E s versus p trends obtained from FEM calculations are independent of the pore size and matrix property. If the elastic modulus of the solid matrix, E s, is known for the OSG film, the E/E s versus p trends in Fig. 5 can be used as a general map to predict the pore topology of an OSG film. Consequently, the local fluctuation of the pore structure, e.g., domains with different pore arrangements, can be deduced from the standard deviation of E/E s values at different indentation locations (Fig. 5). In this study, E for CVD-OSG and SA-OSG films with a porosity level close to 0 is taken as E s.
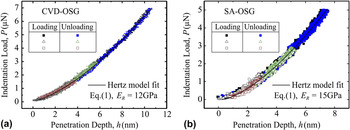
Small indentations on the OSG films show load–penetration (P–h) curves with a fully elastic response. Figure 6 shows the P–h curves fitting with the Hertz model for CVD-OSG and SA-OSG films with no porogen loading. The resulting E R value can be converted to E since E and ν of the diamond indenter tip are well known as 1142 GPa and 0.07, respectively. The Poisson ratio for both films can be assumed as 0.2. Using the small indentation approach, E of both the CVD-OSG and the SA-OSG films are determined as a function of p.
Load–penetration depth (P–h) curves obtained from small indentations on (a) CVD-OSG and (b) SA-OSG films. The loading curves and the unloading curves show complete matching with each other, indicating a fully elastic deformation. The elastic modulus can be determined by fitting the P–h curves with the Hertz model.

The experimental NI results from small indentations on the CVD-OSG and the SA-OSG films are plotted into the general map of E/Es versus p (Fig. 5). The conclusion that the CVD-OSG films follow the random overlapping spherical solids model [Fig. 2(a)] is in good agreement with a previous studyReference Li, Lin, Tsui and Vlassak17. These observations are as expected for porous materials with broad pore size distribution since the porogen molecules that are not functionalized to self-align would naturally agglomerate as the porogen loading increases. On the other hand, the NI results for the six SA-OSG thin films are scattering between the HS upper bound, the ordered nonoverlapping spherical pores model, and the random overlapping spherical pores model, with a clear dependence on the porosity (Fig. 5). Based on these experimental data, it can be deduced that the pore topology of SA-OSG with P < 0.3 follows the ordered nonoverlapping pores model [Fig. 2(c)], while those with 0.3 < P < 0.5 follows the random overlapping spherical pores model [Fig. 2(b)]. The threshold porosity value at which the pore interconnectivity increases significantly can be deduced to be at P = 0.3 (red arrow in Fig. 5). This deduction is in agreement with the observations from PAS 3γ annihilation ratio, which indicate a threshold value for pore overlapping at P = 0.3. The TEM image taken on a SA-OSG film with P > 0.3 also suggests a porous structure of random overlapping spherical pores (Fig. 3).
The self-assembly process used in this study resulted in porous OSG thin films with a pore interconnectivity threshold value of P = 0.3. Furthermore, the small error bars in the E/E s versus p plot suggest that the pore topology of SA-OSG is very consistent over a 100 × 100 μm area tested for each sample. However, the theoretically highest achievable porosity in a nonoverlapping simple cubic arrangement of pores is at P = 0.52 (Sec. IV. B). To develop a mechanically reliable porous low-k material with a k-value below 2, the self-assembly process needs to be further optimized to achieve ordered nonoverlapping topology at P = 0.5.
VI. CONCLUSION
This paper presented a general map for the relationship between porosity, pore topology, and Young’s modulus. The elastic modulus values of porous OSG films were determined using the NI method, the porosity values were estimated based on the quantity of porogen molecules added, while the pore topology and the threshold value for a significant increase in pore overlapping were determined by PAS. The results from simulations and experiments are in excellent agreement. Most importantly, the threshold value for overlapping pores as predicted from the E/E s–p plots based on NI measurements is consistent with the R parameter based on PAS studies. The combined indentation experiment and modeling approach proposed in this study can be further extended to more complex porous materials, e.g., visco-elastic matrix materials and pore topology with cylindrical shape pores.
ACKNOWLEDGMENTS
The authors would like to thank Reinhold Dauskardt (Stanford University), Geraud Dubois (IBM), and Wilmer R. Bottoms (SBA Materials) for valuable discussions. M.K.-M. acknowledges support from Deutsche Forschungsgemeinschaft Grant No. KO 3825/1-1. This work was partially supported by Semiconductor Research Corporation and Semiconductor Manufacturing Technology Consortium through the 3D Enablement Center.