







1. Introduction
A falling liquid thread readily destabilizes into drops, as commonly observed in liquid falling from a kitchen faucet. Plateau (Reference Plateau1873) attributed this instability to surface tension  $\sigma$ and found that drop formation was energetically more favourable than maintaining a uniform column of liquid. Rayleigh (Reference Rayleigh1878) later considered inertia in a dynamic stability analysis and accurately predicted the critical cylinder length for destabilization,
 $l>(3{\rm \pi} /2)^{1/3}r_{0} \approx 1.67 r_{0}$, where
 $r_{0}$ is the cylinder radius. When coating a cylindrical object, the Plateau–Rayleigh instability manifests as liquid beads (Quéré Reference Quéré1999) or plugs (Camassa, Ogrosky & Olander Reference Camassa, Ogrosky and Olander2014), depending on whether the coating is applied to the exterior or interior of the cylinder, respectively. In this paper, we introduce a technique for suppressing axial distortions in a falling liquid thread by mechanically deforming its cross-sectional shape using vertically hung parallel fibres, exploiting the fundamental differences in the stability of circular and non-circular threads.
The physics of capillary instability has been extensively studied, specifically the canonical formulation which considers the destabilization of a thread of viscosity  $\mu$, density
 $\rho$ and radius
 $r_{0}$. Starting from the depth-averaged slender jet equations (Eggers & Dupont Reference Eggers and Dupont1994), the most unstable wavenumber is
 $k_{max}= \sqrt {2}/(2r_{0})$ in the inviscid limit
 $Oh=\mu / \sqrt {\rho \gamma r_{0}}<<1$ but
 $k_{max} \rightarrow 0$ in the viscous limit
 $Oh>>1$ (Gallaire & Brun Reference Gallaire and Brun2017) where Oh is the Ohnesorge number. Inertia is critical in setting the most unstable mode – thereby selecting the observed wavelength – while viscosity damps the growth rate of all unstable modes. These physics are similar to the capillary instability of liquid flowing down a fibre (Kliakhandler, Davis & Bankoff Reference Kliakhandler, Davis and Bankoff2001), a well-studied variation of the classic Plateau–Rayleigh instability. Here, destabilization results in a bead-on-fibre structure rather than drop formation due to a no-penetration condition at the fluid–fibre interface. Frenkel (Reference Frenkel1992) derived a weakly nonlinear model for the thickness
 $h$ of thin film flow down a fibre and showed that surface tension has both a stabilizing and destabilizing role due to the axial and azimuthal curvature of the interface, respectively. However, the capillary pressure is primarily influenced by azimuthal curvature, driving the instability and underscoring the relevance of the long-wavelength approximation often used to model these flows (Kalliadasis & Chang Reference Kalliadasis and Chang1994; Chang & Demekhin Reference Chang and Demekhin1999; Craster & Matar Reference Craster and Matar2006; Ruyer-Quil et al. Reference Ruyer-Quil, Treveleyan, Giorgiutti-Dauphiné, Duprat and Kalliadasis2008).
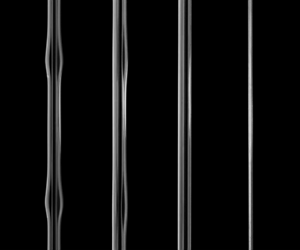
Unlike a drop formed from a free jet, a liquid bead on a fibre has a relative amplitude that depends on the fibre radius  $r$ and can become small for large
 $r$, as demonstrated in figure 1(a) for silicone oil coating fibres of increasing radius. Although this reduces axial fluctuations in the coating, the beads can become asymmetric if the fibre radius is further increased (Gabbard & Bostwick Reference Gabbard and Bostwick2021), the fluid is highly shear thinning (Gabbard & Bostwick Reference Gabbard and Bostwick2023a) or the nozzle–fibre alignment is eccentric and
 $Oh$ is large (Eghbali et al. Reference Eghbali, Keiser, Boujo and Gallaire2022), leading to axial and azimuthal fluctuations, as shown in figure 1(b). Since the film between beads naturally adopts a cylindrical shape, the instability manifests whenever the characteristic bead period
 $\tau _{bead} > \tau _{PR}$, where
 $\tau _{PR}=3 \mu r^{4} / \sigma h^{3}$ is the typical time scale for the Plateau–Rayleigh instability for thin film flow on a fibre (Gallaire & Brun Reference Gallaire and Brun2017). Figure 1(c) shows an example of multi-scale breakup where the thin film between primary beads destabilizes into secondary beads that can form ‘dry spots’ where only a microscopic liquid film persists. The liquid may also be externally perturbed to induce and remove beads from a smooth coating, e.g. using cross-flow (Cazaubiel & Carlson Reference Cazaubiel and Carlson2023). However, this destabilizes the surrounding film and leads to asymmetric coatings, as shown in figure 1(d). A liquid coating a fibre may be stabilized by van der Waals forces (Quéré, di Meglio & Brochard-Wyart Reference Quéré, di Meglio and Brochard-Wyart1989) or nonlinear saturation due to flow (Quéré Reference Quéré1990) when the coating is thin. Thicker films may remain smooth if the coating liquid is rheologically complex, such as micelle solutions (Boulogne et al. Reference Boulogne, Fardin, Lerouge, Pauchard and Giorgiutti-Dauphiné2013) and quick-curing polymer solutions (Evertz et al. Reference Evertz, Schrein, Olsen, Hoffmann and Overmeyer2021) but a general suppression mechanism for producing smooth falling threads remains elusive.
Bead-on-fibre instabilities. (a) Symmetric beading pattern with silicone oil that diminishes as the fibre radius  $r$ increases from left (
 $r=0.05$ mm) to right (
 $r=0.45$ mm). (b) Asymmetric beading patterns form for larger surface tension values, as shown for glycerol (
 $r=0.25$ mm). (c) Secondary instabilities can develop in the thin film connecting beads, known as the isolated regime (
 $r=0.05$ mm). (d) An applied cross-flow can change the pattern from symmetric to asymmetric, eventually causing bead detachment (
 $r=0.25$ mm).

Several studies have shown that, if the axisymmetric geometry driving capillary instability is compromised using external confinement, a stable thread can persist. As first observed by Migler (Reference Migler2001), when a polymer blend is confined between two plates, capillary instability can be suppressed if the size of the thread is similar to the plate separation. A systematic study by Son et al. (Reference Son, Martys, Hagedorn and Migler2003) found that the confinement in a single direction requires a liquid thread to destabilize in a non-axisymmetric manner, resulting in sections of non-circular cross-section that resist capillary instability, either decreasing the growth rate while increasing the wavelength or completely suppressing the instability when confinement is strong. Additional studies have provided more detailed insight using numerical methods (Newhouse & Pozrikidis Reference Newhouse and Pozrikidis1992; Janssen, Meijer & Anderson Reference Janssen, Meijer and Anderson2012). Shear has also been shown to suppress capillary instability (Russo & Steen Reference Russo and Steen1989; Frischknecht Reference Frischknecht1998). Recently, Wang et al. (Reference Wang, Zhou, Xu, Lu, Meng and Liu2020) introduced a coating technique inspired by mulberry silk that uses a dual-fibre structure to generate dip-coated films resistant to capillary instability. Their technique positions two parallel fibres in contact, altering the shape of the liquid film during dip coating into a non-circular cross-section, which effectively stabilizes it. The modified shape of the interface was estimated using the theory derived by Princen (Reference Princen1970) for finite volumes of liquids held statically between fibres. In this study, we expand these works to falling liquid threads and show that modifying a circular falling jet into a non-circular profile suppresses capillary instability. We adopt a similar dual-fibre system as Wang et al. (Reference Wang, Zhou, Xu, Lu, Meng and Liu2020) but generalize the geometry by allowing the fibre spacing to vary and adding a base flow which extends our results to applications where closely spaced fibres are useful, such as fog harvesting (Moncuquet et al. Reference Moncuquet, Mitranescu, Marchand, Ramananarivo and Duprat2022).
This paper begins with an overview of our experimental set-up, testing protocol and data acquisition techniques in § 2. In § 3, we examine how fibres embedded in a falling thread can deform it and provide a simple argument for thread stability based on pressure considerations. In § 4, we present our results. First, we examine the thread morphology as  $Q$ increases. Next, we map the stability threshold as it depends upon our experimental variables and present an empirical stability criterion. We then quantify the bead dynamics when the thread is unstable and derive a simple predictive scaling for the bead velocity
 $v$. Finally, we demonstrate the application of this technique to a thin geometry, specifically a ribbon, and compare the coating stability threshold of the ribbon with that of the dual-fibre geometry. We discuss our results in § 5. In § 6, we conclude by offering some remarks on relevant applications and highlighting promising directions for future research.
2. Experiment
We performed experiments using the set-up shown in figure 2(a), which consists of a custom nozzle and tensioning system. Two nylon monofilament fibres (Beadalon SuppleMax) of radius  $r$ were secured inside the nozzle housing and a micrometre head was used to manually adjust their separation distance
 $w$ (cf. figure 2(a) (inset), figure 2b). Here,
 $w=0$ corresponds to the fibres touching. A fibre tensioning system was located at the bottom of the set-up and featured a micrometre head to ensure the fibres relative position matched that at the top of the apparatus. The fibres were tensioned to ensure the fibres did not deform due to elastocapillary adhesion (Duprat & Protiere Reference Duprat and Protiere2015). Liquid was pumped onto the fibres through a circular nozzle of radius
 $r_{n}=1.7$ mm at a constant flow rate
 $Q$ using a NE-1000 syringe pump. The thread was recorded at a distance of 0.5 m below the nozzle using a Chronos 2.1-HD high-speed camera at 500 fps and spatial resolution around
 $10^{-2}$ mm per pixel. A mirror was placed at a 45-degree angle from the image plane to simultaneously capture the front and side views of the liquid thread. Here, the ‘front view’ describes the viewing plane passing through each fibre's axis while the ‘side view’ describes the orthogonal perspective, where the viewing plane cuts between the fibres and only a single fibre is observed, as shown in figure 2(b). Hereafter, we will distinguish the front and side views using superscript ‘f’ and ‘s’, respectively. The experimental apparatus and optics were mounted on a pneumatically levelled optical table to minimize external vibrations and preserve spatial calibrations.
(a) Experimental set-up with inset showing the internal design of the nozzle housing. (b) The falling thread shown in side and front views with thicknesses  $d_s$ and
 $d_f$, respectively. (c) Typical experiment showing a flat fluid thread (left) for a flow rate
 $Q=75$ ml hr
 $^{-1}$ and wavy thread (right) for
 $Q=300$ ml hr
 $^{-1}$. Here, the fluid viscosity is
 $\mu =350$ m Pa s, fibre radius
 $r=0.3$ mm and fibre gap
 $w=0.4$ mm. (d) Dimensionless thread thickness
 $\bar {d}=d/r$ against dimensionless time
 $\bar {t}=t/t_{f}$, where
 $t_f$ is the duration of the recording, for the two experiments shown in (c). The best-fit curve for each experiment is shown in black and the locations of the maximum
 $d_{max}$ and minimum
 $d_{min}$ thicknesses are denoted by the solid and hollow triangles, respectively.

Silicone oils (Esco Products, Inc.) were used as the working liquids because they fully wet the nylon fibres, allowing the liquid thread to be significantly deformed. The density  $\rho =969\,{\rm kg}\,\textrm {m}^{3}$ and surface tension
 $\sigma =21.1 \times 10^{-3}$ N m
 $^{-1}$ were measured using an Attension Sigma 702 force tensiometer with a density probe and Wilhelmy plate, respectively. The viscosity
 $\mu = 9.7 \times 10^{-3}\unicode{x2013}339 \times 10^{-3}$ Pa s was measured with an Anton Paar MCR 302 shear rheometer. We quantify the liquid profile by tracking the thickness
 $d$ in front and side view, and determining the maximum
 $d_{max}$ and minimum
 $d_{min}$ thicknesses, as shown in figure 2(b). Four fibres were tested with radii
 $r=0.15, 0.25, 0.35$ and 0.45 mm and spacings
 $w=0\unicode{x2013}1.2$ mm over a range of flow rates
 $Q=2\unicode{x2013}4000$ ml hr
 $^{-1}$.
Each experiment began by attaching, levelling and tensioning two nylon fibres onto the apparatus, bringing them into contact, and then separating them by a distance  $w$. A 10 mm calibration disk with a 0.025 mm surface tolerance was placed around the fibres and recorded as a calibration for image processing. Next, the fibres were cleaned with isopropyl alcohol and air dried. A fixed flow rate
 $Q$ was then applied until the liquid thread reached steady state, after which a video was recorded for 10–30 seconds to capture the thread dynamics. Note that all steady-state profiles explored herein fully wrap the parallel fibres, in contrast to those previously observed for thin sheets bridging two parallel fibres (Gabbard & Bostwick Reference Gabbard and Bostwick2023b).
Typical side view images of stable and unstable threads are shown in figure 2(c). A custom image processing code was used to quantify the thread profile. Figure 2(d) plots the scaled thread diameter  $\bar {d}=d/r$ against time
 $\bar {t}=t/t_{f}$ for the two examples shown in figure 2(c), where
 $t_{f}$ is the final time of the video. The data were fit using a Gaussian process regression model (solid black curve). Here, the maximum thickness
 $d_{max}$ and minimum thickness
 $d_{min}$ are identified by solid and open triangles, respectively. The same image processing code was used to quantify the thread thickness in the front view.
3. Deforming a falling liquid thread
To create a base flow with a non-circular cross-sectional shape, we deform the liquid thread internally using nylon fibres. A similar method has been used for dip coating (Wang et al. Reference Wang, Zhou, Xu, Lu, Meng and Liu2020) but here the addition of a base flow requires the fibres to pass through the nozzle to create a continuous falling thread instead of flowing bridges, which are observed if the flow is applied orthogonal to the fibre pair (Gabbard & Bostwick Reference Gabbard and Bostwick2024). The liquid exits the nozzle with an axisymmetric cross-section  $d^{f}=d^{s}=d_{n}$ but thins as it descends, as shown in figure 3(a).
(a) Front view (left) and side view (right) of liquid deposited on two parallel fibres with radius  $r=0.25$ mm and spacing
 $w=0.8$ mm at a flow rate
 $Q=100$ ml hr
 $^{-1}$. The dashed and solid lines denote the liquid–air interface of the front and side view, respectively. (b) Normalized thread diameter
 $d/d_n$ against distance from the nozzle
 $z/l_c$, where
 $d_n$ is the nozzle diameter and
 $l_c$ is the capillary length, as it depends on flow rate
 $Q$. Front view and side view measurements are distinguished using a dashed and solid line, respectively, with approximate cross-sectional shapes. (c) Thread eccentricity
 $\alpha =1-d^{s}/d^{f}$ against flow rate
 $Q$. (d) Normalized relative thread diameter
 $\hat {d}=(d_{ss}-d)/(d_{ss}-d_{n})$, with
 $d_{ss}$ the pre-instability steady-state thread diameter, against distance from the nozzle
 $z/l_{c}$ for the side and front views.

Figure 3(b) plots the normalized thread diameter  $d/d_{n}$, against distance from the nozzle
 $z/l_{c}$, as it depends upon flow rate
 $Q$ for the front (dashed line) and side (solid line) views, where
 $l_{c}=\sqrt {\sigma / \rho g}$ is the capillary length with g the gravitation acceleration. For each
 $Q$, the thread reaches a uniform thickness a short distance below the nozzle. When
 $Q<300$ ml hr
 $^{-1}$, the steady-state thickness is much smaller for the side view than the front view, i.e. the cross-section is non-circular. For
 $Q > 300$ ml hr
 $^{-1}$, the side view thickness matches the front view thickness creating a circular cross-section that increases with
 $Q$, ensuring an axisymmetric thread for all sufficiently large
 $Q$. The steady-state thickness is taken at
 $z/l_{c} = 8$ and the approximate cross-sectional shapes are overlaid on the plot with the same colour as the associated data sets. To quantify the non-circular geometry of the base flow we define the eccentricity
 $\alpha = 1-d^{s}/d^{f}$, where
 $\alpha =0$ corresponds to a circle and
 $\alpha =1$ to a line. Figure 3(c) plots
 $\alpha$ against flow rate
 $Q$ showing that
 $\alpha$ decreases as
 $Q$ increases but steadily declines with increasing
 $Q$ until a critical flow rate
 $Q_{c}$ is reached, beyond which the thread is circular and
 $\alpha$ remains below
 $\alpha =0.1$. These trends are observed for all experiments.
In our experiments we assume that any inertial–capillary ‘chain oscillations’ (Jordan et al. Reference Jordan, Ribe, Deblais and Bonn2022) associated with the quick circular to non-circular shape change when  $Q< Q_{c}$ are quickly attenuated. Figure 3(d) plots the normalized relative thread diameter
 $\hat {d}=(d_{ss}-d)/(d_{ss}-d_{n})$, with
 $d_{ss}$ the pre-instability steady-state thread diameter, against dimensionless distance
 $z/l_{c}$ for all of our data in side (blue) and front (orange) views. We have defined
 $\hat {d}$ such that any oscillations about
 $d_{ss}$ appear as oscillations about
 $\hat {d}=0$. Note that several profiles exhibit ‘overshoot’
 $\hat {d}<0$, particularly those in the side view. This is reasonable since the initial circular thread of diameter
 $d=d_{n}$ must travel further to reach
 $d_{ss}$ in the side view, especially when
 $Q$ is low and
 $w$ is high. In all cases, we confirm that the inertial–capillary oscillations attenuate quickly due to viscosity, well before thread destabilization is observed
 $z/l_{c} \geq 50$ and data are recorded
 $z/l_{c} \approx 330$.
3.1. Instability mechanism
The presence of a wavy thread is associated with capillary instability and we seek to describe the associated instability mechanism. We begin by neglecting viscous and inertial effects and write the difference in pressure between the inside  $P_i$ and outside
 $P_o$ of the thread using the Young–Laplace equation
 \begin{equation} \Delta P \equiv P_{i} - P_{o} = \sigma \left(\frac{1}{R_1} + \frac{1}{R_2} \right), \end{equation}
where  $R_1$ and
 $R_2$ are the principal radii of curvature. For long wavelengths, the azimuthal curvature
 $1/R$ dominates axial curvature such that
 $\Delta P \approx \sigma /R$. The curvature of the threads we test are all concave outward, thus
 $\Delta P > 0$ based on our sign convention.
Figure 4 illustrates a static thread subjected to a small perturbation  $\pm \epsilon$ for (a)
 $Q< Q_{c}$ and (b)
 $Q>Q_{c}$. When
 $Q< Q_{c}$, the thread is non-circular and the thickness parallel to the fibre plane is invariant to volume fluctuations, as shown earlier in figure 3(b). Here, the edge of the fibre maintains a thin film due to intermolecular forces, as previously observed (Wang et al. Reference Wang, Zhou, Xu, Lu, Meng and Liu2020). Thus, the perturbation acts perpendicular to the fibre plane, as shown in figure 4(a), where the orange curve denotes the radius of curvature for the crest (upper)
 $R_{c}$ and trough (lower)
 $R_{t}$ of the perturbation. Since
 $R_{t}>R_{c}$, the pressure is higher in the crest and a capillary flow replenishes the thin region, thereby stabilizing the thread. Alternatively, when
 $Q>Q_{c}$ the thread is circular and the response of the cross-sectional area to
 $\epsilon$ is shown in figure 4(b). Similar to the canonical Plateau–Rayleigh instability, the small perturbation results in
 $R_{c} > R_{t}$ and thus a capillary flow is driven from the high-pressure trough to the low-pressure crest, resulting in a wavy pattern. Unlike the Plateau–Rayleigh instability, where the capillary pressure causes breakup into drops, the presence of the fibres results in a non-circular profile stabilizing against breakup. This implies that any quasistatic thread is stable when
 $d^{s} < 2 r_{t}$, where
 $r_{t}=2r+w/2$. Thus,
 $r_{t}$ is a key length scale which we will use to explore the stability of flowing threads.
Illustration of instability mechanism showing a (a) non-circular cross-section  $Q< Q_c$ and (b) circular cross-section for
 $Q>Q_c$ with associated perturbed interfaces. For
 $Q< Q_{c}$ the long edge is fixed by the edges of the fibres, such that perturbations only affect the radius of curvature
 $R$ along the short edge giving rise to a stabilizing capillary flow from the crest to the trough. For
 $Q>Q_{c}$ the circular thread is always unstable due to an increased pressure (decreased curvature) at the trough, thus driving the instability.

3.2. Defining the parameter space
Having determined the stability threshold for a quasistatic thread, we now define the relevant parameters for our system with  $r_t$ being the natural length scale and
 $v_{t}=Q/r_{t}^{2}$ the characteristic velocity, which ranged from
 $10^{-3}$ to
 $10^{0}$ m s
 $^{-1}$. For a general base flow governed by inertia, gravity and viscosity, one can define the Froude number
 $Fr \equiv v_{t}/ (g r_{t} )^{1/2} \sim 10^{-5} - 10^{-2}$, which indicates the base flow in our experiments is gravity driven. A visco-gravitational number
 \begin{equation} \beta \equiv \rho g r_{t}^{2} / \mu v_{t}, \end{equation}
can be defined to characterize the base flow and ranges from  $10^{-2}$ to
 $10^{1}$. Lastly, we define the Bond number
 $Bo \equiv \rho g r_{t}^{2} / \sigma \sim 10^{-1} - 10^{0}$, indicating that both hydrostatic and capillary pressures are important, a typical feature for gravity-driven capillary phenomena like bead-on-fibre flow. Having set the characteristic length and velocity, we recast our results in dimensionless terms by using
 $r_t$ and
 $v_t$ as the characteristic length and velocity scales, respectively.
4. Results
We have demonstrated an effective method for distorting falling liquid threads and speculated on the stability using a simple argument based on Laplace pressure. However, we have not said anything about the temporal evolution of the thread and its spatial structure. In this section, we quantify the thread morphology, stability threshold and bead dynamics.
4.1. Thread morphology
Figure 5(a) shows side view images of a falling thread for increasing flow rate  $Q$ from
 $Q=2$ to
 $Q=150$ ml hr
 $^{-1}$. Here, we observe a clear transition from a uniform (stable) thread to a wavy (unstable) thread with the dynamics shown in the Supplemental Material, Movie 1 available at https://doi.org/10.1017/jfm.2024.1091. Figure 5(b–d) quantifies the shape of the thread by plotting (b) the average maximum thread diameter
 $d_{max}$, (c) the average minimum thread diameter
 $d_{min}$ and (d) the dimensionless amplitude of the undulations
 $\tilde {a}=a/r_{t}$, where
 $a=d_{max}-d_{min}$, against
 $Q$. For low
 $Q$,
 $d_{max}$ and
 $d_{min}$ increase linearly with
 $Q$ in the side view, but remain constant in the front view. This represents a non-circular cross-section which becomes more circular as
 $Q$ increases. Above a critical flow rate
 $Q_c$,
 $d_{max}$ and
 $d_{min}$ increase at similar rates irrespective of perspective and have similar
 $d_{max}$, indicating a circular cross-section. Interestingly,
 $d_{min}$ is always larger in the front view. This mismatch corresponds to a non-circular region connecting the circular beads, which is opposite to that observed with capillary instability in external confinement (Son et al. Reference Son, Martys, Hagedorn and Migler2003). For both a free-falling jet and flow down a fibre this region has a circular cross-section, leading to drop pinchoff and a secondary bead-on-fibre pattern, respectively. This between-beads stability agrees with our simple stability argument described in § 3.1, such that when
 $Q>Q_{c}$ a cylindrical base state will (i) thicken in regions that terminate as a bead with circular cross-section, as observed, and (ii) thin between beads until the thread regains stability at
 $d_{min} \approx 2r_{t}$. However, what is not predicted is that the thread thins beyond the minimum circular profile that result in non-circular neck regions. Lastly, we note that, below
 $Q_c$, the amplitude of interfacial undulations
 $\tilde {a}$ is negligible but sharply increases as
 $Q_{c}$ is surpassed, as shown in figure 5(d). Just above
 $Q_{c}$,
 $\tilde {a}$ is greater in the side view than the front view since the fibres prevent large fluctuations parallel with the fibre plane. As
 $Q$ further increases, the average thread thickness increases, allowing larger fluctuations perpendicular to the fibre plane until
 $\tilde {a}$ is independent of perspective.
(a) Thread destabilization as the flow rate  $Q$ increases from left to right showing stable and unstable threads. Here,
 $r=0.25$,
 $w=0.2$ mm and
 $\mu =339$ m Pa s. Scale bar is 3 mm long. (b) Maximum thread diameter
 $d_{max}$, (c) minimum thread diameter
 $d_{min}$ and (d) dimensionless amplitude
 $\tilde {a}=a/r_{t}$ against
 $Q$ as measured in front (grey circle) and side view (blue star). The vertical black line denotes the stability threshold
 $Q=Q_{c}$. Inset illustrations show the approximate cross-sectional shape for
 $Q< Q_{c}$ (purple) and
 $Q>Q_{c}$ (orange).

4.2. Stability threshold
Next, we explore how the critical flow rate  $Q_c$ depends on the characteristic length
 $r_t$ and viscosity
 $\mu$. Figure 6(a) plots
 $Q_{c}$ against
 $r_t$, as it depends upon fibre radius
 $r$. As
 $r_{t}$ increases,
 $Q_{c}$ increases since more volume is required to form a circular thread large enough to encompass both fibres. The data collapse along a single trend, confirming that
 $r_{t}$, not the fibre radius
 $r$ or spacing
 $w$, is the appropriate length scale. Furthermore, the data follow a
 $Q_{c} \sim r_{t}^{4}$ scaling, as shown by the dashed line. Figure 6(b) plots
 $Q_{c}$ against
 $r_{t}$, as it depends upon
 $\mu$. The data no longer collapse upon a single trend as increasing
 $\mu$ for a given
 $Q$ thickens the thread. A positive trend between
 $Q_c$ and
 $r_t$ is observed for all
 $\mu$ while for a fixed
 $r_t$, increasing
 $\mu$ leads to a decrease in
 $Q_{c}$. This was also observed for parallel fibres being dip coated, where the capillary number
 $Ca$ controls the coating thickness and thus increasing
 $\mu$ (equivalently,
 $Ca$) leads to capillary instability at lower withdrawal velocity (Wang et al. Reference Wang, Zhou, Xu, Lu, Meng and Liu2020).
(a) Critical flow rate  $Q_c$ against the characteristic length
 $r_{t}$, as it depends upon fibre radius
 $r$ for viscosity
 $\mu =47$ m Pa s. The data fall along the curve
 $Q_{c} \sim r_{t}^{4}$. (b) Value of
 $Q_c$ against
 $r_{t}$ as it depends upon
 $\mu$ for
 $r=0.25$ mm.

The stability of a quasi-static thread depends solely on the cross-sectional geometry. Here, we assume the system geometry also defines the stability boundary through the side view diameter  $d^{s}$. Figure 7(a) plots the dimensionless maximum thread diameter
 $\tilde {d}=d_{max}^{s} /r_{t}$ against visco-gravitational number
 $\beta$, with coloured markers differentiating stable (purple) and unstable (orange) threads for all of our experimental data. A stability threshold emerges, primarily as a function of
 $\tilde {d}$ but noticeably larger than that for quasi-static coatings
 $\widetilde {d_{c}} = 2$. Here, the threshold
 $\tilde {d}=2.68 \pm 0.21$ is shown by the dashed line and the overlap region in the data is shaded grey. Thus, thread stability is due to the growth of the thread beyond a critical thickness, which is larger than that predicted for a quasi-static coating. This finding is consistent with the measured film thickness along the edges of the fibres from the front view, which is assumed negligibly thin for quasi-static coatings, but is of the order 0.1 mm in our experiments. Figure 7(b) shows threads for
 $\beta \approx 10^{-1}$ (left),
 $\beta \approx 10^{0}$ (middle) and
 $\beta \approx 10^{1}$ (right). Apparent in the data and demonstrated by these images is the transition in stability as
 $\beta$ changes and the transition region
 $\beta \approx 1$ where threads may exhibit a flat or wavy thread.
(a) Stability diagram showing stable (purple) and unstable (orange) threads by plotting dimensionless maximum diameter  $\tilde {d}=d_{max}^{s} /r_{t}$ against visco-gravitational number
 $\beta = \rho g r_{t}^{4} /\mu Q$. The dashed line denotes the stability threshold
 $\widetilde {d_{c}} = 2.68 \pm 0.21$ with the shaded region showing the empirical overlap. Plot markers indicate the viscosity of each test. (b) Side view images for different
 $\beta$ with
 $\tilde {d}=4.8$, 2.5, 2.1 and 2, from left to right.

4.3. Bead dynamics
Once the thread diameter surpasses the stability threshold  $\tilde {d}=2.68 \pm 0.21$, the film destabilizes into a series of beads flowing down a stable film, which ensures no dry spots develop. The bead dynamics exhibits a temporal and spatial dependence. Figure 8(a) shows a spatio-temporal diagram constructed by tracking a column of pixels intersecting the widest sections (beads) of the film, thereby showing the spatio-temporal evolution of the flow. The reader may find the movie corresponding to this spatio-temporal diagram in the Supplemental Material, Movie 2. The white lines indicate bead locations and their slope gives the bead velocity. The lines are not parallel because interactions between the beads have rearranged their structure. If we track the thread diameter at a fixed vertical position we can construct the thread profile. Then, applying a fast Fourier transform (FFT) reveals the frequency spectrum, which shows a maximum frequency
 $f^{*}=9.4$ Hz that varies slightly with time and location along the fibre. Interactions between the beads result in a signal with finite bandwidth, an observation previously made for convectively unstable flow down a fibre (Duprat et al. Reference Duprat, Ruyer-Quil, Kalliadasis and Giorgiutti-Dauphiné2007). This behaviour is expected for high
 $Q$, where the flow advection time decreases relative to the linear growth time of the capillary instability. In our experiments, this is typical, as beads only emerge for high flow rates
 $Q \geq Q_{c}$ and result in global behaviour similar to that shown in figure 8(a).
(a) Typical spatio-temporal diagram with beads shown in white for  $r=0.25$ mm and
 $w=1$ mm. The thread profile is tracked at a fixed vertical location (horizontal orange line) and the power density (PD) is determined using an FFT. (b) Bead velocity
 $v$ against flow rate
 $Q$, as it depends upon viscosity
 $\mu$. (c) Dimensionless bead velocity
 $\tilde {v}=v / v_{t}$, where
 $v_{t}=Q / r_{t}^{2}$, against visco-gravitational number
 $\beta = \rho g r_{t}^{4} /\mu Q$ exhibits a power-law trend with exponent
 $n=2/5$ and coefficient of determination
 $R^{2}=0.96$. The colour bars in (b,c) indicate the characteristic length
 $r_t$.

Due to convective interactions, the bead velocity  $v$ varies but remains bounded within an associated error for each experiment. Figure 8(b) plots
 $v$ against flow rate
 $Q$ for three different viscosities
 $\mu$ and
 $r=0.25$ mm. The marker colours reflect the characteristic length
 $r_t$ for each experiment. For all
 $\mu$,
 $v$ increases with
 $Q$. As expected, decreasing
 $\mu$ increases
 $v$. Despite the base flow being convectively unstable,
 $v$ follows a clear trend and motivates us to explore a simple scaling argument to describe the bead dynamics.
Neglecting capillary effects, we can balance the gravitational energy rate
 \begin{equation} \varPhi_{g}\approx \rho g V v, \end{equation}
with the viscous dissipation
 \begin{equation} \varPhi_{\mu}\approx 2 \zeta \mu \left(\frac{\partial v}{\partial r}\right)^{2} V, \end{equation}
where  $\zeta$ is a dissipation coefficient. The energy rate balance is then
 \begin{equation} \rho g V v = \zeta \frac{2 \mu V v^{2}}{r_{t}^{2}}, \end{equation}
which we can rearrange and non-dimensionalize to find
 \begin{equation} \frac{v}{v_{t}} \sim \frac{1}{\zeta} \frac{\rho g r_{t}^{4}}{2 \mu}. \end{equation}
Here, the left-hand side is our dimensionless velocity  $\tilde {v}=v/v_{t}=v r_{t}^{2} /Q$ and the right-hand side contains the visco-gravitational number
 $\beta$.
Figure 8(c) plots  $\tilde {v}$ against
 $\beta$ for all our experiments. The shape and colour of the data markers indicate
 $\mu$ and
 $r_t$, respectively. The data follow a power-law trend
 $\tilde {v} \sim \beta ^{0.4}$ with coefficient of determination
 $R^{2}=0.97$, indicating a significant trend between
 $v$ and the visco-gravitational number
 $\beta$. This scaling law is a robust predictor of
 $v$ when the flow is visco-gravitational but may become invalid at higher
 $Q$, when the flow is visco-inertial. This transition has been explored for flow down a fibre (Ruyer-Quil & Kalliadasis Reference Ruyer-Quil and Kalliadasis2012) but remains unexplored for liquid coating multiple fibres.
4.4. The slender geometry limit  $\varLambda << 1$: coating a ribbon

This method for suppressing capillary instability can be extended to other slender geometries. For example, we coated a vertically oriented nylon ribbon with a rectangular cross-section of thickness  $a \approx 0.01$ mm and width
 $b \approx 3$ mm. This geometry presented two distinct changes from the dual-fibre system. First, the aspect ratio associated with its cross-section
 $\varLambda = a/b \approx 0.03$ is much lower than any tested for the dual-fibre system
 $\varLambda = r / r_{t} \geq 0.17$, a feature which renders the ribbon thickness negligible and creates a singularity in the capillary pressure, as we will see. Second, the ribbon can block liquid from passing from one side to the other, unlike the dual-fibre system where liquid may pass between the fibres. Figure 9(b) shows the coated ribbon with flow rate
 $Q$ increasing from left to right. For low
 $Q$, the ribbon is coated with a stable thin film of uniform thickness. Similar to the dual-fibre system, increasing
 $Q$ beyond a critical value results in capillary instability, as shown by the images under the orange bar. Thus, suppression of capillary instability for coatings on non-axisymmetric geometries is a general feature that can be expected for most wettable slender structures.
(a) Silicone oil ( $\mu =47$ m Pa s) flowing down a nylon ribbon of thickness
 $a=0.01$ mm and width
 $b=3$ mm exhibits instability as the flow rate increases from left to right. Scale bar is 3 mm long. (b) Maximum (grey circles) and minimum (blue star) thread diameter
 $d^{s}$ measured perpendicular to the ribbon width and (
 $c$) dimensionless wave amplitude
 $\tilde {a}=a/r_{t}$, with
 $r_{t}=b/2=1.5$ mm, against flow rate
 $Q$. For low
 $Q$, the maximum and minimum thread diameters are similar and
 $\tilde {a}$ is small. For high
 $Q$, the film is unstable causing the maximum and minimum thread diameter to diverge and
 $\tilde {a}$ to increase.

We quantify the ribbon coatings shown in figure 9(b) using the thread thickness as measured from the side view  $d^{s}$. Figure 9(c) plots
 $d^{s}$ against
 $Q$ with maximum and minimum thickness denoted by grey circles and blue stars, respectively. The result mirrors those shown in figure 5, where below a critical flow rate
 $Q_c$ the thread has little thickness variations, but above
 $Q_c$ beads emerge, as indicated by the large difference in the maximum and minimum thicknesses. Figure 5(d) plots the bead amplitude
 $a=a/ r_{t}$, where
 $a=d_{max}^{s} - d_{min}^{s}$ and
 $r_{t} = b/2 = 1.5$ mm, against
 $Q$ and shows that above a critical flow rate
 $Q_{c} \approx 750 \ m$l/hr,
 $a$ increases from below 0.1 to as high as 0.7. These results are qualitatively similar to those for parallel fibres, but a quantitative inspection reveals a distinct difference. In figure 9(c) the thread begins to lose stability when
 $d^{s} \approx 2$ mm, which is less than the width of the ribbon
 $b=3$ mm. Thus, the dimensionless maximum diameter is
 $\widetilde {d_{c}} \approx 1.3$, much lower than
 $\widetilde {d_{c}} \approx 2.68$ for parallel fibres. Additionally, this value seems to contradict the instability analysis, which indicated a stable thread for
 $\tilde {d} < 2$. This result may be explained by the two distinctions between the ribbon geometry and parallel fibres mentioned in the previous paragraph. Since the capillary pressure is proportional to the interfacial curvature, the pressure diverges for negligibly small thicknesses – like those common in ribbons – and a singularity in the capillary pressure is approached, resulting in spontaneous dewetting at the ribbon edge despite the coatings smooth initial profile. This has been observed for oval fibres (Alimov & Kornev Reference Alimov and Kornev2014) with Zhang & Kornev (Reference Zhang and Kornev2017) demonstrating rapid dewetting and contact line formation around the edges of dip-coated ribbons, where the resulting pinned contact line effectively isolates the fluid on each side of the ribbon. These features explain the reduced transition threshold and the asymmetric beads observed in figure 9(b). Thus, capillary suppression is observed for many slender structures beyond the parallel-fibre system but additional physics associated with contact line formation and dewetting can lower the stability threshold and result in asymmetric bead patterns. These features remain an open area for exploration.
5. Discussion
This study explored an effective means for suppressing capillary instability that differed from previous studies by using internal distortion instead of external confinement. When a thread is unconstrained, perturbations grow despite the increased interfacial free energy associated with additional axial contour length because the average radius of the thread must decrease to conserve volume. Hence, sinusoidal perturbations in a two-dimensional section always decay (San Miguel, Grant & Gunton Reference San Miguel, Grant and Gunton1985). In three dimensions, an asymmetric external confinement causes perturbations to grow asymmetrically, and the increase in free energy from contour lengthening outweighs the energy decrease from a decreasing thread size, thereby suppressing the instability or altering its wavelength and shape (Son et al. Reference Son, Martys, Hagedorn and Migler2003). If the confinement is imposed with azimuthal symmetry, such as a cylindrical thread in a similar-sized tube, the thread remains unstable but with altered dynamics (Hagedorn, Martys & Douglas Reference Hagedorn, Martys and Douglas2004). The internal distortion method presented here forces the initial profile to be non-circular which ensures perturbations decay below the stability threshold. Once  $Q > Q_{c}$, the initial profile is circular, akin to the starting profile for external confinement but the final profile is different. For example, for moderate external confinement, where perturbations grow to form an undulated thread, the neck regions are far from the confinement and thus have a circular cross-section where the bulging regions approach the bounding plates and become elongated in the orthogonal direction. For internal confinement using parallel fibres, the opposite is observed, the beads take on a circular shape since they do not feel the fibres but the neck region has an oval shape which results from the hydrodynamic interactions between the film and fibres and stabilizes it.
The physical reasoning underlying our results is mostly based on geometric considerations but some of the finer physical details require further study, such as the thickness of the film coating the outermost edges of the fibres, which is approximately  $10^{-1}$ mm but plays a seemingly negligible role in defining the stability threshold. Furthermore, the stability of the film in this region is compromised when the object to be coated is too slender, as demonstrated in figure 9 for a ribbon. How the aspect ratio
 $\varLambda =a/b$ alters the stability threshold and bead dynamics remains an open topic. Additionally, the shape of beads formed when a well-wetting liquid flows down a dual-fibre system requires further analysis. Specifically, we notice that beads often emerge with slight asymmetry, as shown in figure 5. We have found that a base flow delays the onset of Plateau–Rayleigh instability to larger film thicknesses compared with a static coating (Wang et al. Reference Wang, Zhou, Xu, Lu, Meng and Liu2020), which reflects previous findings for thin coatings on vertical fibres where flow can prevent bead growth (Quéré Reference Quéré1990) and requires further inspection. Lastly, the extension from parallel fibres to a ribbon was an illustrative example of a system with low aspect ratio and an impermeable interior but a more natural extension would be arrays of more than two fibres arranged in a radial pattern. Multi-fibre arrays were considered in prior theoretical studies (Princen Reference Princen1970) and could provide finer control of capillary instability, especially for large threads. We expect a similar geometric stability criteria as that explored here to govern the flow evolution.
6. Conclusion
In this study we demonstrated a method for suppressing capillary instability whereby two vertical fibres encased in a liquid thread internally distort the thread's cross-sectional shape. Image analysis revealed a shape transition from a circular to a non-circular profile when the flow rate  $Q$ was below a critical value
 $Q_c$. The thread morphology was evaluated down the fibre and a transition in the base state from non-circular to circular shape correlated with the appearance of beads flowing down the fibres. The role of the experimental variables on thread stability was explored over a large range of values. The stability threshold was found to be mostly geometrical, where stable threads are readily observed when
 $\tilde {d} < \widetilde {d_{c}}=2.68 \pm 0.21$. When
 $\tilde {d} > \widetilde {d_{c}}$, capillary flow inside the thread forms flowing beads, akin to the bead-on-fibre patterns observed in flow down a fibre. Since high
 $Q$ are required to produce unstable threads (
 $\tilde {d} > \widetilde {d_{c}}$), the base flow is typically convectively unstable, resulting in convective interaction between beads. Despite this, the average bead velocity
 $v$ showed a power-law correlation with the visco-gravitational number
 $\beta = \rho g r_{t}^{4} /\mu Q$, as predicted by our simple scaling analysis. Lastly, we extended this method of capillary suppression to other slender geometries. The suppression technique is effective but the non-permeable structure and the ultra-thin ribbon thickness caused contact line formation that isolates the liquid on each side of the ribbons long edge and leads to an earlier onset of bead formation, which have an asymmetric profile.
This suppression method has application in many settings due to the ubiquity of liquid threads and their intrinsic destabilization into drops or beads. In fibre coating applications, two neighbouring fibres coated simultaneously can avoid both bead formation and dewetting and we expect a similar uniform coating could exist when coating fibre bundles below a critical flow rate. This has already been shown theoretically for capillary rise and finite volumes of liquid within multi-fibre systems by Princen (Reference Princen1970) and Lukáš et al. (Reference Lukáš, Chaloupek, Košt’áková, Pan and Martinkova2006) but has yet to be empirically shown for a system where the liquid encases the fibres. Determining the stability threshold for liquid coating multiple fibres is thus a fruitful topic for exploration since many bioinspired wetting and droplet transport techniques leverage fibre bundles (Meng et al. Reference Meng, Wang, Liu and Jiang2014; Wang et al. Reference Wang, Bian, Meng, Liu and Jiang2017) and liquid–textile interactions require considering liquid interaction with multiple fibres (Minor et al. Reference Minor, Schwartz, Wulkow and Buckles1959; Duprat Reference Duprat2022). These results also provide an efficient means for manufacturing parallel electrical wire encased in a curable sheath either by a continuous base flow, as shown here, or by dip coating (Wang et al. Reference Wang, Zhou, Xu, Lu, Meng and Liu2020).
In many scenarios the breakup of a column into drops or beads is undesirable, which gives a direct need for suppression of capillary instability. However, in some applications the beads are useful, as evidenced by the recent push to use bead-on-fibre flows for heat and mass transfer applications, such as desalination (Sadeghpour et al. Reference Sadeghpour, Zeng, Ji, Dehdari Ebrahimi, Bertozzi and Ju2019), particle capturing (Sadeghpour et al. Reference Sadeghpour, Oroumiyeh, Zhu, Ko, Ji, Bertozzi and Ju2021), moisture capturing (Labbé & Duprat Reference Labbé and Duprat2019; Nguyen et al. Reference Nguyen, Bai, Zhu, Gao, Liu, Wagaye, Li, Zhang and Guo2021; Moncuquet et al. Reference Moncuquet, Mitranescu, Marchand, Ramananarivo and Duprat2022), heat exchange (Zeng et al. Reference Zeng, Sadeghpour, Warrier and Ju2017; Wagstaff et al. Reference Wagstaff, Gubba, Truscott, Algashgari and Roberts2023) and gas absorption (Chinju, Uchiyama & Mori Reference Chinju, Uchiyama and Mori2000; Uchiyama et al. Reference Uchiyama, Migita, Ohmura and Mori2003; Grünig et al. Reference Grünig, Lyagin, Horn, Skale and Kraume2012; Hosseini et al. Reference Hosseini, Alizadeh, Fatehifar and Alizadehdakhel2014). In these applications, flow down parallel fibres can safeguard against undesired ‘dry spots’ that occur in flow down a fibre due to secondary Plateau–Rayleigh instability (see figure 1c). The stability of the non-circular neck regions between beads, coupled with our simple scaling for the bead velocity, make flow down fibre pairs an effective means for applications requiring predictable thread stability and bead dynamics. Additionally, flow between fibres has been observed in water harvesting with fibre arrays (Shi et al. Reference Shi, Anderson, Tulkoff, Kennedy and Boreyko2018; Moncuquet et al. Reference Moncuquet, Mitranescu, Marchand, Ramananarivo and Duprat2022) and Labbé & Duprat (Reference Labbé and Duprat2019) explored the efficiency of a dual-fibre system for capturing aerosol droplets. Our results assist in advancing the current state of water harvesting using fibre arrays by providing critical insight into when a film between a fibre pair will destabilize into beads, which descend and drip from the mesh, purging the system and restoring stability.
This study marks another fundamental step in suppressing capillary instability by considering a base flow down parallel fibres with adjustable spacing, allowing for larger threads to be stabilized. Despite this advancement, many practical and physically intriguing questions remain, such as the role of the aspect ratio  $\varLambda$ on thread stability, the behaviour of non-wetting liquids and how the fibre material alters the flow morphology. Lastly, we note that, while this study focused on viscous flow, many applications use water or low-viscosity liquids with non-negligible inertial forces where Kapitza instability may be the favourable destabilization mechanism (Kapitza Reference Kapitza1948). Although external confinement has been shown to suppress this instability mechanism (Lavalle et al. Reference Lavalle, Li, Mergui, Grenier and Dietze2019) and low-viscosity liquid sheets between fibres can avoid breakup (Gabbard & Bostwick Reference Gabbard and Bostwick2023b), more research is needed focused on flow down parallel fibres to provide a compressive understanding across all practical flow conditions.
Supplementary movies
Supplementary movies are available at https://doi.org/10.1017/jfm.2024.1091.
Funding
J.B.B. acknowledges support from NSF Grant CMMI-1935590. This project is partially supported by the Clemson University Creative Inquiry program.
Declaration of interests
The authors report no conflict of interest.


 Open access

