Implications
Dairy cow production systems (DCPS) generate food for the human population and are significant contributors of the global economy, but they generate environmental impacts such as overexploitation of different resources including water, lands and fossil energy. Therefore, mitigation policies and strategies to reduce their ecological footprint are required. We quantified the carbon and water footprint (WFP) and compared these to the milk production economic value (EV) generated by an intensive DCPS under arid conditions. Our study demonstrates that the economic cost (EC) of the environmental impact is significantly higher than the EV generated by dairy production in the Comarca Lagunera, Mexico.
Introduction
Livestock production systems occupy 45% of the global surface area with an estimated EV of € 1.2 trillion being a significant source of livelihoods; more than 1300 million people economically depend on the animal production industry (Herrero et al., Reference Herrero, Thornton, Gerber and Reid2009; Scientific Committee on Problems of the Environment, 2010; Thornton, Reference Thornton2010). Although the economic and social importance of animal production has been extensively documented (Capper et al., Reference Capper, Cady and Bauman2009; Herrero et al., Reference Herrero, Thornton, Gerber and Reid2009; Thornton, Reference Thornton2010), there are significant environmental concerns about livestock production, especially when considering both direct and indirect greenhouse gas emissions (GHGE) (Gill et al., Reference Gill, Smith and Wilkinson2010; Thornton, Reference Thornton2010; Meza-Herrera et al., Reference Meza-Herrera, Ramirez-Flores, Lopez-Villalobos, Garcia-Martinez, Veliz and Lopez-Santiago2015 and Reference Meza-Herrera, Ramirez-Flores, Lopez-Villalobos, Silanikove, Garcia-Martinez and Veliz2016). While the direct GHGE considers both methane (CH4) and nitrous oxide (N2O) (Jungbluth et al., Reference Jungbluth, Hartung and Brose2001), the indirect GHGE include those emissions generated by animal manure, production of grains and forages for animal consumption, use of fertilizers, deforestation and desertification linked to animal production as well as transport of different inputs and outputs (Mosier et al., Reference Mosier, Kroeze, Nevison, Oenema, Seitzinger and Van Cleemput1998). At a global level, the livestock sector generates 18% of the total GHGE (Steinfeld et al., Reference Steinfeld, Gerber, Wassenar, Castel, Rosales and De Haan2006); when considering only the agro-livestock sector, the single livestock subsector comprises 80% of the total GHGE (Herrero et al., Reference Herrero, Thornton, Gerber and Reid2009; Cardoso, Reference Cardoso2012). In addition, dairy cattle is one of the main GHGE producer, only exceeded by those generated by the beef cattle industry (Gerber et al., Reference Gerber, Steinfeld, Henderson, Mottet, Opio, Dijkman, Falcucci and Tempio2013). Cattle are the main contributors to global manure production (69%), while swine and poultry production account for 9% and 10%, respectively (Herrero et al., Reference Herrero, Thornton, Gerber and Reid2009).
In the Americas, one of the main bovine milk producing clusters is located in Mexico, specifically in the Comarca Lagunera. The Servicio de Información Agroalimentaria y Pesquera – Agrifood and Fishery Information System (SIAP, 2017) reported a daily milk production of 6.53 million of liters from 227 142 milking cows in this arid-northern region of Mexico. The DCPS in the Comarca Lagunera is characterized by a highly technified, modern and intensive production scheme perfectly linked to a milk-industrialization structure, with national and international branching. This DCPS is based on an extremely intensive groundwater extraction pattern. This has been done so that the main groundwater reserve in the Comarca Lagunera faces a highly significant annual deficit close to 125 million m3 (Montemayor-Trejo et al., Reference Montemayor-Trejo, Lara-Míreles, Woo-Reza, Munguía-López, Rivera-González and Trucios-Caciano2012). High environmental temperatures (>40°C in summer) and low annual rainfall (<300 mm) characteristic to this region have promoted this asymmetrical groundwater extraction, generating an environmental risk that may potentially affect not only the DCPS itself but also the societal, biological and economic sustainability of the Comarca Lagunera (Meza-Herrera et al., Reference Meza-Herrera, Ramirez-Flores, Lopez-Villalobos, Garcia-Martinez, Veliz and Lopez-Santiago2015; Acevedo-Peralta et al., Reference Acevedo-Peralta, Leos-Rodríguez, Figueroa-Viramontes and Romo-Lozano2017).
In order to propose potential mitigation strategies against the risks associated with DCPS, it is essential to attain environmental indicators such as the level of both the GHGE and the WFP generated by the DCPS (Chapagain and Hoekstra, Reference Chapagain and Hoekstra2004; Herva et al., Reference Herva, Franco, Carrasco and Roca2011). The GHGE are usually quantified as amount of CO2-equivalent (CO2-eq) associated with the production, processing and sale of food. The WFP is quantified based on consumptive use of rainwater (green WFP) and ground and surface water (blue water footprint (BWF)) and volumes of water polluted (gray WFP) (Hoekstra and Mekonnen, Reference Hoekstra and Mekonnen2012). A global assessment of the WFP of farm animal products stated that from the WFP generated by the agricultural and livestock sector, the beef cattle category has the highest impact (33%), followed by dairy cattle (19%), swine (19%) and poultry (11%) industries (Mekonnen and Hoekstra, Reference Mekonnen and Hoekstra2012).
The objective of this study was to compare the direct economic benefit from the sale of milk with the economic environmental costs generated by the DCPS, regarding both GHGE and WFP, in the Comarca Lagunera, Mexico.
Material and methods
Location of the study area and databases
The Comarca Lagunera in located in northern Mexico at 102°22’ and 104°47’ West longitude and 24° 22’ and 26° 23’ North latitude, 1139 m altitude. It has an average temperature of 22°C with temperatures ranging lows of 0°C (winter) and highs of 40°C (summer), with an average rainfall of 300 mm (historical range from 88 mm in 1998 to 406 mm in 1997). The region includes 10 municipalities of the State of Durango and five from the State of Coahuila. In order to develop this study, the information published in the Statistical Yearbooks for Agricultural Production by the Ministry of Agriculture, Livestock, Rural Development, Fisheries and Food (SAGARPA), were considered. Alongside this, the estimated use of commercial fertilizers for forage production was generated according the procedures outlined by Figueroa-Viramontes et al. (Reference Figueroa-Viramontes, Delgado, Cueto-Wong, Núñez-Hernández, Reta-Sánchez and Barbarick2011). In order to conduct these studies, both existing and generated databases were used, therefore, no Animal Care and Use Committee approval was required.
Methods to estimate the economic value of milk production
The annual EV of the DCPS from the Comarca Lagunera was calculated as the total volume of milk produced per year multiplied by the average payment per liter of milk received by the producers. The milk payment was €0.13 in 1997 and increased to €0.29 in 2016.
Methods to estimate the greenhouse gas emissions
To estimate the GHGE, the factors and indexes proposed by the Intergovernmental Panel on Climate Change (IPCC, 2007) were utilized. Livestock inventory, production level, type of diets, consumption and digestibility, were also included. The IPCC conversion rates of such emissions to global potential warming CO2-eq were also incorporated. These equivalences correspond to: 1 CH4=25 CO2 units and 1 N2O=296 CO2 units. The EC of the GHGE considered an international price of carbon emissions of 15.75€/t of CO2-eq (Environmental Finance, 2011; Thompson Reuters, 2011).
According to the IPCC (2007), the GHGE (CH4 and N2O) in the agricultural sector, three subcategories should be considered: livestock, savannas and agriculture. In our particular case, to perform such quantifications, we only included the livestock and agriculture categorizations since the bovine milk production in the Comarca Lagunera is based on an intensive production system.
Livestock subcategory
In order to quantify the CH4 emissions due to enteric fermentation, to manure production as well as N2O emissions due to manure management, we used the equations proposed by Hongmin et al. (Reference Hongmin, Mangino, Mcallister, Hatfield, Johnson, Lassey, Aparecida de Lima and Romanosvskaya2006).
CH4 emissions due to enteric fermentation
The volume of CH4 emissions due to enteric fermentation depends on the physiological stage, weight and age of animals. As previously mentioned, we only considered the dairy cattle inventory to characterize the bovine population:
 $${\rm Em}_{{{\rm EFECH}4}} {\rm }{\equals}{{{\rm LPOP }{\times}{\rm EF}} \over {10^{6} {\rm kg\,/\,Gg}^{{}} }}$$
where EmEFECH4 is the methane emissions from enteric fermentation, Gg CH4/year; LPOP the number of animals or heads; EF the emission factor for the specific population, kg/head per year.
In this estimation, the considered emission factor was 118 kg head/year, corresponding to the highly productive dairy cow sector in the North American region.
CH4 emissions due to manure production
From the two levels for the estimation of CH4 emissions referred to manure livestock emissions provided by the IPCC guidelines, the Tier 1 methodology was applied:
 $${\rm CH}_{4} {\rm Em}_{{{\rm mm}}} {\equals}{{{\rm EF}{\times}{\rm LPOP}} \over {10^{6} {\rm kg\,/\,Gg}}}$$
where CH4Emmm is the CH4 emissions from manure management, for a defined population Gg/year. While the other components of the equation have been previously described, the emission factor (EF) used was 76 kg/head per year. This EF corresponds to the hot climates in the North America region with temperature averages greater than 25°C (IPCC, 2007).
N2O emissions due to manure management
The production of N2O generated during the manure storage, treatment and management, was also estimated. These emissions include both feces and urine produced by bovines under intensive conditions.
 $ \right( {\rm N}_{2} {\rm O}{\minus}{\rm N})_{{\left( {{\rm mm}} \right)}} {\equals}\mathop \sum\limits_{({\rm s})} \left\{ {\left[ {\sum_ {\rm N}{\times}{\rm Nex}{\times}{\rm MS}_{{({\rm S})}} } \right]{\times}{\rm EF}_{{3({\rm s})}} } \right\}$
where (N2O-N)(mm) is the N2O-N emissions from manure management (kg N2O-N/year); N the number of heads of livestock; Nex the annual average N excretion per head of livestock (kg N/animal per year); MS(S) the fraction of total annual excretion per animal managed in manure management system S; EF3(S) the N2O emission factor for manure management system S (kg N2O-N/kg N in manure management system S); S the manure management system.
The conversion of (N2O-N)(mm) emissions to N2O(mm) emissions was performed considering the equation proposed by Hongmin et al. (Reference Hongmin, Mangino, Mcallister, Hatfield, Johnson, Lassey, Aparecida de Lima and Romanosvskaya2006):
 ${\rm N}_{2} {\rm O}_{{({\rm mm})}} {\equals}({\rm N}_{2} {\rm O}{\minus}{\rm N})_{{({\rm mm})}} {\times}44\,/\,28$
Agriculture subcategory
In this subcategory, the direct N2O emissions from agricultural areas used for the production of forages, were estimated. It considers the nitrogen inputs such as synthetic and organic fertilizers on animal manure; the inputs from N-fixing varieties (FBN) as well as the incorporation of crop residues into soils (FcR), were also considered. The equation proposed by Hongmin et al. (Reference Hongmin, Mangino, Mcallister, Hatfield, Johnson, Lassey, Aparecida de Lima and Romanosvskaya2006) was used for the estimation of nitrous oxide emissions from manure management:
 ${\rm N}_{2} {\rm O}_{{{\rm Direct}}} {\minus}{\rm N}{\equals}\left[ {({\rm F}_{{{\rm SN}}} {\plus}{\rm F}_{{{\rm AM}}} {\plus}{\rm F}_{{{\rm CR}}} ){\times}{\rm EF}} \right]$
where N2ODirect-N is the emission of N2O in units of nitrogen; FSN the annual amount of synthetic fertilizer nitrogen applied to soils adjusted to account for the amount that volatilizes as NH3 and NOx; FAM the annual amount of animal manure nitrogen intentionally applied to soils adjusted to account for the amount that volatilizes as NH3 and NOx; FCR the amount of nitrogen in crop residues returned to soils annually; EF1 the emission factor for emissions from N inputs (kg N2O-N/kg N input).
The conversion of (N2O-N)(mm) emissions to N2O(mm) emissions was performed considering the equation proposed by Hongmin et al. (Reference Hongmin, Mangino, Mcallister, Hatfield, Johnson, Lassey, Aparecida de Lima and Romanosvskaya2006) as given above.
To estimate the quantity of nitrogenous fertilizer used in the Comarca Lagunera, the level of the extracted nitrogen from soils by different forage crops (i.e. corn, sorghum, rye grass, wheat and triticale) was considered, as suggested by Figueroa-Viramontes et al. (Reference Figueroa-Viramontes, Delgado, Cueto-Wong, Núñez-Hernández, Reta-Sánchez and Barbarick2011).
Methods to estimate the blue water footprint
First, the WFP per liter of milk was calculated based on the mathematical methodology proposed by Mekonnen and Hoekstra (Reference Mekonnen and Hoekstra2010):
WF[a,c,s]=WFfeed[a,c,s]+WFdrink[a,c,s]+WFserv[a,c,s]
where WFfeed[a,c,s], WFdrink[a,c,s] and WFserv[a,c,s] represent to the WFP of an animal in a c-category, in c-country, in an s-production system, and are related to feed, drinking water and service consumption, respectively. This quantification is related to an a-feed consumed, plus the c-water consumed plus the s-water related to services (Mekonnen and Hoekstra, Reference Mekonnen and Hoekstra2010).
 ${\rm WF}_{{{\rm feed}}} \left[ {{\rm a,c,s}} \right]{\equals}{\rm }{{\sum_{p{\equals}1}^n \left( {{\rm Feed}\left[ {{\rm a,c,s,p}} \right]{\rm X WF}_{{{\rm prod}}}^{{\rm {\asterisk}}} \left[ {\rm p} \right]} \right){\plus}{\rm WF}_{{{\rm mixing}}} \left[ {{\rm a,c,s}} \right]} \over {{\rm Pop}^{{\rm {\asterisk}}} \left[ {{\rm a,c,s}} \right]}}$
Feed[a,c,s,p] represents the annual amount of the p-feed ingredient consumed by an animal in an a-category, in a c-country, in an s-production system (t/year),
 ${\rm WF}_{{{\rm prod}}}^{{\rm {\asterisk}}} \left[ {\rm p} \right]$
the WFP of the p-feed ingredient (m3/t),
 ${\rm WF}_{{{\rm mixing}}}^{{}} \left[ {{\rm a,c,s}} \right]$
the volume of water consumed for mixing the feed for an a-animal category, in a c-country, in an s-production system (m3/year per animal) and Pop*[a,c,s] the number of slaughtered animals per year or the number of milk producing animals in a year for an a-animal category, in a c-country, in an s-production system.
Thereafter, the BWF was calculated considering the stress impact which results from the multiplication of the BWF value by a water stress index (WSI) as suggested by Ridoutt and Pfister (Reference Ridoutt and Pfister2010). The main concern related to the water consumption in the agro-livestock production sector is the possibility to promote a water shortage and to limit the availability of fresh water for human consumption as well as for the environment. For this reason, the direct consumption of blue water is crucial (Ridoutt and Pfister, Reference Ridoutt and Pfister2010). The WSI is used to evaluate the impact related to the fresh water consumption and is considered an indicator which evaluates water deprivation applied to the blue water (Pfister et al., Reference Pfister, Koehler and Hellweg2009). The WSI considers the water use–availability relationship (WTA). The WTA index is based on withdrawal-to-availability ratio; it has been developed to measure the relationship between water use and freshwater availability (Averyt et al., Reference Averyt, Meldrum, Caldwell, Sun, McNulty, Huber-Lee and Madden2013). The WSI values range from 0.01 to 1, and derivate from the following expression:
 ${\rm WSI}{\equals}{\rm }{1 \over {1{\plus}e^{{{\minus}6.4{\rm X WTA}^{{\rm {\asterisk}}} }} ({1 \over {0.1}}{\minus}1)}}$
where WTA* is a modified WTA, which considers the total quantity of water extracted for human usage, including both the agro-livestock and industrial usage, as well as the total annual water recharge in a specific region. As mentioned, the WSI value only applies for the BWF, using the methodology proposed by Ríos-Flores et al. (Reference Rios-Flores, Torres-Moreno, Castro-Franco, Torres-Moreno and Ruiz-Torres2015), which considers the physical WFP of an agricultural crop (Y1, expressed in m3 of water used in the production of 1 kg of agricultural product), quantified as follows:
 $Y_{i} {\equals}{{\sum_{i{\equals}1}^n Vi} \over {\sum_{i{\equals}1}^n Pi}}{\equals}{\rm }{{10,000\sum_{i{\equals}1}^n Si\left( {{{LRi} \over {ECi}}} \right)} \over {\sum_{i{\equals}1}^n Pi}}$
where in Y1, ‘Vi’ is the volume of water expressed in m3, used to produce a defined quantity of a ‘Pi’ product expressed in kg. To calculate the physical WFP to produce a liter of milk, ‘Si’ considers the harvested area (ha), LR is the required water (m), EC the water conduction efficiency, which should be greater than 0 and less than 1.
In this study, we decided to adopt a conservative approach since we did not include the additional hydric resources derived from the agricultural use of the land; the green WFP. Ridoutt and Pfister (Reference Ridoutt and Pfister2010) proposed that the green water consumption per se does not contribute to a water shortage until it is converted to blue water. The green water does not contribute to the environmental water flows which are required for the health of the freshwater ecosystems while it is not accessible for other human uses. In fact, the green water is only one of many other resources acquired throughout the land occupation; the solar radiation, the wind and the soil are some of the other acquired resources. It must be stated that we did not pretend to minimize the importance of the green water as a vital natural resource.
An international average price per m3 of water in some countries from the European Union (i.e. Dinamarca, Germany, Holland, Belgium and France among others) reported by Kjellsson and Liu (Reference Kjellsson and Liu2012), was considered to quantify the EC of the BWF; the EC fluctuated between 0.83 and 5.63€/m3.
Data and statistical analyses
Linear trends across the time of CH4 emissions, the EC of emissions and the EV of milk production were estimated as the linear regressions of these traits on year, fixing the year 1995 as the intercept, using the REG procedure of SAS software (version 9.4.; SAS Institute Inc., Cary, NC, USA). Minitab (Minitab Inc., State College, PA, USA) and Mathworks Inc. (Natick, MA, USA) programs were used for editing, data management and calculations.
Results
Dairy cow population and milk production
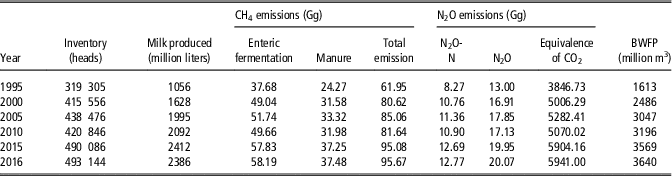
Cow inventory and total milk production is shown in Table 1. While the number of dairy cows producing milk increased by 54%, the total milk produced augmented by 87%, generating a cow productivity increase by 21%.
Milk production, methane (CH4) and nitrous oxide (N2O) emissions, and blue water footprint (BWFP; million m3) generated by the dairy cattle intensive production system in the Comarca Lagunera, Mexico, across years (1995–2016)

Greenhouse gas emission quantification
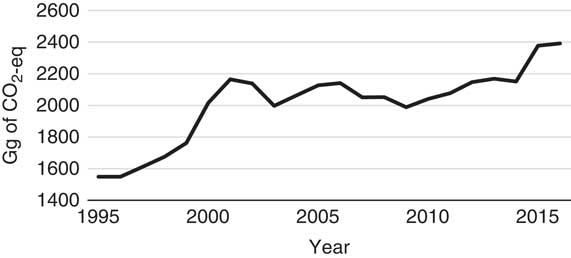
The analysis of methane emissions during the period considered in this study showed a growing trend with a total increase of 54% from 1995 to 2006 (Table 1). A very rapid rise occurred from 1995 to 2000, then a small decline in 2002, with no significant changes up to 2010, and then another increase (Figure 1).
Evolution of the total methane (CH4) emissions (Gg of CO2-eq) generated by the dairy cattle intensive production system in the Comarca Lagunera, Mexico, across years (1995–2016).

During the analyzed period, the amount of CO2-eq emissions generated by the production of forage increased from 8.18 tons of CO2-eq in 1995 to 17.29 tons of CO2-eq in 2016, due mainly to an increased use of nitrogenous fertilizers. The main forages produced were corn (51%), sorghum (30%) and oats (15%).
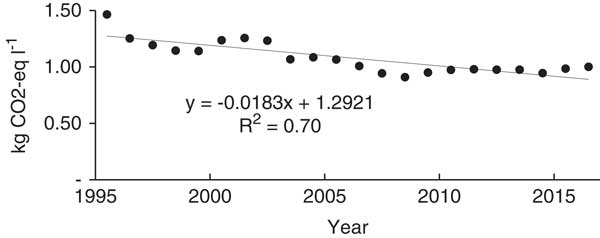
The CH4 emissions reported as CO2-eq per liter of milk showed a negative trend from 1995 to 2016 with small up and downs during intermediate years (Figure 2). The total decrease from 1995 to 2016 was 46% with an annual decrease of 0.0183 kg of CO2-eq per liter of milk (R 2=0.70).
Total methane (CH4) emissions (CO2-eq per liter of milk) generated by the dairy cattle intensive production system in the Comarca Lagunera, Mexico, across years (1995–2015).

The N2O emissions are presented in gigagrams of CO2-eq, and are directly proportional to the CH4 emissions, and followed the same trend across time; the largest N2O increase (14%) was observed in 1999–2000 (Table 1).
The trend of both the EV of milk produced as well as the environmental cost of these emissions are presented in Figure 3. From 1995 to 2016 the EV of milk produced increased by €37 354 million per year, whereas the environmental cost of CO2-eq emissions increased by €11 503 million per year.
Comparative analysis between the economic value of milk production and the economic cost of the CO2-eq emissions generated by the dairy cattle intensive production system in the Comarca Lagunera, Mexico, across years (1995–2016).

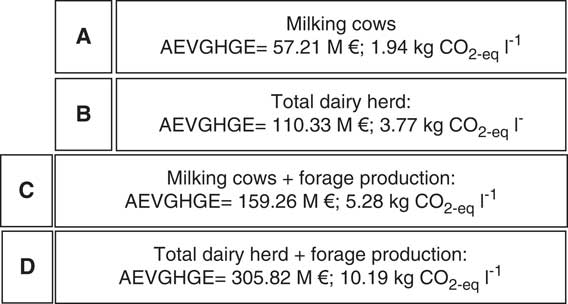
Figure 4 shows the total environmental cost of GHGE and the GHGE per liter of milk considering only milking cows or the total dairy herd and accounting for forage production. The total environmental cost of GHGE by the milking cows was €57.21 million with 1.94 kg of CO2 -eq per liter of milk. These numbers increased to €305.82 million and 10.19 kg of CO2 -eq per liter of milk, respectively, when the total herd is considered and forage production is accounted for in the calculations.
Average economic value of the greenhouse gas emissions (AEVGHE) and greenhouse gas emissions (kg CO2-eq) per liter of milk generated by A: milking cows, B: total dairy herd, C: milking cows+forage production and D: total dairy herd+forage production by the dairy cattle intensive production system in the Comarca Lagunera, Mexico (1995–2016). Annual average value of the dairy cow production=525.37 million of euros. AEVGHE is the economic value of the greenhouse gas emissions considering an estimated price of 15.75 euros per Ton CO2-eq. as proposed by Environmental Finance (2011) and Thompson Reuters (2011).

Blue water footprint quantification
Growth in both the dairy cattle inventory and the BWF in the Comarca Lagunera (1995–2016) is shown in Table 1. The volumetric BWF of the DCPS in the Comarca Lagunera was estimated to be 1613 million m3 in the year 1995 with an increase of 125% in 2016, whereas the cow inventory increased by 54%.
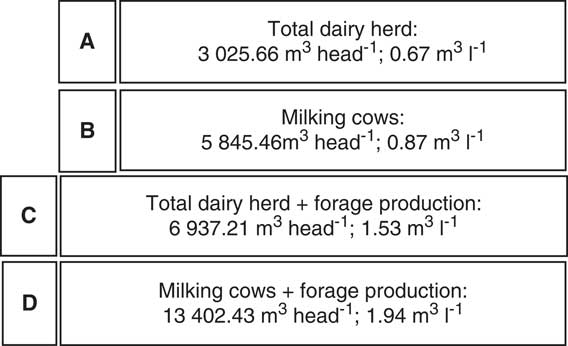
Figure 5 shows the annual BWF used per cow and per liter of milk under four situations. A: total dairy herd, B: milking cows alone, C: total dairy herd+forage production and D: milking cows+forage production, during the period considered in this study (1995–2016). A total of 3025 m3 of water per year was required per milking cow with a water use of 0.67 m3/l of milk. When water is accounted for the production of forages and calculations were performed for the total dairy herd, the amount of annual water use was estimated at 6 937 m3/head and 1.53 m3/l of milk.
Evolution of the total water footprint (blue+green+gray water; million m3) generated by the dairy cattle intensive production system in the Comarca Lagunera, Mexico, across years (1995–2016).

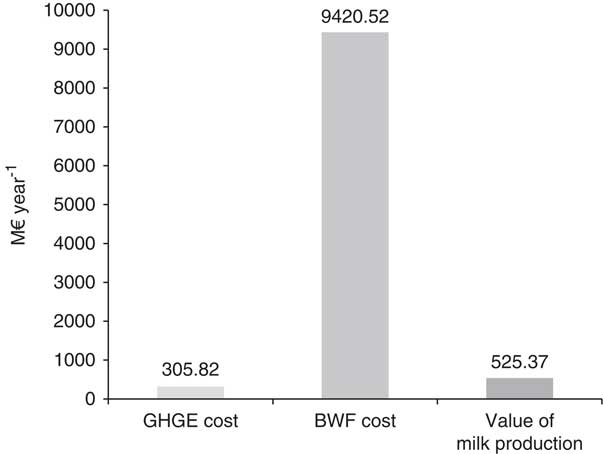
Figure 6 shows the comparison between the average annual environmental costs of the GHGE and BWF compared with the annual average value of milk production. The EV of milk production represented only 5.6% of the environmental cost of BWF and only 4.4% of total environmental costs. The environmental cost of GHGE represent 58.2% of the EV of milk production.
Annual average water use (m3/head and m3/l of milk) generated by A: total dairy herd, B: milked cows, C: total dairy herd+forage production and D: milked cows+forage production by the dairy cattle intensive production system in the Comarca Lagunera, Mexico (1995–2016).

Discussion
The main objective of this study was to contrast the EV of milk production against the EC of the GHGE and WFP related to the DCPS in the Comarca Lagunera, Mexico. Our results demonstrate that the EV of milk production from the DCPS increased to a higher rate than the EC of GHGE (Figure 3). The main factor explaining the differential rates is an increase in the productivity of milk per cow, which is reflected in a negative trend in methane emissions per liter of milk (Figure 2). Our results also demonstrate that the EV of milk production only represents 5.6% of the EC of BWF (Figure 6). All together, these main results highlight the substantial environmental costs of the DCPS, especially in an agro-ecological dryland context, as in the Comarca Lagunera.
From these results, it is evident the enormous challenges that the dairy cattle sector of the Comarca Lagunera faces to produce milk under a more sustainable way considering the high cost of GHGE and BWF. Mexico, as a country, does not produce enough milk to match the milk’s demand and more than 30% of the total milk consumed was imported (SIAP, 2017). This deficit could increase in the coming years as the human population is also growing (Gerber et al., Reference Gerber, Steinfeld, Henderson, Mottet, Opio, Dijkman, Falcucci and Tempio2013). New policies to increase milk production have to be carefully planned to mitigate the high BWF and GHGE, with concomitant increases not only in feed conversion efficiency but also cow’s productivity. These proposed policies need also to consider the changes in the population’s consume pattern and the climate changes linked to a dramatic and intense degradation of the ecosystems, which compromise the existence of a DCPS in an agro-ecological region of Mexico where water will have a priority use for human needs (Kumar et al., Reference Kumar, Thiaw, Yashiro and Molinero2011; Meza-Herrera et al., Reference Meza-Herrera, Ramirez-Flores, Lopez-Villalobos, Garcia-Martinez, Veliz and Lopez-Santiago2015 and Reference Meza-Herrera, Ramirez-Flores, Lopez-Villalobos, Silanikove, Garcia-Martinez and Veliz2016).
Greenhouse gas emissions
The estimated methane production from the enteric fermentation and manure production and management was 532 g/cow per day, which is greater than the range from 282 to 321 g/cow per day in Swedish Holsteins reported by Patel et al. (Reference Patel, Wredle, Börjesson, Danielsson, Iwaasa, Spörndly and Bertilsson2011). Such difference may arise because of dissimilarities from the production systems, suggesting a more intensified system in Sweden when considering milk production per cow per year; 5795 1 in the Comarca Lagunera v. 10 494 1 in Sweden.
The CH4 emissions per liter of milk decreased from 1.47 kg CO2-eq in 1995 to 0.91 kg CO2-eq in 2016, showing that dairy cattle from the Comarca Lagunera have been efficient in transforming feed into milk with less loss of energy as methane. The average value during the period considered in this study was 1.10 kg CO2-eq per liter of milk, which is similar to the value reported for North America dairy cattle (1.05 kg CO2-eq per liter of milk), less than that reported for Latin America and the Caribbean (2.10 kg CO2-eq per liter of milk) and at the world level (1.49 CO2-eq per liter of milk), although greater than that reported for European dairy cattle (0.72 kg CO2-eq per liter of milk) (Gerber et al., Reference Gerber, Steinfeld, Henderson, Mottet, Opio, Dijkman, Falcucci and Tempio2013). Annual fluctuations in the GHGE (Figure 1) and BWF (Table 1) are related to changes in the dairy herd inventory and feed inputs such as grains, forages and concentrates used in these calculations.
The water footprint
The relationship between livestock production and water consumption has not received much attention as other issues associated to the relationship between livestock and environment (Herrero et al., Reference Herrero, Thornton, Gerber and Reid2009). Unfortunately, in most parts of the world, water is considered a free or low-cost resource, a situation that needs to be reassessed in order to protect this crucial ecosystem service (Herrero et al., Reference Herrero, Thornton, Gerber and Reid2009). At the world level, freshwater resources are quite limited, representing only 2.5% of all water resources (Tiu and Cruz, Reference Tiu and Cruz2017). Besides, and as previously shown, groundwater is of paramount importance for almost 3 billion people which depend on this resource for drinking, with an increasing number of regions depicting a continuous groundwater deficit (Thornton, Reference Thornton2010). Certainly, while at the beginning of this century 38% of the world population lived in water-stressed basins, it is projected that by 2025 such proportion will rise up to 64% (Rosegrant et al., Reference Rosegrant, Fernandez, Sinha, Alder, Ahammad, de Fraiture, Eickhour, Fonseca, Huang, Koyama, Omezzine, Pingali, Ramirez, Ringler, Robinson, Thornton, van Vuuren and Yana-Shapiro2009). Moreover, according to de Fraiture et al. (Reference De Fraiture, Wichelns, Rockstrom and Kemp-Benedict2007) the water use for livestock is around 2180 km3/year. Unquestionably, this is a sensitive and quite significant issue, particularly when considering a DCPS located in an arid region as that observed in the Comarca Lagunera. The annual BWF generated by the DCPS in the Comarca Lagunera increased from 1613 million m3 in 1995 to 3640 million m3 in 2016. This significant increase is directly related to the overexploitation of the groundwater used for forage production. In fact, according to our projections, the DCPS in the Comarca Lagunera contributed to the shortage of fresh water of 2811.66 million m3 across the analyzed period.
The BWF in the Comarca Lagunera incurred in an annual average EC of €9420.52 million, which was significantly greater than the annual EV of milk production generated by the DCPS. This very high environmental cost of BWF was comprised of €1715.06 million (18%) originated from the milking cows, and €7705.46 million (82%) originated from forage production. Quantification of BWF per milking cow considered 5845 m3/year, but, once the BWF used for forage production was added, this figure increased up to 13402 m3/year. The amount of water required for forage production is more than 100% of the water required by the cows.
When quantifying both the GHGE and the BWF it is evident that the highest environmental impact of the DCPS arises from the BWF, which surpasses in a highly substantial fashion to the EV of the milk produced by the DCPS. These results are economically and environmentally relevant if we consider that the DCPS is located within an arid land and hot climate agro-ecosystem, where water availability is quite limited. It is of high importance the search for mitigation strategies in order to reduce the environmental impacts generated by the dairy industry in the Comarca Lagunera. A viable, long-term option could be the reconversion to other environmentally friendly economic activities, such as goat, sheep, pig or poultry production or vegetable production (tomato, asparagus, lettuce, etc.) using hydroponic and high technology in indoor vertical farms (Daniels, Reference Daniels2018).
A medium-term option is to promote the stratification of the DCPS moving the more water-demanding animal stratum of the DCPS to better suited agro-ecological regions from a water availability stand point. Nowadays, some amounts of maize silage and alfalfa hay are produced in other regions of Mexico, where water is less limited, and then transported to the Comarca Lagunera’s DCSP. Another example is the raising of replacement animals in other regions of the Mexico where these animals can be developed under grazing conditions. Nonetheless, the carbon footprint generated by transportation of either forage or animals, must be seriously evaluated.
Some potential strategies to mitigate the carbon footprint of the dairy cow production system
The proposed interventions to reduce the environmental impact of livestock production must be based on technologies and practices which would help to improve the efficiency at the herd level. There is a growing claim to produce more livestock commodities per unit of methane as well as per liter of water. This option includes the use of better quality foods balanced in such a way that help to reduce the GHGE at both enteric level and at manure management level (Herrero et al., Reference Herrero, Thornton, Gerber and Reid2009; Gerber et al., Reference Gerber, Steinfeld, Henderson, Mottet, Opio, Dijkman, Falcucci and Tempio2013; Moate et al., Reference Moate, Deighton, Williams, Pryce, Hayes, Jacobs, Eckard, Hannah and Wales2016). Manure management practices must assure both recuperation and recycling of nutrients and energy, coupled to improvements in the energy use efficiency along the supplement chain in order to better contribute to the mitigation efforts (Gerber et al., Reference Gerber, Steinfeld, Henderson, Mottet, Opio, Dijkman, Falcucci and Tempio2013).
Some promising technologies to improve forages and food additives include bioactive compounds, fat, ionophores/antibiotics, propionate boosters, arqueobacteria inhibitors, nitrates and sulfate supplements along with the development of vaccines and genetic selection methods. All of these have a great potential to reduce GHGE and must therefore be developed as viable options as short-term mitigation strategies (Herrero et al., Reference Herrero, Thornton, Gerber and Reid2009; Smith et al., Reference Smith, Bustamante, Ahammad, Clark, Dong, Elsiddig, Haberl, Harper, House, Jafari, Masera, Mbow, Ravindranath, Rice, Robledo-Abad, Romanovskaya, Sperling and Tubiello2014; Gerber et al., Reference Gerber, Steinfeld, Henderson, Mottet, Opio, Dijkman, Falcucci and Tempio2013; Moate et al., Reference Moate, Deighton, Williams, Pryce, Hayes, Jacobs, Eckard, Hannah and Wales2016).
Improved animal genotypes with increased productive efficiency generating low GHGE per unit of product, or those with a better potential to decrease enteric fermentation emissions must also be evaluated. Microbial technologies to develop arqueas vaccines, methanotrophic microorganisms, rumen defaunation, bacteriophages and the use of probiotics to improve reproductive efficiency are all middle-term options to scale-up mitigation schemes (Smith et al., Reference Smith, Bustamante, Ahammad, Clark, Dong, Elsiddig, Haberl, Harper, House, Jafari, Masera, Mbow, Ravindranath, Rice, Robledo-Abad, Romanovskaya, Sperling and Tubiello2014). Genomic selection aligned to direct measurements of methane emissions as well as food conversion efficiency would promote reductions regarding the intensity of methane emissions (Herrero et al., Reference Herrero, Thornton, Gerber and Reid2009; Moate et al., Reference Moate, Deighton, Williams, Pryce, Hayes, Jacobs, Eckard, Hannah and Wales2016). In addition, in order to reduce the N2O emissions, Smith et al. (Reference Smith, Bustamante, Ahammad, Clark, Dong, Elsiddig, Haberl, Harper, House, Jafari, Masera, Mbow, Ravindranath, Rice, Robledo-Abad, Romanovskaya, Sperling and Tubiello2014) proposed diet manipulation to decrease fecal N, diet nitrification inhibitors, urease inhibitors, best selection of fertilizers as well as to use better practices when managing the manure incorporated into soils. Up to 30% reductions from manure emissions can be achieved throughout existing manure management technologies generated in Europe (Oenema et al., Reference Oenema, Oudendag and Velthof2007). In addition, policy makers and professionals involved in the agro-livestock management sector must be able to implement different strategies to mitigate the impact upon the ecosystemic services (De Groot et al., Reference De Groot, Wilson and Boumans2002). When considering strategies to mitigate the GHGE, bioenergy could be an interesting alternative, however, it is important to consider different issues such as the implementation of practices to enhance sustainability as well as the efficiency of the bioenergy systems (Smith et al., Reference Smith, Bustamante, Ahammad, Clark, Dong, Elsiddig, Haberl, Harper, House, Jafari, Masera, Mbow, Ravindranath, Rice, Robledo-Abad, Romanovskaya, Sperling and Tubiello2014).
Some potential strategies to mitigate the water footprint of the dairy cow production system
We need to accentuate that in the Comarca Lagunera, several parties from both the rural and urban sectors economically depend, either directly or indirectly, from the DCPS. Rather than propose radical actions to reduce or even eliminate this economically important dairy industry, smart alternatives to reduce the environmental impact of this activity must be proposed.
Since the DCPS in the Comarca Lagunera is performed under extremely arid conditions, with an annual rainfall <300 mm, the search of technological protocols and regulatory policies to promote a rational use of water must be considered. As the greatest impact of the DCPS arises from the animal food production and management, it seems plausible, as a short-term strategy, to stimulate the stratification of the DCPS. As previously mentioned, this could be done by promoting the production of forages and grains in a different geographical region better suited to sustain such production without compromise the hydrological balance of a defined region. In addition, it is of particular importance to promote the use of more technified and efficient irrigation systems in the agricultural area of the Comarca Lagunera. Besides, the stratification scheme of animal production must be considered to be implemented in the animal management of the DCPS, so that those non-productive animals could be raised in a different geographical region and could promote their growth and development under a less vulnerable production system. Of paramount importance will be curbing the environmental deterioration of the Sierra of Durango by proposing a healthy, efficient and sensible management of the upper basin of the Nazas River, which aside to the groundwater as well as the blue water, are the main hydrological sources for the agricultural activities in the Comarca Lagunera. Such strategy should privilege management practices to promote the arrival of an increased volume of water to the lower river basin located in the Comarca Lagunera. In line with this idea, the promotion of payments for environmental services to the settlers of the higher basin not only to stop forest deterioration but also to support its conservation and enhance water recollection and carbon capture, must be seriously considered.
Unquestionably, such potential mitigation schemes would be only viable with the involvement and commitment of the different entities implied in this complex production system, especially the dairy farmers themselves. Certainly, both methodologies and logistics must be planned carefully in order to achieve these goals to mitigate the impacts of the animal industry on both the environment and natural resources. Alternatively, the use of other dairy genotypes or crosses such as Jersey or Brown Swiss, because their reduced body size, are quite efficient regarding both energy and water utilization with reasonably favorable results for the dairy industry, could be also considered. Despite a potential reduction in the milk produced volume, the use of these genotypes can compensate for any losses using this strategy because of the increased total solid milk content, especially fat and protein content.
To conclude, the environmental impact of the DCPS of the Comarca Lagunera was economically quantified during the period from 1995 to 2016. When compared with the EV of milk production, it can be observed a null profitability since the EV of milk production represented only 4.4% of environmental costs. Certainly, the dairy cattle industry is responsible of this significant anthropogenic environmental impact in the Comarca Lagunera. The greatest environmental and EC is generated because of the WFP of the DCPS, and water is an extremely limited and scarce natural resource in this hot-arid region with an awfully water-stressed basin. A very strict policy to mitigate this impact could be the establishment of a differential payment or taxation scheme. This could be done by considering both the amount of water used as well as the quantity of GHGE, based on international prices. The last is not proposed as a monetary-collecting strategy but to promote a more efficient and rational production process while a reduction of the anthropogenic environmental impact. Future studies are required to quantify the societal and economic benefit of the dairy cattle industry in the Comarca Lagunera while testing different mitigation strategies.
Acknowledgements
The authors recognize the support for the following International Collaborative Projects funded by the National Council of Science and Technology (CONACYT, Mexico): CONACYT-FOMIX-DURANGO: DGO-2008-C01-87559 & DGO-2009-C02-116746, and CONACYT-SIVILLA-1998-0401010, the ALFA-III-ALAS/ALFA-III-82, supported by the European Union. The authors also acknowledge to the Research Sectorial Fund SAGARPA-CONACYT: 2017-4-291691, which greatly contributed to the generation of most of the information presented in this study. C.N.M. is a double-degree doctoral student from the Graduate Programs at Chapingo Autonomous University-URUZA (UACH-URUZA, Mexico) and the University of Cordoba (UCO, Spain), supported by a CONACYT-Scholarship Grant, CVU-585972. Raquel Lozano (Massey University, New Zealand) is gratefully acknowledged for reading and correcting the manuscript (In loving memory; Ing. Juan Daniel Segovia-Martinez, 1998–2018).
Declaration of interests
None.
Ethics statement
In order to conduct this study, both existing and generated databases were used, therefore, no Animal Care and Use Committee approval was required.
Software and data repository resources
None of the data or models were deposited in an official repository.