Introduction
Data-driven precision agriculture has the potential to improve the yield while minimizing the environmental impact, leading to an economic and environmental benefit (Skjødt et al., Reference Wulder, Masek, Cohen, Loveland and Woodcock2003, Mamo et al., Reference Mamo, Malzer, Mulla, Huggins and Strock2003, Kindred et al., Reference Kindred, Milne, Webster, Marchant and Sylvester-Bradley2014). This is achieved by considering the intra-field variations while employing farming practices. A prerequisite of precision agriculture is an increasing practice of advanced machinery and obtainment of application maps. Consequently, it is desirable to use an automated process of identifying fields where the potential benefits of employing precision agriculture are highest. It has been shown how the profit of employing precision agriculture increases as the intra-field variations increases (Nilsson, Reference Nilsson2010; Delin et al., Reference Delin, Gruvaeus, Wetterlind, Stenberg, Frostgård and Börling2015). This calls for a method for identification, on a regional or national scale, of fields exhibiting high degrees of variations. Hereby, the benefit of employing precision agriculture is maximized regarding economic and environmental gain.
Satellite imagery has become readily available following the opening of access to Landsat data in 2008 (Wulder et al., Reference Wulder, Masek, Cohen, Loveland and Woodcock2012) by NASA and the open access to all Sentinel satellites by ESA. This is complemented by significant improvements in the open source software for handling and processing the data (Jeppesen et al., 2015). Multi-spectral Sentinel-2 satellite imagery with resolutions of 10 m×10 m is freely available from open online data sources with a current global revisit time of 10 days, which will be halved to 5 days when Sentinel-2B will launch (Drusch et al., Reference Drusch, Del Bello, Carlier, Colin, Fernandez and Gascon2012). One possible application of such satellite imagery is to monitor and track crop development via calculation of vegetation indices. This paper investigates and presents a simple method for categorizing fields on a regional level according to their intra-field variations based on Sentinel-2 satellite imagery, which results in a possibility for identifying fields with the highest potential for further action with precision agricultural practices (Nilsson, Reference Nilsson2010; Delin et al., Reference Delin, Gruvaeus, Wetterlind, Stenberg, Frostgård and Börling2015). This can be used for calculating e.g. variable rate nitrogen application maps based on the satellite imagery (Seelan et al., Reference Skjødt, Hansen and Nyholm2003), or for selecting fields for further investigation using e.g. drones. The method can be implemented using open source software. It can be automated to continuously provide categorizations as new satellite images become available.
Materials and methods
The area under study is Funen in Denmark. The island has an area of 3100 km2 and counts presently 7678 winter wheat fields. Funen has historically been recognized for its rich farmland.
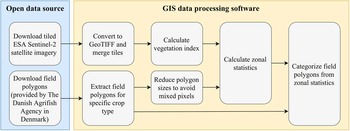
An overview of the processing workflow of the proposed method is illustrated in Figure 1. Initially, satellite images are downloaded and used to create a vegetation index from combinations of measured reflectance in the different spectral bands. The vegetation index is subsequently used along with field polygons to calculate zonal statistics, including the standard deviation of the pixel values of the vegetation index inside each field polygon. The field-level standard deviation is used as a measure of the intra-field variation within the specific field. All fields within the region of interest are then compared and ranked based on the standard deviation. This results in a categorization based on the intra-field variations. The method can be implemented using open source processing software, such as QGIS, or in custom applications using libraries such as GDAL and R.
Overview of the software and data workflow.

QGIS was used for the data processing, which is an open source GIS application for data processing and visualization. To carry out the zonal statistics, the required field polygons for Denmark were downloaded and the winter-wheat polygons were extracted. The Sentinel-2 images were downloaded from Amazon AWS, and orthophotos from spring 2016 were used as base maps. Orthophotos of Denmark are produced on a yearly basis and provided freely by The Danish Geodata Agency.
The ESA Sentinel-2 satellite provides 13-band multi-spectral imagery, with a spatial resolution down to 10 m x 10 m, at no cost. The imagery is divided in 100 km x 100 km tiles, which is provided by several online platforms (e.g. ESA Scientific Hub, Amazon AWS, Google Cloud Platform). In the proposed method, the required Sentinel-2 bands are downloaded in the 100 km×100 km tiles in jpeg2000 format. The data is then converted to GeoTIFF and merged to produce a single image for each spectral band for the entire region of interest.
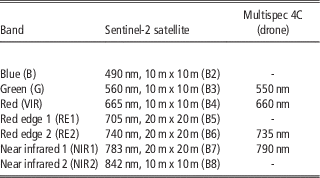
A vegetation index is used in remote sensing to estimate properties of vegetation. For instance, NDVI (Normalized Difference Vegetation Index) can be used to estimate biomass (Rouse et al., Reference Roy, Wulder, Loveland, Woodcock, Allen and Anderson1973). Two or more spectral bands from a multi-spectral sensor are used to calculate vegetation indices. Table 1 gives an overview of the center wavelengths and spatial resolution of 7 bands in the Sentinel-2 satellite, along with the center wavelengths of a 4 band multi-spectral drone (Multispec 4C), such as the ones used by Airinov, for comparison. Note that the altitude of flight determines the spatial resolution of the drone.
Center wavelength and spatial resolution of sensor bands (Drusch et al., Reference Drusch, Del Bello, Carlier, Colin, Fernandez and Gascon2012, Haghighattalab et al., Reference Haghighattalab, González Pérez, Mondal, Singh, Schinstock and Rutkoski2016).

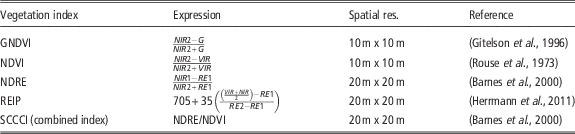
In the past, a wide variety of vegetation indices have been developed for different purposes, such as estimation of biomass (Rouse et al., Reference Roy, Wulder, Loveland, Woodcock, Allen and Anderson1973) and chlorophyll concentration (Gitelson et al., Reference Gitelson, Kaufman and Merzlyak1996). Table 2 shows an overview of some of the most widespread vegetation indices as defined for Sentinel-2 imagery, alongside with the achievable spatial resolution.
Vegetation indices as defined for the Sentinel-2 satellite

The choice of vegetation index is flexible due to the many spectral bands provided by the Sentinel-2 satellite. However, it should be considered thoroughly, for instance, NDVI is simple to calculate and provides an easy way to identify vegetation, but it saturates at high chlorophyll concentrations, directing one towards GNDVI to alleviate this problem (Gitelson et al., Reference Gitelson, Kaufman and Merzlyak1996). REIP (Red Edge Inflection Point) is considered to be less sensitive to soil reflectance (Raper et al., Reference Raper and Varco2015), but is only valid where vegetation is present (Clevers et al., Reference Clevers, de Jong, Epema, van der Meer, Bakker, Skidmore and Addink2001), resulting in inconsistencies when measuring e.g. bare soil or water. Combined vegetation indices have also been developed, such as the SCCCI (Simplified Canopy Chlorophyll Content Index) which provides good correlation with crop nitrogen status (Raper et al., Reference Raper and Varco2015).
The zonal statistics (cf. Figure 1) calculates the mean and standard deviation of the vegetation index pixel values within specified field polygons. The first step is to obtain the field polygons, which should be openly available within the EU. In Denmark, field polygons are provided by The Danish Agrifish Agency and are updated each spring for the new growth season. A specific crop type is queried, and the field polygons are reduced in size to avoid inclusion of mixed pixels in the zonal statistics. Mixed pixels are present due to the geometric precision and the resolution of the satellite, where e.g. a road next to the field is sensed as part of the field. The zonal statistics are calculated, and the intra-field standard deviation is then used to categorize fields, such that a field with a low and high standard deviation corresponds to a field exhibiting low and high intra-field variation respectively.
Results
To validate our proposed method we provide a case study on an NDVI based categorization of 7678 winter wheat fields on Funen, Denmark, on 4th of June 2016. However, the method is applicable to all crop types with meaningful vegetation indices.
The vegetation index used for the case study was chosen to be NDVI, as it is well known and the use of it is widespread in the agricultural domain. The Sentinel-2 images were converted to GeoTIFF and merged using the raster translate and merge tools in QGIS. The winter wheat field polygons were selected, and the fixed buffer size tool was used to reduce the polygons in size by 20 m, to avoid mixed pixels. The calculations of the zonal statistics were carried out in QGIS on the reduced size polygons, where the mean and standard deviation of the NDVI values within individual fields were found. The standard deviations were then compared on a regional level using all 7678 fields and used to categorize the fields into five categories defined by equal numbered quantiles. The five categories are found according to the statistics and then used for categorization of the original size polygons. The categorized winter-wheat field polygons can then be used to highlight the fields exhibiting the highest intra-field variation.
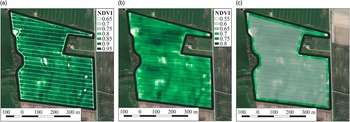
To determine the validity of the Sentinel-2 NDVI map, a multi-spectral drone and satellite imagery of a field on Funen were captured on 20th of May 2016 and 4th of June 2016 respectively. The drone NDVI maps were provided by Airinov and captured using a Multispec 4C sensor. Figure 2a and 2b, which provide an overview of the resulting NDVI maps of the field, show good agreement with each other. Due to the higher resolution of the NDVI map resulting from the Multispec 4C sensor, the drone NDVI image (Figure 2a) can reveal the tracks from the machinery that has been operating on the field. These details cannot be distinguished on the satellite NDVI image (Figure 2b) because of the lower spatial resolution.
Comparisons of a single field using a) drone NDVI on 20th of May, b) Sentinel-2 satellite NDVI on 4th of June, and in c) a highlight of the reduced size polygon used for zonal statistics.

The drone image is interpreted as a ground truth with respect to the NDVI calculated from the satellite image. It should be noted that the NDVI absolute values differ on the two measurements. This is caused by a range of factors, such as different wavelengths of the multi-spectral cameras, atmospheric disturbances, different dates, and sun orientation. Nevertheless, the important factor in the proposed method are the relative values for the same measurement. Figure 2c shows the reduced size polygon used for statistics, where the outermost 20 m have been cropped out to circumvent the mixed pixel effects.
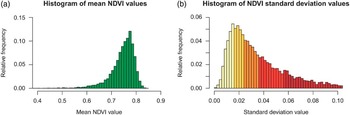
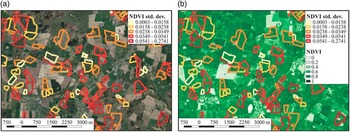
The standard deviation of the pixels within the fields provides information on the intra-field variation as shown in the histograms in Figure 3. The categorization illustrates the fields with high standard deviation values, and hence the fields with high intra-field variations. These fields are expected to provide the highest potential for further action through precision agricultural practices. Furthermore, it is possible to track the mean values within the fields to quantify the status of individual fields compared on a regional or national scale. Examples of the categorized fields are seen in Figure 4.
Histograms showing a) mean NDVI values and b) categorized NDVI standard deviation values.

Map of categorized winter wheat fields, with base maps showing a) RGB ortophoto and b) Sentinel-2 NDVI map from 4th of June 2016.

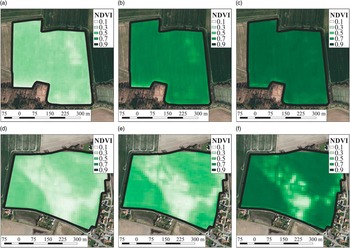
Figure 5 shows examples of two winter-wheat fields from the lowest and highest variation categories. An important benefit of open satellite imagery is the availability of historic data, which grants the possibility of investigating the development of the fields in the months preceding the categorization date. NDVI maps of the two fields were generated for 8th of April and 5th of May 2016, along with the NDVI map used for the categorization on 4th of June. Note that a direct comparison between the two fields is less meaningful due to unknown differences in the early crop cycle conditions, such as the sowing time.
Examples of NDVI maps from a field from the lowest variation category on a) 8th of April, b) 5th of May, and c) 4th of June, along with NDVI maps of a field from the highest variation category on d) 8th of April, e) 5th of May, and f) 4th of June. All dates from year 2016.

The top row in Figure 5 shows the low-variation field, where the benefits of variable rate nitrogen application are limited due to the homogeneity of the field. Looking at the high-variation field in the bottom row, significant benefits can be achieved from applications maps based on satellite imagery (Seelan et al., Reference Skjødt, Hansen and Nyholm2003), or even larger benefits might be achieved through further investigation and creation of application maps based on high-resolution drone imagery.
Discussion
The proposed method relies on the application of open data and open source software, which have been made possible by the recent increase in publicly available data and the improvements in open source software for advanced geospatial analysis (Jeppesen et al., Reference Jeppesen, Jacobsen, Jørgensen and Toftegaard2016). This contributes to the overall cost-efficiency of our approach. The method can be automated, continuously providing updates for every satellite image throughout the growth season. Satellite imagery does have limits regarding cloud coverage, resulting in uncertain measurement times. Although cloud coverage is a problem, one can expect to have several cloud-free images of a field throughout the growing season. Moreover, cloud masks are supplied when downloading the satellite data, hence the modifications needed to perform cloud masking before statistical analysis are minimal, and the categorization can be done based on the cloud-free field polygons. Finally, Landsat 8 can also be used, however, it does not measure the RE1, RE2, and NIR1 bands, and it has a spatial resolution of 30 m×30 m (Roy et al., Reference Seelan, Laguette, Casady and Seielstad2014).
The proposed method is agnostic to the choice of vegetation index, which can be chosen to map certain vegetation properties, for instance, biomass (e.g. NDVI) or chlorophyll density (e.g. NDRE). Due to the short revisit time of the satellite, the method allows us to track the development of intra-field variations over a crop cycle in a simple manner. This provides a valuable tool for farmers and consultants when planning which fields to visit. Secondly, machine pool services and drone services may offer site specific services to new customers based on the intra-field variations. Thirdly, coarse nitrogen application maps can be generated in an automated manner for all fields visible by the satellite (Seelan et al., Reference Skjødt, Hansen and Nyholm2003). Drone operations quickly become impractical and overwhelmingly expensive with frequent imagery, hence the method complements the use of drone imagery for an in-depth investigation of high-variation fields through its improved spatial resolution.
To publish the results to a web-platform in a seamless manner, GeoNode can be used. It is a web-based spatial data infrastructure providing a simple interface for upload, download, and visualization of geospatial data online (Jeppesen et al., Reference Jeppesen, Jacobsen, Jørgensen and Toftegaard2016). It provides a back-end system, based on GeoServer and a database (e.g. PostGIS), which can also be used along with OGC web services, such as WMS and WFS, to create customer-friendly web pages to show the results.
Conclusions
In this paper, we proposed and validated a simple method for categorization of fields according to their intra-field variations of vegetation indices calculated from multispectral satellite imagery. The study categorized 7678 winter wheat fields on Funen, Denmark, where drone imagery was used to establish ground truth. The proposed method showed good potential for identifying fields where additional conceivable agricultural practices, such as variable rate nitrogen application, would provide the highest potential for an economic benefit. The presented method is based on open data and can be implemented using open source software, such that the cost of employing the method is minimal. Furthermore, it can be automated, such that categorization is updated when new satellite imagery is acquired. Future work includes determination of nitrogen application maps based on satellite imagery.
Acknowledgements
This work was funded by Innovation Fund Denmark as part of the Future Cropping project (J. nr. 5107-00002B), a large Danish research project with the aim of increasing agricultural productivity while minimizing the environmental impact beyond the current state of the art.