

Introduction
Most community-dwelling elderly people who have clinically significant levels of depressive symptomatology do not meet the full diagnostic criteria for major depressive episodes (Blazer, Reference Blazer2003; Cuijpers et al., Reference Cuijpers, Vogelzangs, Twisk, Kleiboer, Li and Penninx2013). Studies of depression in the elderly have thus increasingly focused on levels of depressive symptomatology rather than diagnostic categories, as this takes into account clinically significant sub-syndromal states; the latter being not only highly prevalent in the elderly (12–15%), but also associated with high co-morbidity, high mortality and treatment resistance (Olfson et al., Reference Olfson, Broadhead, Weissman, Leon, Farber, Hoven and Kathol1996; Helmchen & Linden, Reference Helmchen and Linden2000; Kirsch et al., Reference Kirsch, Deacon, Huedo-Medina, Scoboria, Moore and Johnson2008).
Previous studies have suggested that depressive states in the elderly may have a highly variable course due to their diverse origins. Very few studies in the general elderly population have undertaken the complex task of characterising dimensional symptom trajectories over a long time period. One study considered a priori trajectory groups instead of estimating them (Chen et al., Reference Chen, Mullan, Griffiths, Kreis, Lan and Chiu2011), while others used methods such as non-parametric K-means clustering (Cui et al., Reference Cui, Lyness, Tang, Tu and Conwell2008) or a semi-parametric latent class growth analysis (LCGA) (Jones & Nagin, Reference Jones and Nagin2007; Andreescu et al., Reference Andreescu, Chang, Mulsant and Ganguli2008; Byers et al., Reference Byers, Vittinghoff, Lui, Hoang, Blazer, Covinsky, Ensrud, Cauley, Hillier, Fredman and Yaffe2012; Hsu, Reference Hsu2012; Liang et al., Reference Liang, Xu, Quinones, Bennett and Ye2011) which do not fully take into account intra-subject correlation (correlation between repeated evaluations of the same subject). One recent study (Kuchibhatla et al., Reference Kuchibhatla, Fillenbaum, Hybels and Blazer2012) used a more complex method, the generalised growth mixture model (Muthen et al., Reference Muthen, Brown, Masyn, Jo, Khoo, Yang, Wang, Kellam, Carlin and Liao2002), which takes into account both intra-subject correlation and individual variability in depressive symptom curves over time within each trajectory group. This study included covariates such as self-rated health, cognition, functional disability, social network and recent stressful events, but not other major risk factors for depression in the elderly such as chronic diseases and early-life stressors (Cole & Dendukuri, Reference Cole and Dendukuri2003; Vink et al., Reference Vink, Aartsen and Schoevers2008; Ritchie et al., Reference Ritchie, Jaussent, Stewart, Dupuy, Courtet, Ancelin and Malafosse2009). Possible gender differences in clinical trajectories were also not examined, although such differences have consistently been observed in the levels, characteristics and course of depressive symptoms (Piccinelli & Wilkinson, Reference Piccinelli and Wilkinson2000; Ryan et al., Reference Ryan, Carriere, Ritchie, Stewart, Toulemonde, Dartigues, Tzourio and Ancelin2008; Carriere et al., Reference Carriere, Gutierrez, Peres, Berr, Barberger-Gateau, Ritchie and Ancelin2011). In women symptom levels tend to be higher and chronicity of depression appears to have a greater impact, perhaps due to over reporting of symptoms, psychological, neurochemical, hormonal, genetic, and personality factors and higher stress reactivity (Grigoriadis & Robinson, Reference Grigoriadis and Robinson2007). Given these differences it would be clinically more useful to examine the course of depressive symptoms separately in men and women. This would furthermore enable the establishment of thresholds for the early detection of persons at high risk of a severe and unremitting disease course.
The present study has two aims: (i) to examine trajectories of depressive symptoms over a 10-year period for men and women separately, using statistical modelling methods which take into account intra-subject correlation and individual differences and (ii) to examine a wide range of current and life-time risk and protective factors potentially associated with different trajectories. Identifying factors contributing to depressive symptom chronicity and remission in men and women may subsequently be useful to indicate potential intervention windows.
Material and methods
Study sample
Participants of the Enquête de Santé Psychologique – Risques, Incidence et Traitement (ESPRIT) study were recruited over a 2-year period from 1999 to 2001 (Ritchie et al., Reference Ritchie, Artero, Beluche, Ancelin, Mann, Dupuy, Malafosse and Boulenger2004), by random selection from the electoral rolls in Montpellier, France. Eligible people, who were at least 65 years of age and non-institutionalised, were invited to participate and provided written informed consent. Of the people initially drawn at random, 27.3% did not participate. Those who refused to participate were replaced by another person drawn at random from the same electoral division to ensure representativeness. Participants were administered a number of standardised questionnaires by trained staff and underwent clinical examinations at baseline, 2, 4, 7 and 10 years of follow-up. Ethics approval was granted by the Ethics Committee of the University Hospital of Kremlin-Bicêtre (France). Informed consent was obtained from all individual participants included in the study.
Of the 2259 participants included in the cohort, 1988 subjects (816 men and 1172 women) with at least two repeated measures of depressive symptoms throughout the 10-year period were at first selected. Of these, 735 subjects with missing data for at least one baseline covariate were excluded (of them 481 had incomplete responses to the childhood event questionnaire) leaving 1253 (517 men and 736 women) in the main analysis. Sensitivity analysis for detection of trajectories was also performed on the full sample of 1988 participants.
Compared with the participants included in the analysis, those excluded were older, with a lower level of education and were more likely to be treated with antidepressants and to have mobility limitations, ischemic pathologies, low cognitive performance and depressive symptomatology. They were also more likely to have lack of support during childhood (p < 0.001 for all comparisons). There were no significant differences regarding gender, past major depressive episode and 5-HTTLPR genotype.
Depressive symptoms
Depressive symptoms were evaluated at each wave using the Center for Epidemiologic Studies Depression Scale (CES-D) (Radloff, Reference Radloff1977), a 20-item self-report rating scale designed to evaluate the frequency and severity of depressive symptoms and validated in French (Fuhrer & Rouillon, Reference Fuhrer and Rouillon1989; Morin et al., Reference Morin, Moullec, Maiano, Layet, Just and Ninot2011). Response to each item was on a 4-point scale varying from 0 to 3 and the total score ranged from 0 to 60. Participants with a CES-D score ≥16 are considered as having high levels of depressive symptomatology which would warrant clinical intervention (Radloff, Reference Radloff1977).
Baseline covariables
The standardised interview included questions on demographic characteristics, level of education and mode of living. Detailed medical questionnaires included history of diabetes and ischemic pathologies. Participants with a body mass index (BMI) over 25 kg/m2 were classified as overweight. At baseline and follow-up examinations, the general questionnaire included an inventory of all drugs (including antidepressant drugs) used during the preceding month which were systematically coded using the Anatomical Therapeutic Chemical classification system (WHO Collaborating Centre, 2013). Purpose of treatment was not recorded. Mobility was assessed according to the Rosow and Breslau scale (Rosow & Breslau, Reference Rosow and Breslau1966) which evaluates ability to do heavy housework, walk half a mile and climb stairs. Cognitive functioning was assessed using a modified version of the Isaacs Verbal Fluency test (Isaacs & Kennie, Reference Isaacs and Kennie1973). This timed test of lexical access draws on conceptual, linguistic and mnesic abilities, and is thus sensitive to pathologies in both frontal and posterior brain regions (Schlosser et al., Reference Schlosser, Hutchinson, Joseffer, Rusinek, Saarimaki, Stevenson, Dewey and Brodie1998). The participants were asked to generate as many words as possible in 30 s within a given semantic category such as colours, animals, fruits or cities. In the absence of a validated cut-off, low cognitive performance was a priori defined in our study as scoring in the lower tertile and corresponded to a total score lower than 43.
A retrospective self-report questionnaire (Ritchie et al., Reference Ritchie, Jaussent, Stewart, Dupuy, Courtet, Ancelin and Malafosse2009) examining traumatic experiences during childhood and adolescence (covering 25 adverse and 8 protective factors), was given to subjects for completion in the third wave of the study (4 years after recruitment by which time the interviewer had established a close relationships with the participants). These factors were combined in three variables: parental mental problems, lack of support (less than six positive items among the following: paternal and maternal affection, availability of an adult friend, raised by both parents, impression of having had a happy childhood, a normal education, feeling happy at school and the impression that parents did their best) and adverse childhood events (at least one negative item among: poverty, neglected, verbal, physical or sexual abuse, humiliation or mental cruelty, excessive punishment, or parents too often sharing their problems with children). Exposure to stressful life events in the past year was also assessed at baseline using the Gospel Oak 12-item questionnaire including bereavement, rupture in a close relationship, severe illness and serious financial or legal problems (Harwood et al., Reference Harwood, Prince, Mann and Ebrahim1998). The Mini International Neuropsychiatric Interview (MINI) (Sheehan et al., Reference Sheehan, Lecrubier, Sheehan, Amorim, Janavs, Weiller, Hergueta, Baker and Dunbar1998), a standardised psychiatric examination was used for the diagnosis of past major depressive episodes, according to Diagnostic and Statistical Manual of Mental Disorders, 4th Edition (DSM-IV) criteria.
Blood samples for DNA collection were taken after the baseline clinical interview. The serotonin-transporter-promoter region (5-HTTLPR) was genotyped as previously reported (Ritchie et al., Reference Ritchie, Jaussent, Stewart, Dupuy, Courtet, Ancelin and Malafosse2009) having previously been found to moderate the relationship between stress and depression (Karg et al., Reference Karg, Burmeister, Shedden and Sen2011; Miller et al., Reference Miller, Wankerl, Stalder, Kirschbaum and Alexander2013).
Statistical analyses
The χ 2 test for categorical variables and the Wilcoxon rank-sum test for continuous variables were used to identify gender differences and to compare the included and excluded participants. The latent class mixed model (LCMM) was used to identify trajectory groups of CES-D score over time. This model seeks potential latent profiles in heterogeneous populations. It combines a latent class model to identify homogenous latent groups of subjects and a mixed model to describe the mean trajectory over time in each latent group, while taking into account the individual correlation between repeated measures. In the latent class sub-model, a multinomial logistic model was used to characterise the latent classes according to baseline covariates. The function LCMM (Proust-Lima et al., Reference Proust-Lima, Philipps, Diakite and Liquet2014) of the R-package version 3.1.3 was used to estimate the model parameters.
As the CES-D distribution is skewed to the left, the original scale was transformed with a beta cumulative distribution function simultaneously estimated with the LCMM model. The class-specific trajectories of depressive symptoms were described according to years since entry in the cohort using a quadratic polynomial without adjustment for baseline covariates. All analyses were stratified by gender. The optimal number of latent classes and the shape of the class-specific trajectories were determined by sequentially increasing the number of model parameters (one- to four- latent classes with a linear or quadratic time trajectory, a diagonal or unstructured random-effect covariance matrix and a class-specific or proportional random-effect covariance matrix (Proust-Lima et al., Reference Proust-Lima, Philipps, Diakite and Liquet2014)). This sequential procedure screened a total of 180 models for each gender (Supplementary Material). The Bayesian information criteria were used to select the best model. For each model, 50 sets of random starting values were tested to ensure that an adequate solution was obtained.
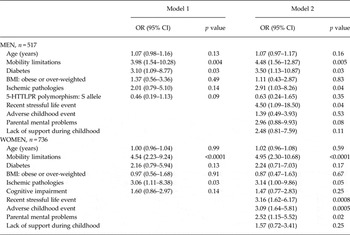
Covariates were firstly introduced separately in the class-membership model adjusted for baseline age. Significant covariates with a p-value <0.20 in the age-adjusted model were then put together in the multivariate models. Two nested adjusted models were built. The first (Model 1) included age, mobility, diabetes, obese or overweight and ischemic pathologies for both genders and also 5-HTTLPR genotype for men and cognitive performance for women. The second (Model 2) further included recent stressful life events as well as childhood lack of support, adverse events and parental mental problems.
Results
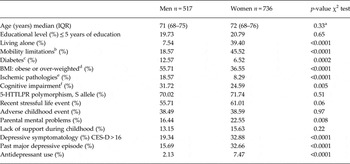
At baseline, the median age [inter quartile range (IQR)] of the 1253 participants (517 men and 736 women) was 72 years (68–76) and the median time (IQR) of follow-up was 8.9 (7.6–9.0) years. Women were more likely to live alone, have mobility restriction, and reporting parental mental problems during childhood (Table 1). They also reported more frequently high levels of depressive symptoms, antidepressant use and past major depressive episodes. Diabetes, ischemic pathologies, high BMI and low cognitive performance were more frequent in men.
Sample description at baseline (n = 1253)

BMI, body mass index; CES-D, Center for Epidemiologic Studies Depression Scale; IQR, inter quartile range.
a Wilcoxon test.
b Inability to do heavy housework, walk half a mile and climb stairs.
c Diabetes defined as fasting glycemia ≥7 mmol/l or treated.
d BMI over or equal to 25.
e History of stroke, myocardial infarction, angina pectoris, arteritis, or cardio-vascular surgery.
f Isaacs Verbal Fluency test score at 30 s <43.
Trajectories of depressive symptoms
In both genders two sub-populations were identified corresponding to two different profiles of symptom change over the 10-year follow-up. The final mathematical expressions (Supplementary Material) of the estimated class-specific linear mixed models differed for men and women.
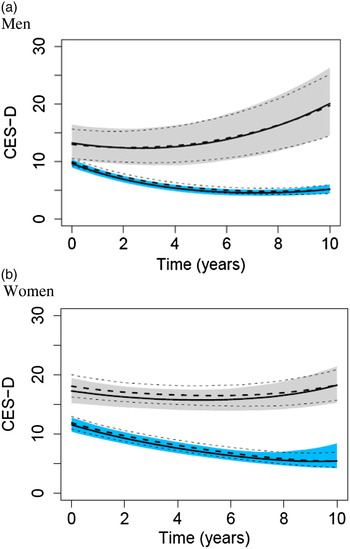
In men, both curves start at a low level of depressive symptoms (below the CES-D threshold of 16 at baseline). The upper curve (9.1% of men) increases over time with a marked quadratic shape at the end of the follow-up (Fig. 1a – solid curves). The confidence interval (CI) is large due to the relatively small number of subjects in this trajectory. The lower curve (90.9% of men) shows decreasing CES-D scores with a very low final level (5.2). In women, the upper curve (25.0% of women) shows a steady high level over the 10 years (mean CES-D at inclusion equal to 17.3) (Fig. 1b – solid curves) while the lower curve (75.0% of women) clearly decreases from 11.6 at the beginning to 5.4 at the end of the follow-up. The same patterns of symptom course were also found on the full sample of 1988 participants (816 men and 1172 women which included those with missing covariate data) (Figs. 1a and 1b – dashed curves), which further strengthens our results.
Depressive symptom trajectories in men and women. Solid line: estimated trajectories and corresponding confidence interval (shaded area) for the selected sample of 517 men and 736 women having data for risk factors. Dashed line: estimated trajectories and corresponding confidence interval (dashed limits) for the overall sample of 816 men and 1172 women.

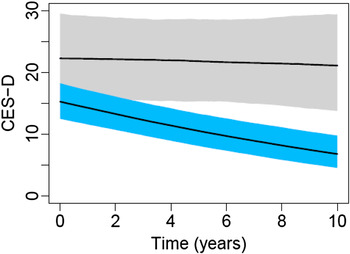
Of the 517 men and 736 women included in the main analysis, 57 men (11%) and 161 women (21.9%) were treated with antidepressant at least once over the 10-year follow-up. When trajectories of depressive symptoms were analysed in the sub-group of treated women two trajectories with identical profiles were again found (Fig. 2), although they were shifted upwards in comparison with the overall sample. The group of treated men was too small to investigate their specific trajectories.
Depressive symptom trajectories in women treated with antidepressants. Estimated trajectories and corresponding confidence interval (shaded area) for the selected sample of 161 women treated with antidepressant at least once over the follow-up (n = 35 in the upper curve and n = 126 in the lowest curve).

Factors associated with specific trajectories
In both genders the age-adjusted probability of being in the at risk upper trajectory was significantly increased with mobility limitations, diabetes, ischemic pathologies, recent stressful life event, parental mental problems, lack of support during childhood and past major depressive episode. Low cognitive performance and adverse childhood events in women and 5-HTTLPR genotype in men were also significant (Table 2). Baseline characteristics were then entered in the multivariate models with the exception of past major depressive episode and antidepressant use which may constitute intermediate factors between childhood events and depressive symptoms in late life.
Associations between baseline covariates and the probability of being in the upper trajectory – age adjusted class – membership models

BMI, body mass index; CI, confidence interval; OR, odds ratio.
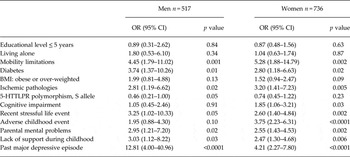
In men, the odds of being in the upper increasing curve were higher when they had mobility limitations and diabetes with odds ratios (OR) of 3.98 and 3.10, respectively (Table 3, Model 1). The S allele of the 5-HTTLPR polymorphism tended to be negatively associated with the odds of a poor symptom course but the association did not reach the level of significance (p = 0.09). When recent or adverse childhood events were further included in the model (Table 3, Model 2), mobility limitations, diabetes and ischemic pathologies as well as recent stressful events and marginally parental mental problem were associated with the upper curve. The association with 5-HTTLPR was no more significant and no significant interactions were found with recent or early childhood adverse environment (p-value >0.25).
Associations between baseline covariates and the probability of being in the upper trajectory – multivariate class – membership models

BMI, body mass index; CI, confidence Interval; OR, odds ratio.
In women, mobility limitations and ischemic pathologies were significantly associated with poor symptom course (Table 3, Model 1). When recent or adverse childhood events were further included in the model (Table 3, Model 2), these results remained unchanged. In addition, recent stressful events, adverse childhood events and parental mental problems were significant, with particularly high OR for recent stressful events and adverse events during childhood (OR of 3.16 and 3.09, p ≤ 0.0008).
Discussion
Modelling symptom trajectories
Using 10-year follow-up data from a large general population cohort established specifically for the prospective study of psychiatric disorder in the elderly, we clearly differentiated pathways of chronic and remitting depressive symptoms for men and women. For a small group of men (9.1%), we observed an increase in depressive symptoms and a trend towards worsening at the end of the follow-up. A larger female group, comprising a quarter of women, was observed to have a constantly high level of symptoms (above the threshold of 16). In contrast to these two patterns showing persistent symptoms, the remaining majority of men and women showed decreasing symptomatology over time, falling from clinically significant to very low levels. When the analysis was restricted to the women treated with antidepressants the same pattern was found with a sub-group showing a steady high level of symptoms, but this was higher than in overall sample which raises the question of treatment efficacy, adequacy and/or compliance.
Comparing our methodology with previous attempts to characterise depression trajectories in elderly population, past studies have mostly used a semi-parametric LCGA with the statistical analysis system (SAS) procedure Traj (Jones & Nagin, Reference Jones and Nagin2007). This exploratory analysis is a specific case of LCMM in which the repeated measures within a subject are assumed to be independent. Applying the proc Traj to our data (data not shown) gives five trajectories in women and men. This overestimation of the number of latent classes is typical of LCGA (Muthén & Asparouhov, Reference Muthén, Asparouhov, Fitzmaurice, Davidian, Verbeke and Molenberghs2008). This may be explained by the neglected within subject correlation (modelled in the LCMM by subject-specific random-effects) which is captured by additional trajectory groups. A consequence of this is that inferences regarding covariates may be biased.
LCMM is similar to the Growth Mixture Modelling implemented in M-Plus software (Muthen et al., Reference Muthen, Brown, Masyn, Jo, Khoo, Yang, Wang, Kellam, Carlin and Liao2002) with the exception that M-plus does not normalise the scores using parameterised transformations. Using this methodology with a modified CES-D scale ranging from 0 to 20 Kuchibhatla et al. (Reference Kuchibhatla, Fillenbaum, Hybels and Blazer2012), found four groups of trajectories (stable high, stable low, increasing and decreasing). The study was not, however, stratified by gender although in the final multinomial logistic model, female gender was reported to be associated with the downward and stable high trajectories; this being consistent with our findings.
Risk factors for chronic trajectories in men and women
Examining a large range of covariates commonly associated with depression in the elderly across the life-span, we observed that a chronic course was associated with both distal and proximal risk factors. With regard to early-life factors, having reported parents with psychiatric disorders and adverse events during childhood in women, were significantly associated with a severe and chronic course of illness in late life. Adverse childhood experiences are associated with later affective vulnerability (Chapman et al., Reference Chapman, Whitfield, Felitti, Dube, Edwards and Anda2004). Possible explanations of this association could involve a genetic pathway (particularly when parents had mental problems), early structural and functional changes of the nervous system (functional changes of corticotropic hypothalamic-pituitary-adrenal axis and alterations in brain structures like the hippocampus) (Frodl & O'Keane, Reference Frodl and O'Keane2013), stress related inflammation and metabolic dysfunctions (Vamosi et al., Reference Vamosi, Heitmann and Kyvik2010) as well as epigenetic changes (Klengel et al., Reference Klengel, Pape, Binder and Mehta2014) and telomere shortening (Kiecolt-Glaser et al., Reference Kiecolt-Glaser, Gouin, Weng, Malarkey, Beversdorf and Glaser2011). In the same cohort, we previously reported an association between past traumatic life event and alteration in metabolic or vascular disorders (Chaudieu et al., Reference Chaudieu, Norton, Ritchie, Birmes, Vaiva and Ancelin2011) as well as cortisol secretion (Chaudieu et al., Reference Chaudieu, Beluche, Norton, Boulenger, Ritchie and Ancelin2008) and a permanent alteration in hypothalamic-pituitary-adrenal axis in the participants with a history of depression (Beluche et al., Reference Beluche, Chaudieu, Norton, Carriere, Boulenger, Ritchie and Ancelin2009). Our results remained significant in women despite possible over-adjustment on intermediate factors (obesity, diabetes, ischemic pathologies and recent stressful events). In men, the associations with parental mental problems and lack of support during childhood became non-significant after multiple adjustments but this may be due to lack of statistical power and/or possible over-adjustment. While previous research has shown that adverse childhood exposures may induce on-going vulnerability to depression persisting into late-life (Ritchie et al., Reference Ritchie, Jaussent, Stewart, Dupuy, Courtet, Ancelin and Malafosse2009) we further extend these findings by suggesting they also contribute to depressive symptom chronicity.
Vulnerability to depression following adverse childhood exposures has been observed to be modulated by 5-HTTLPR polymorphism, with carriers of the short (S) allele having increased risk although not consistently (Karg et al., Reference Karg, Burmeister, Shedden and Sen2011; Risch et al., Reference Risch, Herrell, Lehner, Liang, Eaves, Hoh, Griem, Kovacs, Ott and Merikangas2009). The reverse risk has also been observed, with carriers of the L allele being more vulnerable, and this has been related to insecure attachment, family adversity and lower resilience capacity in younger (Olsson et al., Reference Olsson, Byrnes, Lotfi-Miri, Collins, Williamson, Patton and Anney2005; Laucht et al., Reference Laucht, Treutlein, Blomeyer, Buchmann, Schmid, Becker, Zimmermann, Schmidt, Esser, Rietschel and Banaschewski2009; Carli et al., Reference Carli, Mandelli, Zaninotto, Roy, Recchia, Stoppia, Gatta, Sarchiapone and Serretti2011) as well as in older populations (Surtees et al., Reference Surtees, Wainwright, Willis-Owen, Luben, Day and Flint2006; Ritchie et al., Reference Ritchie, Jaussent, Stewart, Dupuy, Courtet, Ancelin and Malafosse2009). We only found a weak association in men with the S allele being protective which disappeared after adjustment for early adverse events including parental risk.
With regard to more proximal risk factors, we found very recent stressful events (disease, death, divorce and financial and judicial problems in the past year) to be associated with adverse trajectories in men and women in the multivariate model independently of early adverse environment. Only one previous trajectory study (Kuchibhatla et al., Reference Kuchibhatla, Fillenbaum, Hybels and Blazer2012) also found recent stressful life events to be a risk factor for chronic course. In relation to other proximal factors we found mobility limitations and ischemic pathologies in men and women, as well as diabetes in men to be linked to adverse trajectories.
Diabetes, heart disease and global burden of chronic diseases were associated with a high risk of developing depression in other trajectory studies (Chen et al., Reference Chen, Mullan, Griffiths, Kreis, Lan and Chiu2011; Byers et al., Reference Byers, Vittinghoff, Lui, Hoang, Blazer, Covinsky, Ensrud, Cauley, Hillier, Fredman and Yaffe2012). Depression has consistently been associated with vascular risk including ischemia and diabetes, it is present in around 20% of patients with cardiovascular disease and in 18–39% of type 2 diabetic patients (Roy & Lloyd, Reference Roy and Lloyd2012) and is associated with adverse cardiovascular outcomes (Rudisch & Nemeroff, Reference Rudisch and Nemeroff2003). A number of biological mechanisms (neuroendocrine dysfunction, hemodynamic factors, immune activation, thrombotic predisposition) (Parissis et al., Reference Parissis, Fountoulaki, Filippatos, Adamopoulos, Paraskevaidis and Kremastinos2007) and behavioural factors (smoking, obesity, poor self-care) (Joynt et al., Reference Joynt, Whellan and O'Connor2003) can link depression and cardiovascular disease in a bidirectional relationship. In diabetic patients, specific risk factors such as diabetes complications, poor glycemic control and burden of insulin therapy can also increase the risk of depression (Renn et al., Reference Renn, Feliciano and Segal2011). In our study the risk increase associated with ischemic pathologies persisted after multiple adjustments while that association with diabetes persisted only in men. Icks et al. also found no significant association between diabetes and depressive symptoms in women after controlling for co-morbidities (Icks et al., Reference Icks, Kruse, Dragano, Broecker-Preuss, Slomiany, Mann, Jockel, Erbel, Giani and Moebus2008).
In women poor cognitive performance in verbal fluency was also at risk in the age-adjusted model. However, this association became non-significant after controlling for physical comorbidity and mobility limitations. Three trajectory studies in the elderly failed to demonstrate a significant association between cognitive performance evaluated with the Mini Mental State Examination or the Trail Making Test and unfavourable trajectories (Andreescu et al., Reference Andreescu, Chang, Mulsant and Ganguli2008; Cui et al., Reference Cui, Lyness, Tang, Tu and Conwell2008; Byers et al., Reference Byers, Vittinghoff, Lui, Hoang, Blazer, Covinsky, Ensrud, Cauley, Hillier, Fredman and Yaffe2012). Only one study showed that poor mental status measured with the Short Portable Mental Status Questionnaire (a very brief dementia screening test) increased the odds of being in the worsening symptom class (Kuchibhatla et al., Reference Kuchibhatla, Fillenbaum, Hybels and Blazer2012). Depressive symptoms may be a reaction to early cognitive deficit, chronic depression may impair cognitive functions and depression may be a risk factor or a prodromal stage of dementia for a subset of older adults (Byers & Yaffe, Reference Byers and Yaffe2011).
Our results indicate that mobility limitation is a highly significant risk factor for chronic symptomatology in both men and women with a 4–5-fold increase in the odds of being in the increasing symptoms class or in the chronic but stable high symptom class, respectively. Activities of daily living or physical functioning were also found to predict poor outcome in previous studies of the course of depressive symptoms (Andreescu et al., Reference Andreescu, Chang, Mulsant and Ganguli2008; Cui et al., Reference Cui, Lyness, Tang, Tu and Conwell2008; Chen et al., Reference Chen, Mullan, Griffiths, Kreis, Lan and Chiu2011; Liang et al., Reference Liang, Xu, Quinones, Bennett and Ye2011; Byers et al., Reference Byers, Vittinghoff, Lui, Hoang, Blazer, Covinsky, Ensrud, Cauley, Hillier, Fredman and Yaffe2012; Hsu, Reference Hsu2012; Kuchibhatla et al., Reference Kuchibhatla, Fillenbaum, Hybels and Blazer2012;). A range of mediators have been suggested to explain the association between disability and the development of depression, notably decreased self-esteem, loss of sense of control, restriction of the social network and isolation (Carriere et al., Reference Carriere, Villebrun, Peres, Stewart, Ritchie and Ancelin2009).
Altogether, our study highlighted distinct baseline thresholds of CES-D scores in elderly women and men which predict future adverse trajectories; the upper trajectory initiated at 17.3 (95% CI 15.2–19.4) in women and slightly lower in men, at 13.2 (95% CI 10.4–16.4), and these baseline levels were significantly higher from those of the remitting trajectories (Fig. 1). Our study also enabled the characterisation of risk factors for a poor course of depressive symptoms in the elderly. This may help to detect elderly people who could benefit from an early intervention, thus preventing them from late-life depression and subsequent consequences in terms of co-morbidity and functional disability.
Limits and strengths
Our study has several limitations. Although repeated examinations have been performed with five time points over 10 years, between-wave transitory changes in depressive symptoms may not have been detected. As in all other trajectory studies, the effect of missing data and study attrition was not addressed in this study. Our statistical models assumed such effects to be negligible [ignorable missing response assumption (Little & Rubin, Reference Little and Rubin1987)] however a possible link may exist between loss to follow-up and worsening of depressive symptoms which may have affected trajectory estimates. Since the depressive trajectory groups were different on baseline depressive symptoms, the relationships between risk factors and depressive symptom trajectories could be partly due to associations with baseline depressive levels. The two worst trajectories included 25% women and only 9.1% men which suggests lower statistical power and lack of statistical significance for some exposures in men. Furthermore stratifying analyses by gender precluded drawing conclusions with regard to gender difference in risk factors. Finally information based on retrospective recall, especially for childhood events, could not be independently validated; however, the observed associations were very strong.
Our study presents several strengths. We used a robust statistical method taking into account the highly skewed distribution of the CES-D scale with the beta distribution function and within-subject correlation with subject-specific random effects. We checked that the profiles of symptom course were the same in the whole original sample and in the restricted sample without missing data for covariates. We used data over 10 years from a prospective general population study specifically designed to examine the course of psychiatric symptomatology in the elderly. We used a symptom scale with a wide score range and examined a wide range of depression-related risk factors including for the first time, early life exposures and genetic factors. We stratified by gender in order to observe gender-specific course and risk factors of depressive symptoms.
In conclusion, the analyses suggest for the first time distinct patterns of chronic and remitting symptomatology course in men and women and that a chronic disease course is associated with exposure to recent life stressors, disability and disease co-morbidity in both genders as well as to childhood adversity in women.
Supplementary materials
The supplementary materials referred to in this article can be found at http://dx.doi.org/10.1017/S2045796015001122
Acknowledgements
None
Financial support
The 3C Study is conducted under a partnership agreement between the Institut National de la Santé et de la Recherche Médicale (Inserm), Victor-Segalen Bordeaux2 University, and Sanofi- Aventis. The 3C-Study was also supported by the Caisse Nationale Maladie des Travailleurs Salariés, Direction Générale de la Santé, MGEN, the Institut de la Longévité, Agence Française de Sécurité Sanitaire des Produits de Santé, the Regional Governments of Aquitaine, Bourgogne and Languedoc-Roussillon, the Fondation de France, the Ministry of Research-Inserm Programme ‘Cohorts and collection of biological material’, Novartis, the ‘ANR – Agence Nationale de la Recherche – The French National Research Agency’ under the ‘Programme National de Recherche en Alimentation et nutrition humaine’, project ‘COGINUT ANR-06-PNRA-005’, the ‘Programme Longévité et vieillissement’, project 07-LVIE-004’ and 07-LVIE 003 01, the Institut de Recherche en Santé Publique (IReSP), Paris, France.
The funders had no role in the design and conduct of the study, collection, management, analysis and interpretation of the data; and preparation, review, or approval of the manuscript.
Conflict of Interest
None
Ethical Standards
The authors assert that all procedures contributing to this work comply with the ethical standards of the relevant national and institutional committees on human experimentation and with the Helsinki Declaration of 1975, as revised in 2008.