



1 Introduction
When considering the flow-induced vibration of a circular cylinder in a free stream, vortex-induced vibration (VIV) is the only process capable of resulting in large-scale oscillations of the structure. During VIV, the body motion is predominantly in the cross-stream direction, even if the structure can respond in the streamwise direction, or rotate about its axis (Jauvtis & Williamson Reference Jauvtis and Williamson2005; Horowitz & Williamson Reference Horowitz and Williamson2010). However, small departures from this basic flow that break the reflection symmetry, such as modifying the body to have an angle of attack, adding shear or turbulence to the incoming flow, or forcing the cylinder to rotate (as done in this paper) can give rise to completely different bluff body flow-induced vibration phenomena. Examples of such phenomena are transverse galloping and aeroelastic flutter (Parkinson & Smith Reference Parkinson and Smith1964; Zhao et al. Reference Zhao, Leontini, Lo Jacono and Sheridan2014). Such phenomena do not necessarily result in essentially cross-stream oscillation, like VIV does, and the body motion can have a large streamwise component.
A particular example of such a streamwise flow-induced vibration is presented in the recent study from Bourguet & Lo Jacono (Reference Bourguet and Lo Jacono2015) (BL15), which showed that a cylinder elastically mounted yet constrained to oscillate only in the streamwise direction could execute extremely large oscillations (with amplitudes over 2.5 times the cylinder diameter) if it was forced to constantly rotate. The change in symmetry of the boundary conditions, and the input of energy, excite flow-induced vibration modes that are not accessible in the non-rotating cylinder case. BL15 observed a number of exotic vortex configurations in the wake of the body and also recorded a variety of three-dimensional structures.
Here, an attempt is made to explain the appearance of these various three-dimensional structures using Floquet stability analysis. The underlying problem is simplified by imposing the cylinder rotation and a purely sinusoidal streamwise oscillation, rather than allowing the oscillation to be driven by the flow. This simplification appears justified as the coupled motion recorded by BL15 is very close to sinusoidal. Various combinations of amplitude and frequency are run to encompass the range of parameters observed in the free case. Two three-dimensional modes are found, each with a distinct spanwise wavelength, and each linked to a unique instability mechanism. Depending on the frequency, either mode can be the first to become unstable with increasing amplitude. Comparison with the fully three-dimensional fluid–structure interaction simulations of BL15 shows that the first mode to become unstable sets the wavelength and subsequent saturated dynamics of the flow. The fact that the leading mode is a function of the frequency explains why the three-dimensional wavelength varies as a complicated function of the rotation rate in the fully coupled simulations.
Section 2 describes the problem set-up and the numerical methods employed. Section 3 presents the results of the stability analysis and § 4 provides some concluding remarks.
2 Methodology
2.1 Base flows
The simulations were conducted using a well-validated spectral-element method (Thompson, Hourigan & Sheridan Reference Thompson, Hourigan and Sheridan1996). For the base flow, the code solved the incompressible Navier–Stokes equations in a frame of reference travelling with the centre of the cylinder
 $$\begin{eqnarray}\left.\begin{array}{@{}c@{}}{\displaystyle \frac{\unicode[STIX]{x2202}\boldsymbol{u}}{\unicode[STIX]{x2202}t}}=-(\boldsymbol{u}\boldsymbol{\cdot }\unicode[STIX]{x1D735})\boldsymbol{u}-{\displaystyle \frac{1}{\unicode[STIX]{x1D70C}}}\unicode[STIX]{x1D735}p+\unicode[STIX]{x1D707}\unicode[STIX]{x1D6FB}^{2}\boldsymbol{u}-\ddot{\boldsymbol{x}},\\ \unicode[STIX]{x1D735}\boldsymbol{\cdot }\boldsymbol{u}=0,\end{array}\right\}\end{eqnarray}$$
where
 $\boldsymbol{u}$
is the velocity field,
 $t$
is time,
 $\unicode[STIX]{x1D70C}$
is the fluid density,
 $p$
is the pressure field,
 $\unicode[STIX]{x1D707}$
is the fluid dynamic viscosity and
 $\ddot{\boldsymbol{x}}=[\ddot{x}\quad 0]^{\text{T}}$
is the acceleration of the frame of reference, equal to the linear acceleration of the cylinder linear motion given by
 $$\begin{eqnarray}x=A_{d}\sin (2\unicode[STIX]{x03C0}f_{d}t),\end{eqnarray}$$
where
 $x$
is the displacement from the origin in the streamwise direction,
 $A_{d}$
is the amplitude and
 $f_{d}$
is the frequency of oscillation.
Since the circular cylinder is axisymmetric, the cylinder rotation was implemented by simply imposing the tangential velocity at the cylinder surface as a Dirichlet boundary condition. The boundary conditions for the velocity at the other boundaries were as follows. At the boundaries upstream and lateral of the cylinder, a Dirichlet boundary condition was used to impose the free stream velocity minus the frame velocity. At the downstream or outlet boundary, a Neumann boundary condition was imposed with the value of the gradient of the velocity in the normal direction set to zero.
For the pressure, a high-order Neumann condition was imposed at the body and the upstream and lateral boundaries, with the value of the pressure gradient in the normal direction derived from the Navier–Stokes equations (Gresho & Sani Reference Gresho and Sani1987; Karniadakis, Israeli & Orszag Reference Karniadakis, Israeli and Orszag1991). At the downstream or outlet boundary, a Dirichlet condition was imposed, with the value of the pressure set to zero.
The spectral-element method solved equations (2.1) in the weak or variational form, similar to all finite-element-based methods. The domain was decomposed into 916 quadrilateral elements, that were free to have either straight or constant-radius curved sides. These elements were further internally decomposed by using seventh-order Lagrange polynomials as shape functions. These Lagrange polynomials were associated with Gauss–Legendre–Lobatto quadrature points for efficient calculation of the spatial integrals required for the weak form solution. A thorough description of spectral-element methods can be found in Karniadakis & Sherwin (Reference Karniadakis and Sherwin2005).
Temporal discretization employed a three-way time splitting scheme (e.g. see Thompson et al. Reference Thompson, Hourigan, Cheung and Leweke2006). Here, the integration from the start to the end of a time step was split into three substeps: the first substep integrated the advection and frame acceleration terms (the first and fourth terms on the right-hand side of (2.1)) to a velocity field at an intermediate time using an explicit second-order Adams–Bashforth scheme; the second substep integrated the pressure term from this first intermediate velocity field to a second intermediate time using an implicit second-order Crank–Nicolson scheme; the third substep integrated the diffusion term from this second intermediate field to the velocity field at the end of the step using an implicit second-order Crank–Nicolson scheme.
To solve for the pressure, the divergence of the second substep equation was taken, and the incompressibility constraint was imposed on the velocity field at the end of the substep. This results in a Poisson equation that can be solved for the pressure field, which can then be used to complete the second substep.
Details of this spectral-element scheme can be found in the textbook from Karniadakis & Sherwin (Reference Karniadakis and Sherwin2005).
Previous studies have shown that the domain size can be important in flows such as those studied here. The domain size has been fixed throughout the study at
 $\unicode[STIX]{x1D6FA}\in [-20D:90D][-55D:55D]$
, similar to other recent studies of similar flows (Rao et al.
Reference Rao, Leontini, Thompson and Hourigan2013; Bourguet & Lo Jacono Reference Bourguet and Lo Jacono2015). The mesh resolution has been assessed by varying the order of the polynomial shape functions of the spectral elements. The results show that base flow quantities vary by less than 0.1 %, and eigenvalues from the Floquet stability analysis vary by less than 1 % when varying the polynomial order from seven to eight.
2.2 Perturbation fields and stability analysis
The Floquet methodology relies on a periodic base flow. All the simulations undertaken here happen to be periodic within the parameters tested. The first step for the global Floquet stability analysis is to form equations that govern the evolution of small perturbations. This is done by decomposing the velocity and pressure fields into base flow and perturbation components, substituting this into the equations of motion outlined in (2.1), subtracting the terms for the base flow, and linearizing (discounting nonlinear terms). The resulting equations are
 $$\begin{eqnarray}\left.\begin{array}{@{}c@{}}{\displaystyle \frac{\unicode[STIX]{x2202}\boldsymbol{u}^{\prime }}{\unicode[STIX]{x2202}t}}=-((\boldsymbol{u}\boldsymbol{\cdot }\unicode[STIX]{x1D735})\boldsymbol{u}^{\prime }+(\boldsymbol{u}^{\prime }\boldsymbol{\cdot }\unicode[STIX]{x1D735})\boldsymbol{u})-{\displaystyle \frac{1}{\unicode[STIX]{x1D70C}}}\unicode[STIX]{x1D735}p^{\prime }+\unicode[STIX]{x1D707}\unicode[STIX]{x1D6FB}^{2}\boldsymbol{u}^{\prime },\\ \unicode[STIX]{x1D735}\boldsymbol{\cdot }\boldsymbol{u}^{\prime }=0,\end{array}\right\}\end{eqnarray}$$
where
 $\boldsymbol{u}^{\prime }$
is the perturbation velocity field and
 $p^{\prime }$
is the perturbation pressure field. This system can be further decomposed by considering perturbations that are harmonic in the spanwise direction. Doing so results in a set of equations that decouple for different spanwise wavelengths,
 $\unicode[STIX]{x1D706}$
, and the wavelength appears explicitly in the equations (Barkley & Henderson Reference Barkley and Henderson1996).
These equations were solved using the same spectral-element method as outlined above. Dirichlet boundary conditions stating that the perturbation was zero were imposed at the cylinder surface and the upstream and lateral boundaries. The zero-normal-gradient condition was imposed at the outflow boundary. For the pressure perturbation, the condition for the normal pressure gradient was the same as that imposed on the base flow. The analysis progressed by first evolving the base flow to a periodic state, then the base flow and perturbation flow were integrated in time together.
Floquet stability analysis progresses by looking for eigenvectors and associated eigenvalues of a linear operator
 $\boldsymbol{L}$
that maps a system from one period to the next. In the context of the flow considered here
 $$\begin{eqnarray}\boldsymbol{u}^{\prime }(t+T)=\boldsymbol{L}\boldsymbol{u}^{\prime }(t),\end{eqnarray}$$
where
 $T$
is the period. In implementation, the operator
 $\boldsymbol{L}$
is never explicitly formed; its action is calculated by integrating the equations governing the perturbation evolution (2.3) forward by one period. Further details of performing linear stability using this time-stepper approach can be found in Tuckerman & Barkley (Reference Tuckerman and Barkley2000) and details of the implementation used here are presented in Leontini, Lo Jacono & Thompson (Reference Leontini, Lo Jacono and Thompson2015).
Since the operator is not explicitly formed, its corresponding eigenvectors and eigenvalues cannot be found directly. However, the leading eigenvectors (those with the largest eigenvalues) can be found through iteratively applying the operator, i.e. integrating over multiple periods. Here, the leading eigenvectors and eigenvalues are found using Arnoldi iteration.
These leading eigenvalues are the most relevant from a stability point of view. Equation (2.4) shows that the eigenvalues can be interpreted as the ratio of the perturbation field from one period to the next. If there is an eigenvalue (here referred to as the Floquet multiplier,
 $\unicode[STIX]{x1D707}_{f}$
) such that
 $|\unicode[STIX]{x1D707}_{f}|>1$
, then the perturbation field is growing from one period to the next, and the base flow is unstable. Hence, the aim of the analysis is to determine for which parameters the base flow is stable (all
 $|\unicode[STIX]{x1D707}_{f}|\leqslant 1$
) or unstable (at least one
 $|\unicode[STIX]{x1D707}_{f}|>1$
). The eigenvector associated with a given eigenvalue is often referred to as a Floquet mode – it is basically the perturbation flow field.
2.3 Problem set-up
The basic problem investigated is that of a circular cylinder immersed in a free stream. The cylinder is rotating at a constant rate about its axis, while simultaneously performing harmonic oscillations in the streamwise direction. Simulations were conducted for flows with constant Reynolds number
 $Re=UD/\unicode[STIX]{x1D708}=100$
and normalized rotation rate
 $\unicode[STIX]{x1D6FC}=\unicode[STIX]{x1D714}D/U=3$
, where
 $U$
is the free stream velocity,
 $D$
is the cylinder diameter,
 $\unicode[STIX]{x1D708}$
is the kinematic viscosity and
 $\unicode[STIX]{x1D714}$
is the rotation rate. The normalized amplitude
 $A_{d}=A/D$
and frequency
 $f_{d}=fD/U$
, where
 $A$
and
 $f$
are the amplitude and frequency of streamwise oscillation respectively, were systematically varied over the ranges
 $0<A_{d}<2.4$
and
 $0.04\leqslant f_{d}\leqslant 0.11$
.
3 Results
3.1 Floquet multiplier spectra
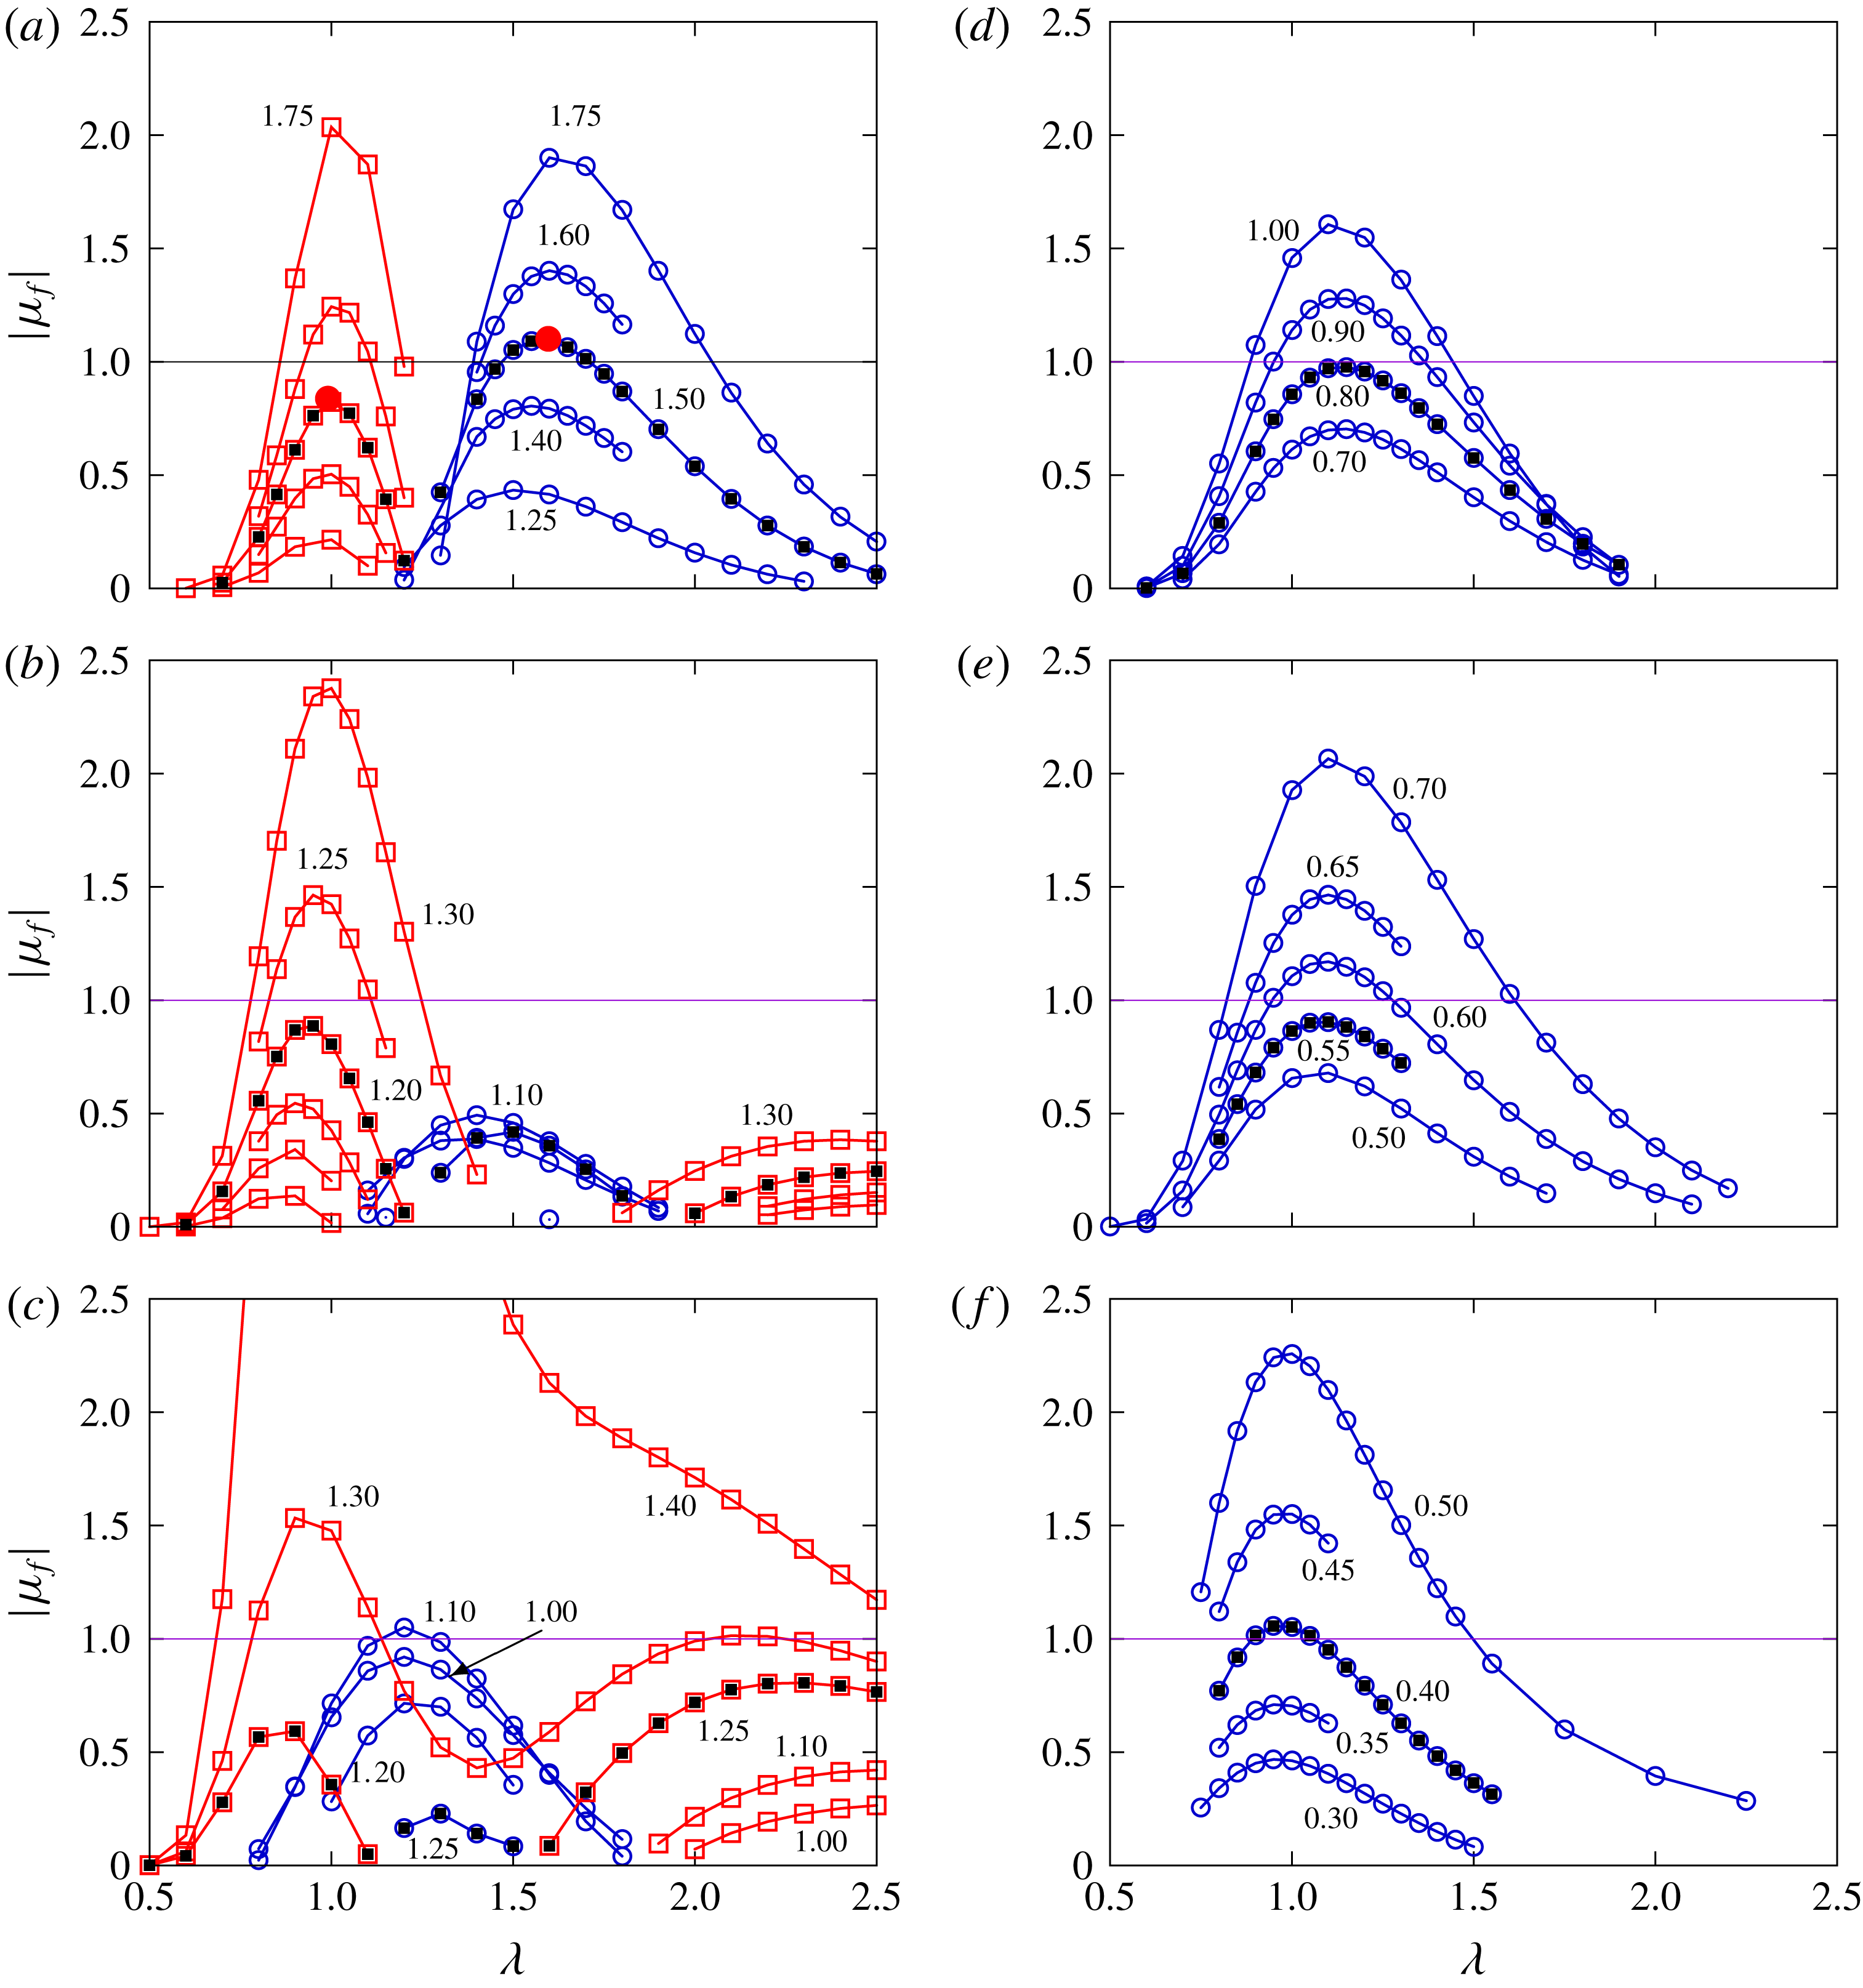
Figure 1 presents the magnitude of the Floquet multiplier,
 $|\unicode[STIX]{x1D707}_{f}|$
, as a function of the spanwise wavelength,
 $\unicode[STIX]{x1D706}$
. Each panel shows data for a single frequency of oscillation, while each line represents data for a constant amplitude. It is clear that for the lower frequencies, there are two clear peaks in these Floquet multiplier spectra. Each peak can be associated with a distinct mode of instability. One of these modes (that focused around the shorter wavelengths and is marked with red lines and points in the figure) has a real, positive Floquet multiplier. The other (marked with blue lines and points in the figure) has a real, negative Floquet multiplier, indicating it is a subharmonic mode which repeats over two oscillations of the body.
As the frequency is increased, the peaks in the spectra for both modes shift towards shorter wavelengths. Typically (except for the case at
 $f_{d}=0.06$
) the subharmonic mode becomes unstable first, i.e. has a Floquet multiplier
 $|\unicode[STIX]{x1D707}_{f}|>1$
at a lower amplitude than the shorter-wavelength mode. However,
 $|\unicode[STIX]{x1D707}_{f}|$
for the shorter-wavelength mode increases very rapidly with amplitude, and if the amplitude is increased beyond the critical point where
 $|\unicode[STIX]{x1D707}_{f}|=1$
, the value of
 $|\unicode[STIX]{x1D707}_{f}|$
for the shorter-wavelength mode quickly exceeds that of the subharmonic mode.
Magnitude of the Floquet multiplier
 $|\unicode[STIX]{x1D707}_{f}|$
as a function of spanwise wavelength
 $\unicode[STIX]{x1D706}$
. Each curve represents a unique value of the amplitude of oscillation
 $A_{d}$
. Each panel contains data for one frequency of oscillation
 $f_{d}$
: (a)
 $f_{d}=0.05$
; (b)
 $f_{d}=0.06$
; (c)
 $f_{d}=0.07$
; (d)
 $f_{d}=0.08$
; (e)
 $f_{d}=0.09$
; (f)
 $f_{d}=0.11$
. Lines and points marked in red represent data for the harmonic mode, those in blue represent data for the subharmonic mode. Filled black points mark a common amplitude for which one of the modes is close to marginally stable. Red points mark example cases shown in figure 2. (a–c) Show that the subharmonic mode is first quenched, then amplified with increasing frequency. Harmonic mode data is not presented for the higher frequencies in (d–f) as the mode is not resolved in the range of wavelengths tested at these frequencies.
3.2 Spatial structure and mechanism of instability of the two modes
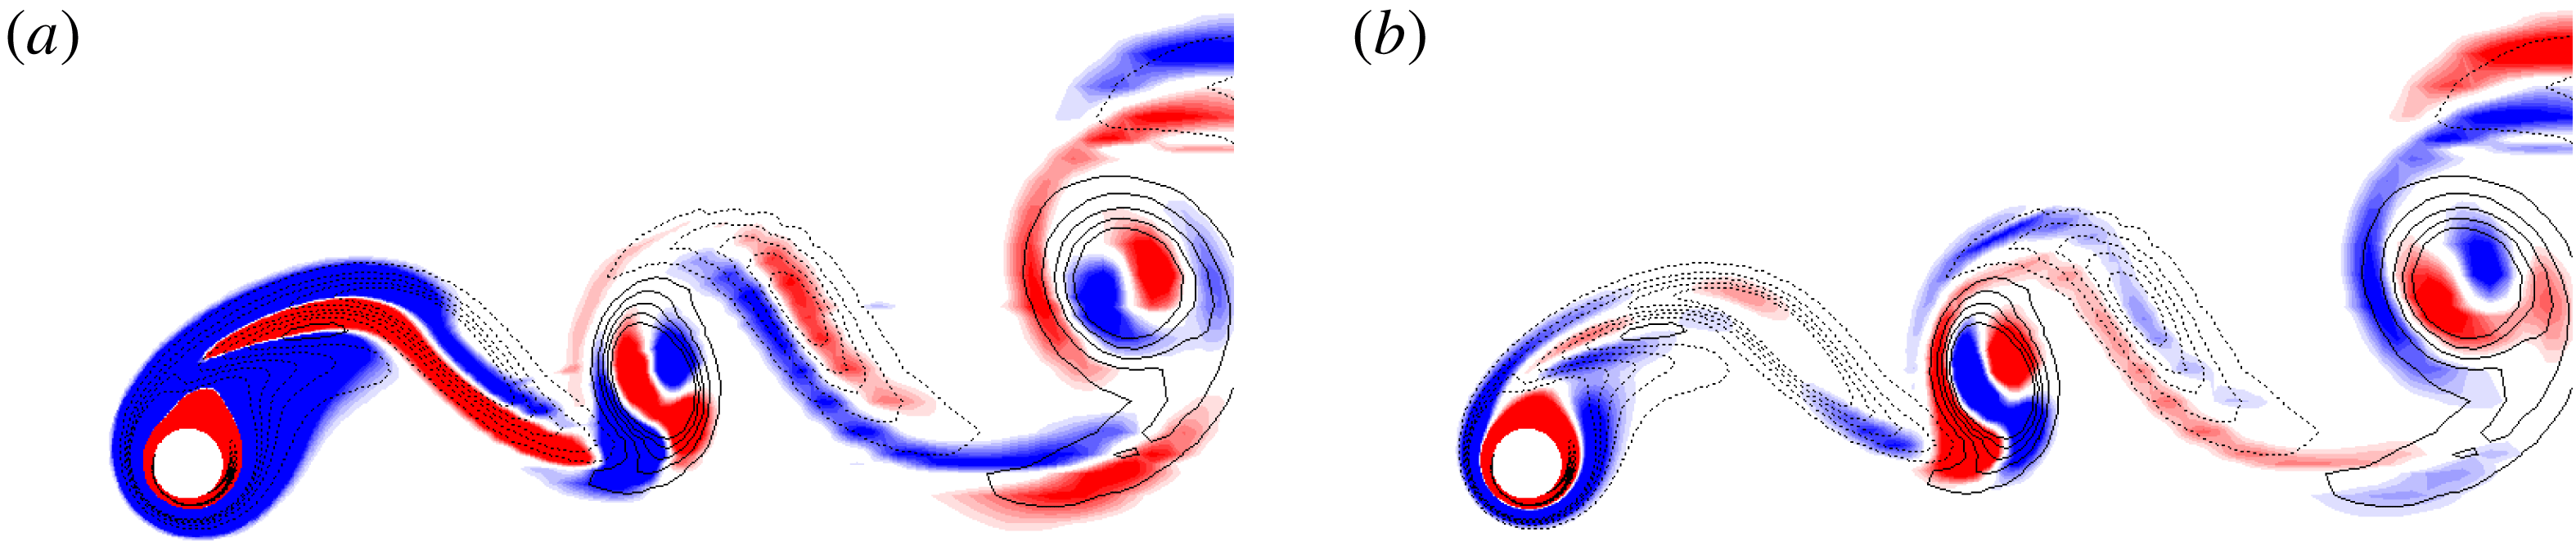
Example instantaneous images of each of the modes are presented in figure 2. The contour lines in the figures represent vorticity of the base flow and the colour contours represent levels of the spanwise vorticity of the perturbation field.
For the shorter-wavelength harmonic mode, the perturbation is focused in the layer of fluid directly adjacent to the body. Together with the closed streamlines around the body, this is taken as evidence that a centrifugal instability mechanism plays a role in the destabilization of this mode.
For the longer-wavelength subharmonic mode, a potential instability mechanism is not as clear. There appears to be some growth very close to the body, again suggesting a centrifugal mechanism. However, the subharmonic nature of the mode suggests some interaction between wake vortices of the same sign separated in time by one period (Yildirim, Rindt & van Steenhoven Reference Yildirim, Rindt and van Steenhoven2013), generated by the break in symmetry of the wake stemming from the body rotation. The low-frequency example image shown in figure 2 supports this idea, with growth of the perturbation in the wake vortices. However, this evidence of growth in the wake vortices is not as clear at higher frequencies. While it seems likely the same cooperative mechanism (i.e. centrifugal instability near the body supplemented by further growth via interaction of wake vortices) exists at the higher frequencies, a definitive conclusion cannot be drawn.
Spatial structure of the two modes. Red/blue colour contours represent positive/negative spanwise vorticity of the perturbation field while solid/dashed contour lines represent positive/negative base flow vorticity. (a) Short-wavelength harmonic mode for wavelength
 $\unicode[STIX]{x1D706}=1.0$
. (b) Longer-wavelength subharmonic mode for wavelength
 $\unicode[STIX]{x1D706}=1.6$
. Amplitude
 $A_{d}=1.5$
and frequency
 $f_{d}=0.05$
in both cases.
(a) The critical amplitude
 $A_{d}^{c}$
for instability for each of the modes as a function of the frequency of oscillation, and (b) the wavelength of the mode at this critical condition. The harmonic mode data are shown in red, the subharmonic mode data are shown in blue. Black points indicate measurements of amplitude, frequency and wavelength taken from fully three-dimensional DNS simulations of the freely vibrating cylinder BL15. The data in (a) show that typically the subharmonic mode becomes unstable at a lower amplitude of oscillation; except in the range
 $0.05<f_{d}<0.07$
, where the harmonic mode becomes unstable first with increasing amplitude. The data in (b) show that the wavelength of the harmonic mode is consistently shorter than the subharmonic mode.

3.3 Critical values of amplitude and wavelength
Figure 3 plots the critical amplitude (the lowest amplitude at which
 $|\unicode[STIX]{x1D707}_{f}|=1$
) and the critical wavelength (the wavelength for which
 $|\unicode[STIX]{x1D707}_{f}|=1$
) for both the harmonic and subharmonic modes as a function of the oscillation frequency
 $f_{d}$
. Figure 3(a) shows that typically, the subharmonic mode becomes unstable at a lower amplitude than the harmonic mode, implying that for amplitudes of oscillation at least up to the critical amplitude,
 $|\unicode[STIX]{x1D707}_{f}|$
for the subharmonic mode is greater than
 $|\unicode[STIX]{x1D707}_{f}|$
for the harmonic mode. The exception to this is in the range
 $0.05<f_{d}<0.07$
, where the harmonic mode is the first to become unstable with increasing amplitude. For comparison with the freely oscillating case, this is important as it might be expected that as the amplitude of the free case develops from zero, the first mode to become unstable will be the mode that will go on to the fully saturated three-dimensional flow. Of course, this is not universal – nonlinear effects that will occur as the amplitude moves further from the critical amplitude could mean the fully saturated flow bears little or no resemblance to the linear mode calculated here. However, if there is a bifurcation sequence leading to the fully saturated flow, the first step in this sequence will be governed by which of the linear modes is unstable first with increasing amplitude, subject to equal projection of the background noise onto the modes.
Figure 3(b) shows that the critical wavelengths of the two modes are typically well separated, and both decrease with increasing frequency. The separation of the wavelengths of the two modes presents an interesting prediction: if there is a situation in the freely oscillating case where the frequency can vary, it may be possible to switch the mode which leads the transition, and this may result in a change in the wavelength of the flow. The comparison below in § 3.4 shows that this is indeed the case.
Around
 $f_{d}=0.06$
, the subharmonic mode is quenched. This is due to the fact that as the amplitude is increased beyond the critical value for the harmonic mode, the growth rate or Floquet multiplier for the harmonic mode increases very rapidly – much more rapidly than the Floquet multiplier for the subharmonic mode. This high sensitivity to the amplitude also supports the idea that this mode is driven by the centrifugal instability of the layer of fluid adjacent to the cylinder. Imagine a perturbation introduced as a wave packet at a location inside the layer of fluid inside the closed streamlines that encircle the body. For the perturbation to grow, this wave packet must grow over the time it takes to make one orbit around the cylinder (Bayly Reference Bayly1988). Therefore, the time scale for the multiplication of this growth rate is the orbit time, which will be similar to the rotation time of the cylinder itself. For the cases tested here,
 $\unicode[STIX]{x1D6FC}=3$
. A frequency of
 $f_{d}=0.06$
gives a period of
 $T=16.66$
, implying the cylinder makes 50 rotations per oscillation cycle. A small increase in the ratio of the perturbation from one rotation to the next therefore results in a huge increase in the ratio of the perturbation from one oscillation to the next.
3.4 Comparison with the freely vibrating case
Here, these controlled oscillation stability results are used to interpret three-dimensional DNS simulation results of a rotating cylinder that is elastically mounted and free to oscillate in the streamwise direction presented by BL15. In this previous study, it was reported that the clear three-dimensional structures were formed, and that there was no clear relationship between the spanwise wavelength of these structures and the frequency, amplitude, or reduced velocity
 $U^{\ast }-U/(f_{n}D)$
, where
 $f_{n}=\sqrt{k/m}/(2\unicode[STIX]{x03C0})$
,
 $k$
is the spring stiffness and
 $m$
is the cylinder mass.
For four values of
 $U^{\ast }=9$
, 11, 15.5 and 23, the amplitude and wavelength measured during the freely oscillating simulations are plotted as a function of the measured response frequency in figure 3. The rotation parameter
 $\unicode[STIX]{x1D6FC}=3$
is the same in the freely oscillating cases and the stability cases presented here. It is clear that the amplitude of the response is just enough to exceed the critical amplitude required for three-dimensional instability. It is also clear that the measured wavelength is reasonably well predicted by the critical wavelength of the first mode to become unstable. A striking feature is the large drop in wavelength measured in the DNS between the cases at
 $f_{d}=0.04$
and
 $f_{d}=0.06$
(
 $U^{\ast }=23$
and
 $U^{\ast }=15.5$
). This corresponds to a change in the first mode to become unstable from the subharmonic mode to the harmonic mode.
This change in mode is also highlighted in figure 4. Space–time diagrams are shown for the DNS simulations, plotting contours of the spanwise velocity as a function of time and spanwise distance
 $z$
, along a line located at
 $(x,y)=(5,0)$
for the same four values of
 $U^{\ast }$
as presented in figure 3. These diagrams show that in the DNS, the only case that repeats on the oscillation period (1-periodic) is that at
 $U^{\ast }=15.5$
– all the others repeat over two cycles, i.e. all the others are subharmonic (2-periodic).
That the change for a 2-periodic to 1-periodic mode is associated with a change in the linear mode leading the instability is supported by the isosurface images of figure 4. Isosurfaces of streamwise vorticity are shown for a case at
 $U^{\ast }=11$
(2-periodic) and
 $U^{\ast }=15.5$
(1-periodic), from the DNS simulations. Plots of the same variable are also shown for two Floquet cases with amplitude and frequency that almost match the DNS cases, where the three-dimensional field has been reconstructed from the leading Floquet mode. The similarity between the flow fields from the DNS and Floquet simulations indicates that the change in leading Floquet mode leads to a change in the structure of the fully saturated three-dimensional flow.
(a) Space–time diagrams taken by recording the spanwise velocity at
 $(x,y)=(5,0)$
over time from the three-dimensional DNS simulations for the four sample cases. Red/blue contours represent positive/negative velocity. The solid line at
 $z=4$
is simply to highlight the behaviour over time at a given spatial location. Only the case at
 $U^{\ast }=15.5$
repeats every period, showing the change from the subharmonic mode to the harmonic mode. (b) Two pairs of images of isosurfaces of
 $\unicode[STIX]{x1D714}_{x}$
at one instant, first for
 $U^{\ast }=11$
and then for
 $U^{\ast }=15.5$
. Each pair consists of an image taken from the three-dimensional DNS simulations and an image reconstructed from the stability calculations at similar amplitude and frequency. Arrows indicate correspondence between the space–time diagram and the isosurface image. These images show the structure of the flow is well predicted by the linear Floquet mode.

Therefore, the lack of any regular relationship between the amplitude, frequency and reduced velocity of the freely oscillating case modelled in the DNS simulations is explained. The wavelength selected in the freely oscillating case is a function of which mode is the first to become unstable, and this is a function of frequency of oscillation.
3.5 Relationship to the non-oscillating rotating cylinder
Rao et al. (Reference Rao, Leontini, Thompson and Hourigan2013) presented an in-depth study of the three-dimensional modes present in the wake of a rotating cylinder that is not oscillating over a range of rotation rates covering the value
 $\unicode[STIX]{x1D6FC}=3$
used in the present study. Due to the low frequencies used here, a comparison with the limiting case of no oscillation is warranted.
However, the two situations – oscillating and non-oscillating – have major differences in flow topology; the primary one being that the oscillating flows here exhibit periodic vortex shedding, and the non-oscillating cases do not. In fact, the non-oscillating cases do not exhibit a traditional wake at all, as the high-speed rotation effectively wraps all the vorticity produced at the cylinder surface around the cylinder, and the flow remains steady. These differences rule out a quasisteady explanation of the oscillating case. Regardless, two modes grow on the steady flow: mode E, a steady–steady bifurcation, with a critical spanwise wavelength of approximately 1.3 for
 $Re=100$
; mode F, a centrifugal instability with a critical wavelength less than 1.
The similarity in wavelength between mode E and the subharmonic mode found here may suggest a similar instability mechanism, which Rao et al. (Reference Rao, Leontini, Thompson and Hourigan2013) conjectures may be a combination of centrifugal and hyperbolic effects. This is plausible in the oscillating case too, and § 3.2 discusses the potential for a cooperative mechanism.
The centrifugal mode F instability is also very similar to the harmonic mode found here. As this mode is an instability of the region of flow enclosed by the streamlines orbiting the cylinder, it is almost unaffected by the vortex shedding in the wake, and hence its appearance in both the oscillating and non-oscillating case is not surprising. Rao et al. (Reference Rao, Leontini, Thompson and Hourigan2013) also presents further evidence in this regard, showing that the trend of critical
 $Re$
for mode F is practically unaffected by the onset of a low-frequency vortex shedding mode at higher rotation rates.
Therefore, while not quantitatively similar, it appears that the instability mechanisms that occur in the non-oscillating case are qualitatively similar to those found here for the oscillating case.
4 Concluding remarks
Floquet stability analysis of a rotating cylinder performing streamwise oscillations in a free stream has been conducted. Two distinct modes, with different wavelengths and distinct mechanisms of instability, have been identified, and both of them can lead the transition to three-dimensional flow. The stability results are used to interpret the measurements of three-dimensional structures in three-dimensional DNS simulations of a rotating cylinder that is freely oscillating in the streamwise direction – the stability results are able to explain that the non-monotonic relationship between the response amplitude, frequency and reduced velocity is due to a change in the linear mode which leads the transition to three-dimensional flow, which is a function of the frequency of oscillation.
Acknowledgements
This work was financially supported by the Australian Research Council Discovery Projects scheme via grant DP150103177. Part of this work was performed using HPC resources from CALMIP (grants 2017-P1248 and 2018-P1248).



