INTRODUCTION
Reconstructing ice flow paths is important for understanding and modeling past ice sheet behavior. The ability to determine ice flow paths is complicated however, in regions where glacial landforms indicating flow direction are absent or buried and moraine systems are complex (Mickelson et al., Reference Mickelson, Clayton, Fullerton and Borns1983; Colgan et al., Reference Colgan, Mickelson and Cutler2003). Because many areas in the Great Lakes region lack well-defined glacial landforms that clearly indicate flow direction for the last glacial maximum (LGM), other methods must be employed. In particular, most of the glaciated region of central Indiana (Tipton till plain) lacks landforms indicating flow direction, therefore analysis of till provenance has been used for reconstructing past ice flow paths.
Local-scale dispersal will result in till composition that reflects regional bedrock whereas continental-scale dispersal (100s km) results in tills with compositions that are more challenging to track back to bedrock sources (Clark, Reference Clark1987). In an ideal system where ice flow direction remains constant, glacial debris concentration in ice decreases exponentially downstream from the bedrock source, dispersing the concentration of debris from the original bedrock source over local (kilometers) to continental scales (100s–1000s km; Clark, Reference Clark1987; Shilts, Reference Shilts1993; Boulton, Reference Boulton1996; Hooke et al., Reference Hooke, Cummings, Lesemann and Sharpe2013; Larson and Mooers, Reference Larson and Mooers2004). The transport distance is controlled by a number of factors including till dynamics, sliding velocities, frictional resistances, basal debris concentration, and erosivity (Clark, Reference Clark1987; Boulton, Reference Boulton1996; Larson and Mooers, Reference Larson and Mooers2004). In regions covered by continental ice sheets, it is generally thought that glacial debris is more likely to be transported at continental scales, resulting in till that reflects bedrock sources up to hundreds of kilometers away (e.g., Clark, Reference Clark1987; Shilts, Reference Shilts1993; Boulton, Reference Boulton1996). Clark (Reference Clark1987) found that dispersal trains from Canadian-sourced ice carried basal debris for several hundred kilometers. However, other studies on continental ice sheet tills have documented much shorter transport distances. For instance, Larson and Mooers (Reference Larson and Mooers2005) found that pigeonite concentrations in Ontario decreased exponentially within 10s of km downstream of the source rock. Shorter transport distances are a result of low sliding velocities, high frictional resistance, high basal debris concentration, and/or proximity to an ice divide (Clark, Reference Clark1987; Boulton, Reference Boulton1996). Boulton (Reference Boulton1996) found that the location of peak concentration may shift depending on glacial dynamics and the retreat rate.
Ice flow-path reconstructions indicate that the ice lobes of the southern Laurentide Ice Sheet extended >500 km from southern Canada to the Great Lakes region (Margold et al., Reference Margold, Stokes and Clark2015a, Reference Margold, Stokes, Clark and Kleman2015b). The Great Lakes region is a complex system as it has been glaciated numerous times (e.g., Mickelson and Colgan, Reference Mickelson and Colgan2003; Curry et al., Reference Curry, Grimley and McKay2011; Syverson and Colgan, Reference Syverson and Colgan2011) and flow paths may not have remained constant during advance and retreat within a glaciation. In addition, sediment can be entrained anywhere the basal conditions are suitable, resulting in spatial and temporal variability of entrainment over long flow paths (Alley et al., Reference Alley, Cuffey, Evenson, Strasser, Lawson and Larson1997). This may result in complex mixing of possible sediment sources (Prest et al., Reference Prest, Donaldson and Mooers2000).
Determining till provenance is one method that can be used to reconstruct past ice flow pathways (e.g., Gwyn and Dreimanis, Reference Gwyn and Dreimanis1979; Dworkin et al., Reference Dworkin, Larson and Monaghan1985; Licht and Palmer, Reference Licht and Palmer2013). The provenance of tills in the Midwest has been studied using a variety of methods across pebble- and sand-size fractions. These studies of mineralogy and petrography link different ice lobes back to possible source areas (Anderson, Reference Anderson1957; Harrison, Reference Harrison1960; Bleuer, Reference Bleuer1975; Gwyn and Dreimanis, Reference Gwyn and Dreimanis1979; Taylor and Faure, Reference Taylor and Faure1981; Dworkin et al., Reference Dworkin, Larson and Monaghan1985; Karls, Reference Karls2005; Coram, Reference Coram2011). Different methodologies have yielded variable, sometimes conflicting, results. Using differences in the concentration and abundances (or absence) of heavy minerals in the fine-sand fraction, Gwyn and Driemanis (1979) and Dworkin et al. (Reference Dworkin, Larson and Monaghan1985) found that heavy mineral concentrations in tills were different between ice lobes in the upper Great Lakes (Lake Michigan Lobe, Huron-Erie Lobe, and Saginaw Lobe). Differences in the abundance of a few key heavy minerals, including clinopyroxene, garnet, epidote, and tremolite, were used to separate the ice lobes in Michigan and link them directly with specific bedrock provenances in the Canadian Shield. Using groupings of these heavy minerals, they showed that Huron-Erie Lobe till in Michigan was derived from a region east of Lake Huron, while Saginaw Lobe and Lake Michigan Lobe tills were derived from a region north of Lake Huron. Similarly, Bleuer (Reference Bleuer1975) noted a distinct difference in the heavy mineral ratio of garnet to epidote in tills in west-central Indiana; Huron-Erie Lobe till has a higher garnet-to-epidote ratio than tills deposited by the Lake Michigan Lobe. Detrital magnetite composition in Huron-Erie Lobe till within eastern Indiana led Karls (Reference Karls2005) to infer that the most likely source for these tills incorporated felsic plutonic and mafic volcanic sources in central Canada, but the grains could be traced only to a rock type and not a specific source region.
In contrast to studies that identify a Canadian Shield source for tills, Harrison (Reference Harrison1960) reported high abundance of mineral and rock fragments of sedimentary rock origin in till collected in central Indiana. This important difference raises the question of how much of the sand-size mineralogy of till is locally derived and how much of it reflects long-distance transport from the Canadian Shield. Similar to Harrison (Reference Harrison1960), clast counts from till in Michigan, Indiana, and Illinois show that, although a significant portion of the till consists of sedimentary rock (>70%), only igneous pebbles were used to determine upstream sources in Canada (Anderson, Reference Anderson1957; Coram, Reference Coram2011). The identification of similar rock types in moraines associated with different ice lobes in these studies may reflect reworking and incorporation of older till into younger deposits. Linking minerals to their source is often more difficult than linking rock fragments, because minerals could be derived from either primary (igneous) or secondary (sedimentary) sources.
Taylor and Faure (Reference Taylor and Faure1981) were the first to report geochronological data to determine provenance in the Great Lakes region. They used Rb-Sr ages of feldspar grains in till to trace Huron-Erie Lobe tills to upstream source regions They assumed that the feldspar grains were directly derived from igneous rocks of the Canadian Shield because most sedimentary rocks do not contain high percentages of feldspar. Because each sample contained a mixture of feldspar grains from source bedrock having different Rb-Sr ages (1070 Ma and 2700 Ma), the resulting “ages” from the till represent a value that is proportional to the relative number of grains in each sample derived from the two source regions. The resulting ages did show an east-to-west increase from 1200 Ma to 1800 Ma from central Ohio to eastern Indiana, respectively. This reflects an increase in the abundance of grains derived from older igneous rocks north of Lake Huron in Canada. Because the Rb-Sr ages obtained through this method reflect the average age of this mixture, the feldspar grains cannot be directly linked to a specific source or region.
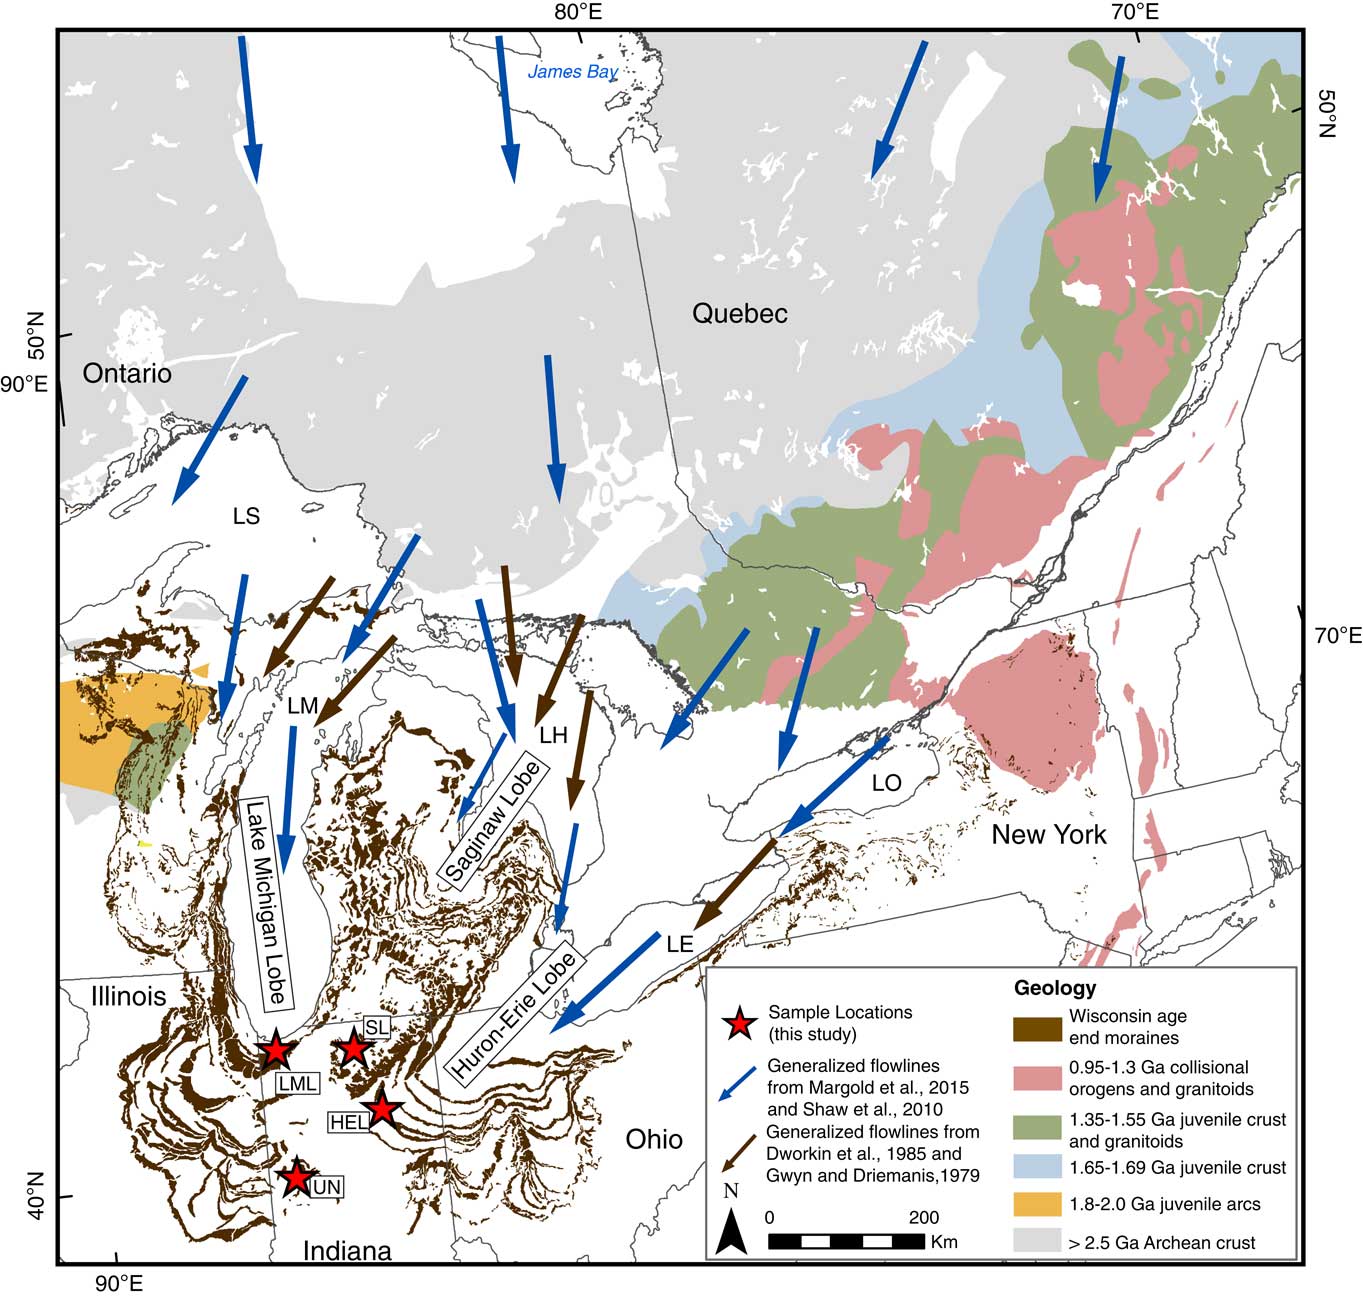
The success of utilizing detrital zircon U-Pb geochronology to constrain the provenance of glacial tills in Antarctica (e.g., Palmer et al., Reference Palmer, Licht, Swope and Hemming2012; Licht and Palmer, Reference Licht and Palmer2013; Licht et al., Reference Licht, Hennessy and Welke2014) led us to develop a pilot study to test the applicability of zircon ages as source indicators of glacial deposits in Indiana. We evaluated the idea that tills from each glacial lobe have a distinct detrital zircon age signature that can be traced to various igneous bodies in the Canadian Shield, the nearest primary sources of igneous zircons (Fig. 1; Shaw et al., Reference Shaw, Sharpe, Harris, Lemkow and Pehleman2010; Margold et al., Reference Margold, Stokes and Clark2015a, Reference Margold, Stokes, Clark and Kleman2015b). Igneous rocks of the Canadian Shield can broadly be characterized by age: >2500 Ma, 1700–1650 Ma, 1600–1300 Ma, and 1300–950 Ma (Fig. 1). Based on the ice flow reconstructions, we hypothesized that the Huron-Erie Lobe would contain dominantly 1300–950 Ma detrital zircon ages, and the Lake Michigan Lobe would contain dominantly >2500 Ma zircons. Because the Saginaw Lobe originated over igneous bodies of both ages, the detrital zircons should record a mixture of ages.
Map illustrating potential igneous bedrock sources for the zircons in this study. Extent of igneous rocks is based on Whitmeyer and Karlstrom (Reference Whitmeyer and Karlstrom2007). Blue arrows are ice flow lines adapted from Margold et al. (Reference Margold, Stokes, Clark and Kleman2015b) and Shaw et al. (Reference Shaw, Sharpe, Harris, Lemkow and Pehleman2010). Black arrows are ice flow lines adapted from Dworkin et al. (Reference Dworkin, Larson and Monaghan1985) and Gwyn and Driemanis (Reference Gwyn and Dreimanis1979). Brown polygons are mapped moraines from Farrand et al. (Reference Farrand, Mickelson, Cowan, Goebel, Richmond and Fullerton1983), Fullerton et al. (Reference Fullerton, Cowan, Sevon, Goldthwait, Farrand, Muller, Behling, Stravers and Richmond1983, Reference Fullerton, Sevon, Muller, Judson, Black, Wagner, Hartshorn, Chapman and Cowan1992), Gadd et al. (Reference Gadd, Veillette, Fullerton, Wagner and Chapman1993), Gray et al. (Reference Gray, Bleuer, Lineback, Swadley, Richmond, Miller, Goldthwait and Ward1991), Lineback et al. (Reference Lineback, Bleuer, Mickelson, Farrand and Goldthwait1983), Richmond et al. (Reference Richmond, Fullerton, Christiansen, Howard, Behling, Wheeler and Daniels1991), Sado et al. (Reference Sado, Fullerton, Baker and Farrand1993, Reference Sado, Fullerton and Farrand1994). Red stars identify the sample locations for this study, Huron Erie Lobe (HEL), Saginaw Lobe (SL), Lake Michigan Lobe (LML), and ‘unknown’ (UN). LE, Lake Erie; LH, Lake Huron; LM, Lake Michigan; LO, Lake Ontario; LS, Lake Superior. (For interpretation of the references to color in this figure legend, the reader is referred to the web version of this article.)

GEOMORPHIC SETTING
Upwards of 200 m of glacial till covers the Great Lakes region, deposited as the Laurentide Ice Sheet advanced and retreated in the region over many glacial cycles (e.g., Wayne, Reference Wayne1956; Mickelson and Colgan, Reference Mickelson and Colgan2003; Curry et al., Reference Curry, Grimley and McKay2011; Esch, Reference Esch2011; Syverson and Colgan, Reference Syverson and Colgan2011). Individual till units rarely exceed 5 m and in many places till sheets are separated by a paleosol or outwash deposit that marks distinct retreat and re-advance episodes (e.g., Gooding, Reference Gooding1975; Hall and Anderson, Reference Hall and Anderson2000, Reference Hall and Anderson2001). The Huron-Erie Lobe, Saginaw Lobe, and Lake Michigan Lobe advanced over Indiana asynchronously during the last glaciation, reaching their maximum extent prior to 23 14C ka BP and retreating out of the region by 14 14C ka BP (Dyke et al., Reference Dyke, Andrews, Clark, England, Miller, Shaw and Veillette2002; Glover et al., Reference Glover, Lowell, Wiles, Pair, Applegate and Hajdas2011). Ice flow reconstructions have the Lake Michigan Lobe flowing through Lake Michigan and extending into northwestern and west-central Indiana, the Saginaw Lobe flowing through central Michigan into northern Indiana, and the Huron-Erie Lobe flowing from Lake Huron and Lake Erie into northeastern Indiana, extending as far south as central Indiana (Fig. 1; Leverett and Taylor, Reference Leverett and Taylor1915; Mickelson and Colgan, Reference Mickelson and Colgan2003; Margold et al., Reference Margold, Stokes and Clark2015a). A series of distinct moraines outline the extent of ice advance in northern Indiana. However, in west-central Indiana, the lobe that deposited the uppermost till is ambiguous because much of the land is part of the low-relief Tipton till plain, lacking well-defined moraines (Colgan et al., Reference Colgan, Mickelson and Cutler2003).
SAMPLE SITES AND METHODS
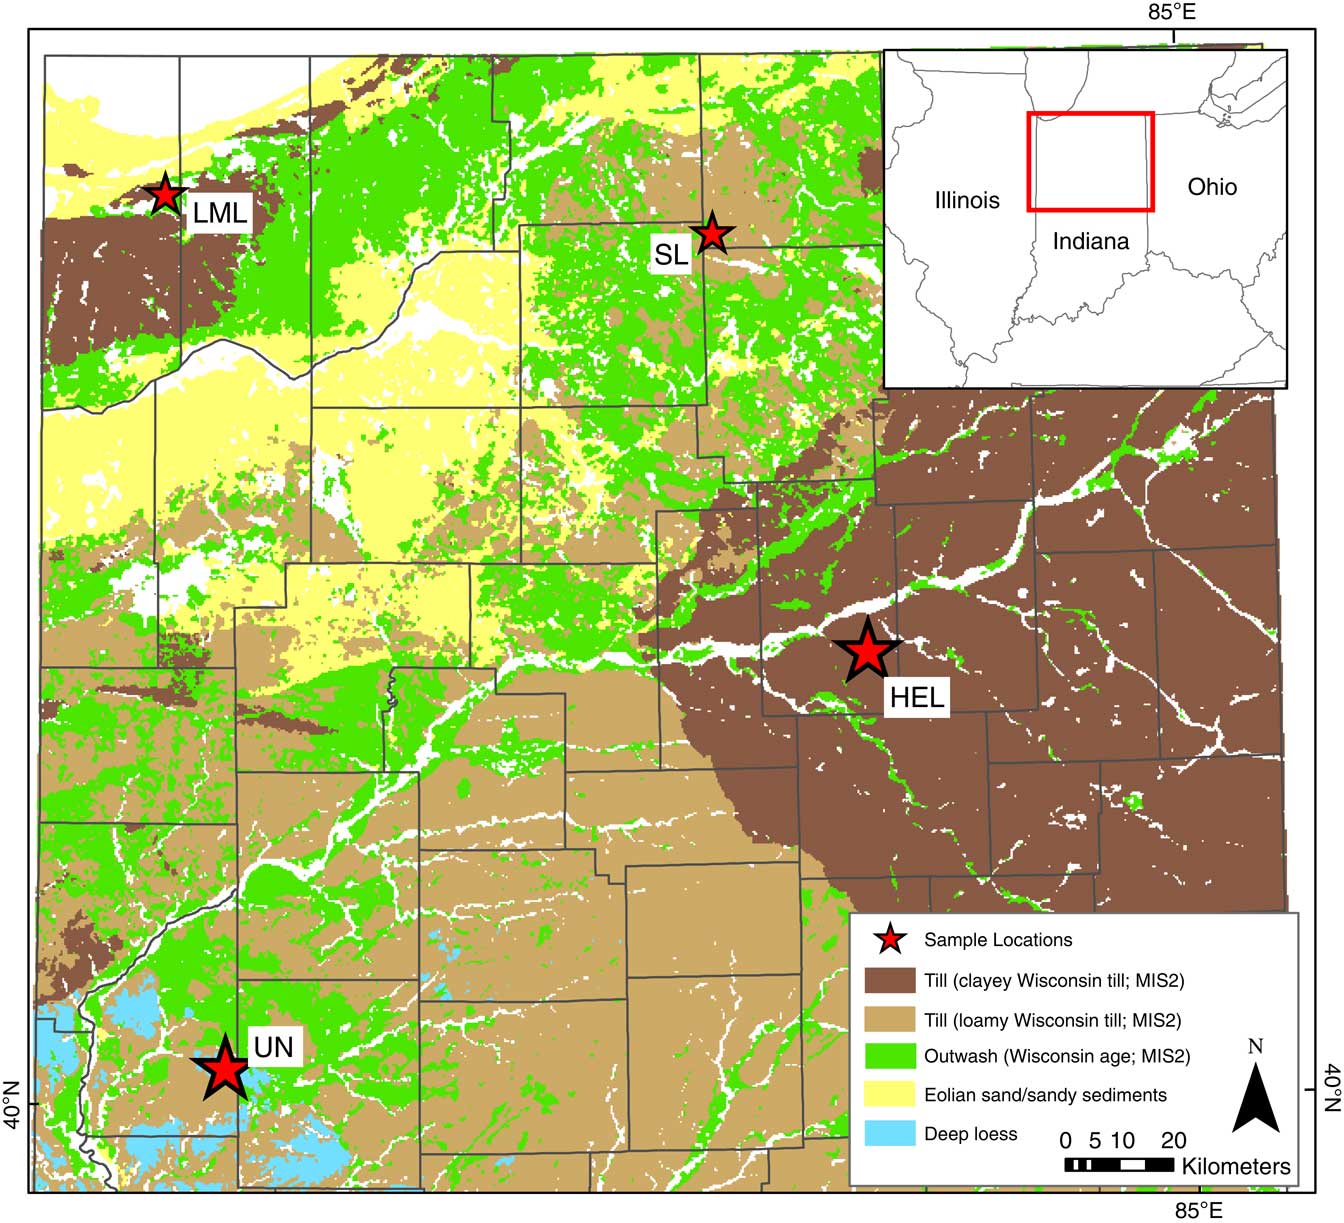
Three sampling sites in this study were selected because of their unambiguous lobe association. They include the Valparaiso moraine of the Lake Michigan Lobe (LML), the Mississinewa moraine of the Huron-Erie Lobe (HEL), and the Packerton moraine of the Saginaw Lobe (SL). Most moraines were described and named prior to the availability of good topographical data and, therefore, may have been mischaracterized (Leverett and Taylor, Reference Leverett and Taylor1915; Malott, Reference Malott1922). However, we are confident that till at each of the three end-member sites represents sediment transported by a different lobe of the Laurentide Ice Sheet. We selected sample sites on flat, upland areas of moraines, away from drainages, and where Quaternary material is mapped as clayey Wisconsin-age (MIS 2) till (Fig. 2). Because this is a pilot study, only one sampling site was selected for each glacial lobe. The samples may not be time-equivalent but instead represent the some of the youngest deposits in Indiana associated with the retreat of each lobe. Because our primary interest was differentiating potential source areas for each glacial lobe and not how source areas changed over time, the depositional age of each till is not important. Tills near these sample locations have been described previously (e.g., Wayne and Thornbury, Reference Wayne and Thornbury1951; Wayne, Reference Wayne1965, Reference Wayne1967; Gooding, Reference Gooding1973). A fourth sample (UN) was purposefully collected from a location where the ice source was ambiguous; this sample came from Fountain County between the Crawfordsville moraine (associated with Huron-Erie Lobe) and Champaign moraine (associated with Lake Michigan Lobe) (Fig. 2 and Table 1; Fraser, Reference Fraser1993; Wayne, Reference Wayne1965). The UN sample is located in an area that was alternately covered by the Huron-Erie and Lake Michigan Lobes (Fraser, Reference Fraser1993), but it is not certain which lobe was the last to cover this specific area, and the age of the moraines is unconstrained.
(color online) Map of sample locations overlain on soil parent material. Soil parent material is based on SSURGO data downloaded from the USDA, Natural Resource Conservation Service. Available online at https://websoilsurvey.nrcs.usda.gov/ [accessed August 16, 2016]. Inset map indicates location of soil parent material map.

Sample information

1 Huron-Erie Lobe.
2 Saginaw Lobe.
3 Lake Michigan Lobe.
4 “Unknown” from Fountain County.
*Coordinate datum is WGS84.
A sample of glacial till (10–50 cm depth) was collected for U-Pb provenance analysis at each site. The till was wet-sieved and the 63–250 μm fraction isolated to extract detrital zircons. Standard gravimetric and magnetic separation techniques for zircon U-Pb analysis were used to isolate the zircon fraction. Zircon grains, both standards and unknowns, were mounted in epoxy pucks and polished to expose the grains. Standards used include Plesovice and FC-1 for age correction and NIST 612 was used for instrument calibration. Each sample was imaged with cathode luminescence to characterize grain shape and to aid in avoiding inclusions, cracks, or regions of zonation that may produce unreliable ages. Unknown zircon grains were dated by LA-ICPMS U-Pb methods in the Geoanalytical Lab at Washington State University using a New Wave Nd:YAG UV 213 nm laser coupled to a ThermoFinnigan Element 2 single-collector double-focusing magnetic sector following methods described in Gaschnig et al. (Reference Gaschnig, Vervoort, Lewis and Tikoff2013). Only those grains with<10% discordance were retained for statistical analyses. Best ages were selected by using the 206Pb/238U age for all grains younger than 1000 Ma and the 206Pb/207Pb age for all grains older than 1000 Ma. Full results are included in the supplementary data.
Ages from each sample were broken down into the following ranges to simplify comparison between samples: >2500 Ma, 2500–2000 Ma, 2000–1800 Ma, 1800–1700 Ma, 1700–1600 Ma, 1600–1300 Ma, 1300–950 Ma, and<950 Ma. These ranges are based on known geological events outlined in Whitmeyer and Karlstrom (Reference Whitmeyer and Karlstrom2007). Analysis of the zircon ages was conducted using published statistical methods including the Kolmogorov-Smirnoff (K-S) test, degree of similarity, degree of overlap, and degree of likeness. Each method compares the four age populations to each other to calculate how alike (or different) they are. The K-S test is used to determine the probability that two samples were derived from different populations and is dependent on the maximum probability difference between two cumulative distribution function curves (Guynn and Gehrels, Reference Guynn and Gehrels2010). Samples having P values less than 0.05 indicate that it is likely that the two populations were derived from different sources. The degree of overlap and degree of similarity measure the degree to which two age probabilities overlap and whether the proportions of overlapping ages are similar, respectively. The closer the value is to 1, the more alike the samples are (Gehrels, Reference Gehrels2000; Satkoski et al., Reference Satkoski, Wilkinson, Hietpas and Samson2013). The degree of likeness calculates the percentage of sameness between two age distributions. The closer the value to 100%, the more alike the samples are (Satkoski et al., Reference Satkoski, Wilkinson, Hietpas and Samson2013).
Based on the a priori assumption that zircon grains were derived from primary bedrock sources, age distributions were adjusted by taking into account the zircon fertility factor (ZFF). Previous work (e.g., Moecher and Samson, Reference Moecher and Samson2006; Dickinson, Reference Dickinson2008) suggests that 1600–900 Ma zircons are much more prevalent in detrital assemblages than zircons of other ages owing to the higher zirconium content in the plutonic bedrock in North America. For most plutonic sources, the ZFF is approximately 1.0, but for 1600–1300 Ma and 1300–900 Ma zircon grains, the ZFFs are 2.5 and 3.5, respectively (Dickinson, Reference Dickinson2008). When adjusting the percentage of grains that fall within specific age ranges for the ZFF, the percentage of grains was interpreted as the number of grains out of 100 grains. This number was then divided by the ZFF values. This results in a lower number of grains within the 1600–1300 Ma and 1300–900 Ma age ranges, reducing the apparent n=value. A new percentage of grains within each age range was then calculated by totaling up the number of grains within the sample after the ZFF was applied and dividing the number of grains adjusted for the ZFF within each age range by the new total number of grains. The ZFF adjusted dataset is strictly used for a comparison of percentage of grains that fall within a specific age range. All of the statistical analyses described in the previous paragraph were calculated using the original dataset of grain ages and associated errors.
RESULTS
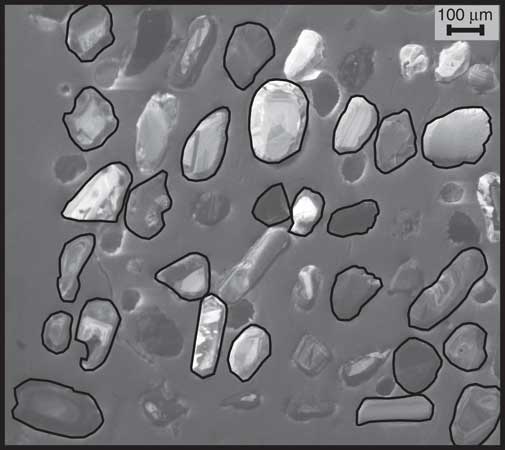
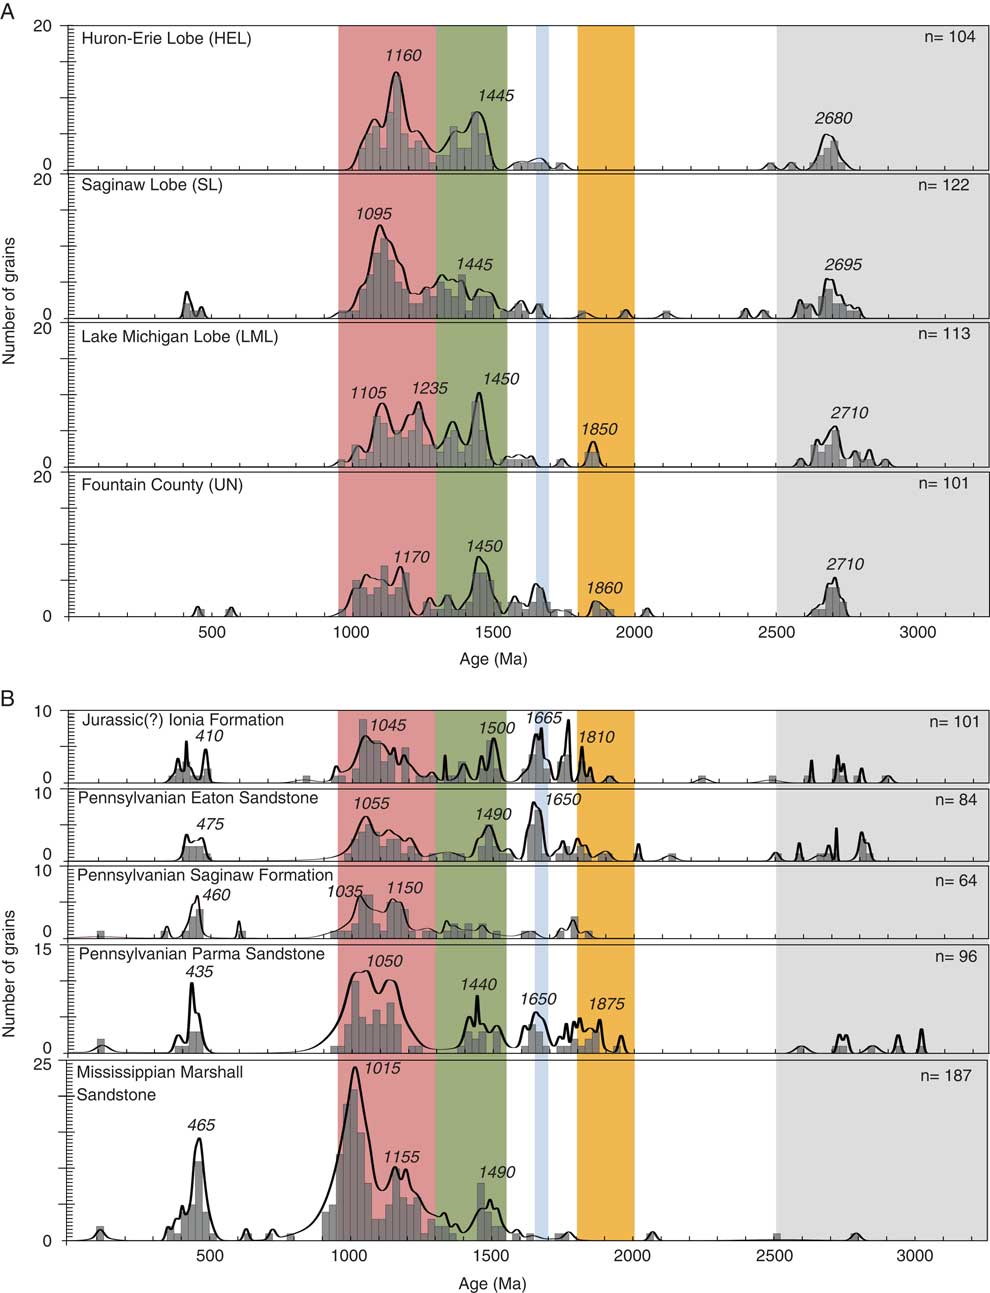
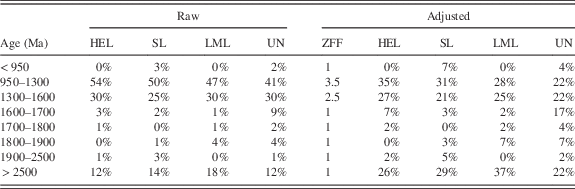
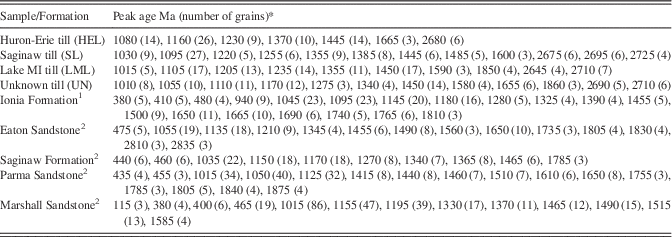
Cathode luminescence imagery of the zircon pucks illustrates that >95% of the grains are rounded and lack well-defined prismatic tips (Fig. 3). There is no age difference between rounded and non-rounded grains. A total of 426 detrital zircon grains were analyzed from the four samples, yielding ages that range from 3100–400 Ma (Fig. 4). Eight age ranges (Table 2), based on known age ranges of igneous and metamorphic rocks upstream (Whitmeyer and Karlstrom, Reference Whitmeyer and Karlstrom2007), are used to group the zircon ages within each sample. The following percentages are based on the dataset prior to applying the ZFF. Greater than 70% of the grains in each sample fall between 1600–950 Ma, within two of the pre-selected ranges. The HEL sample has the greatest percentage of grains within this age range (84%), and the UN sample has the least (71%). Even though the majority of grains fall within this age range, the distribution of ages for each sample differs. HEL and UN have a bimodal distribution of ages within the 1600–950 Ma age range (Fig. 4). The two age peaks which define the bimodal distribution, calculated using AgePick (University of Arizona Laserchron) are similar between these two samples, at 1445 Ma and 1155 Ma. This difference is well beyond the measurement error of 10–20 Ma (Table 3). SL has a unimodal distribution and a broadly distributed set of grains 1600–1300 Ma, whereas LML has three relatively equal age peaks (Fig. 4). The youngest peak age is 1095 Ma for the SL sample and 1105 Ma for the LML sample, which are essentially indistinguishable given the analytical errors on measured values. The LML sample also has two other significant peaks at 1235 Ma and 1450 Ma. This older peak is similar to the second peak in the HEL and UN samples. Approximately 10–20% of grains in all four samples are >2500 Ma, with peak ages between 2710–2680 Ma. The SL and UN samples also have a few grains scattered between 400–600 Ma; grains this age are not present in the HEL and LML samples. All four samples have a few grains scattered between 2500–1600 Ma, but only the LML and UN samples have enough grains with overlapping ages to produce peak ages, around 1850 Ma.
Cathode luminescence image of small subset of grains from SL sample. Grains dated in this analysis are outlined. Most grains do not exhibit prismatic, euhedral zircon shapes, but instead are subangular to subrounded.

Probability density plots of the (A) 4 till samples and (B) bedrock samples from the Michigan Basin. Peaks calculated using the Arizona Laserchron Lab AgePick program are located in Table 3; only prominent peaks are included in this figure. Colors highlight the different age ranges that the data is broken down into and match the colors in Figure 1. Bedrock sample data is from Dickinson et al. (Reference Dickinson, Gehrels and Marzoil2010) and Boothroyd (Reference Boothroyd2012). (For interpretation of the references to color in this figure legend, the reader is referred to the web version of this article.)

Percentage of grains within each age group raw and adjusted by zircon fertility factor (ZFF). HEL, Huron-Erie Lobe; SL, Saginaw Lobe; LML, Lake Michigan Lobe; UN, “Unknown” from Fountain County.

Detrital zircon age peaks for each sample.

1 Data from Dickinson et al. (Reference Dickinson, Gehrels and Marzoil2010).
2 Data from Boothroyd (Reference Boothroyd2012).
*Peak ages calculated using AgePick Excel macro provided by the University of Arizona Laserchron Center.
Applying the zircon fertility factor to the data set shifts the relative dominance of grains within the two main age ranges (1600–950 Ma and >2500 Ma). A zircon fertility factor of 3.5 for grains 1300–950 Ma, 2.5 for grains 1600–1300 Ma, and 1 for all other age ranges (Dickinson, Reference Dickinson2008) results in a decrease in the percentage of grains 1600–1000 Ma from 71–84% to 45–60% and increases the percentage of grains >2500 Ma from 12–18% to 20–40% (Table 2). This effectively decreases the height of the 1600–1000 Ma peaks, making them more comparable to those >2500 Ma.
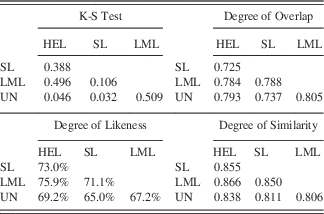
Four different statistical tests used to distinguish whether or not samples were derived from the same populations yield similar results. Each of these tests compares all measured zircon ages (unmodified by ZFF) between two samples at a time. Based on the results of the K-S test, the HEL, SL, and LML samples all have p values >0.05, which supports the conclusion that they were not derived from different populations (Table 4). The three other statistical tests (overlap, similarity, and likeness) also indicate that the three samples are not distinct from each other. All three samples have relatively high degrees of overlap >0.725 and degrees of similarity >0.806. The closer the value is to 1, the higher the degree of overlap and similarity. The degree of likeness varies only from 71–76%, which indicates that the samples are not very distinct.
Results of statistical analyses used to compare the datasets.

DISCUSSION
Detrital zircon geochronology of till is a promising technique to help determine past ice flow paths and identify regions of sediment entrainment by the Laurentide Ice Sheet. This technique, especially when used in combination with other provenance methods, can provide valuable information that reduces uncertainty in interpretations of the provenance of glacial sediments (see method review in Licht and Hemming, Reference Licht and Hemming2017). This pilot study represents the first attempt at applying the technique to Midwestern tills and, although it cannot be considered a comprehensive analysis because of the small number of samples, it serves as a starting point to evaluate the potential of the technique in this region. Below, we discuss the likely origin of zircons in the till in an effort to understand the unexpected similarity between samples and then compare the provenance implications to other provenance methods.
Origin of zircon grains
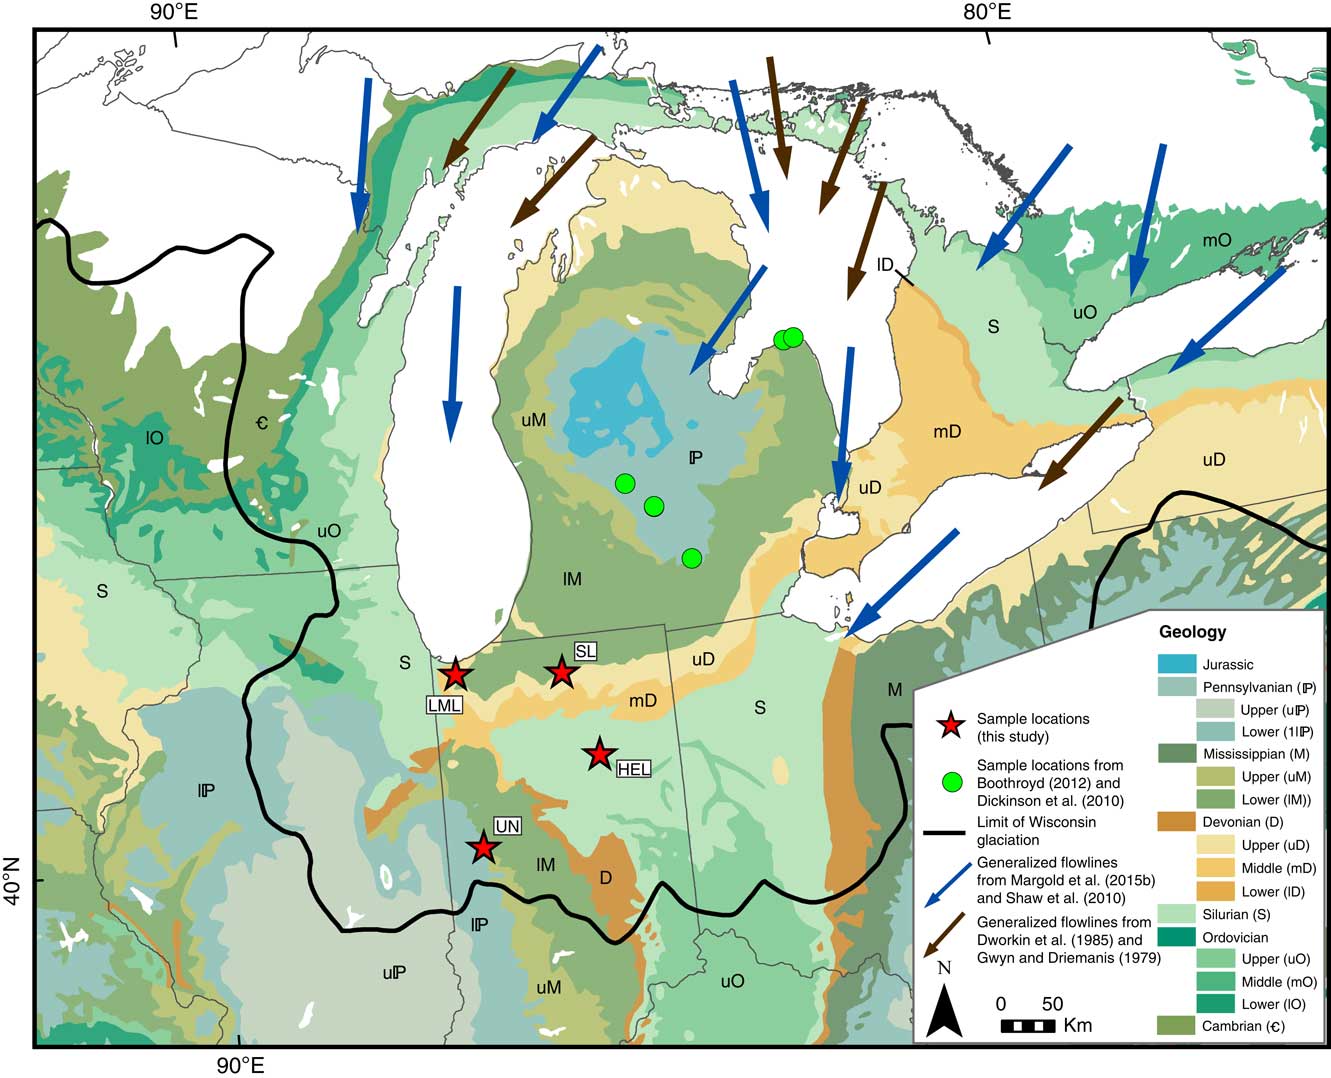
Our study tested the hypothesis that the U-Pb detrital zircon ages in the till samples would be directly related to the upstream bedrock geology not covered by thick Quaternary deposits (i.e., derived from the Canadian Shield). Using this approach, along with LGM flow line reconstructions (Margold et al., Reference Margold, Stokes, Clark and Kleman2015b), the LML sample was expected to be dominated by >2500 Ma age grains, the HEL sample dominated by 1300–950 Ma grains, and the SL sample containing a mixture of both age ranges. As described in the previous section, the measured detrital zircon ages do not support this hypothesis. The dominance of 1600–-950 Ma ages in the LML lobe tills was particularly unexpected because igneous rocks 1600–950 Ma are found only in the eastern part of Canada and are not in the probable flow path of Lake Michigan Lobe ice (Fig. 1). Moreover, a low percentage of grains is derived from igneous rocks >2500 Ma for all three lobes. Bedrock of this age is primarily directly north and upstream of the Lake Michigan Lobe and not in the probable flow path of the other two lobes (Fig. 1). The similar zircon age populations between samples and conflict with flow path reconstructions suggest that the detrital zircons may have been derived from a source other than Precambrian bedrock in the Canadian Shield. One alternative source is Paleozoic sedimentary rock within the Michigan Basin that contains zircon eroded from the Shield (Fig. 5).
Sedimentary bedrock map of the upper Midwest. Data from Garrity and Soller (Reference Garrity and Soller2009). Red stars denote our till sample locations. Green circles are sample locations of Paleozoic bedrock from Boothroyd (Reference Boothroyd2012) and Dickinson et al. (Reference Dickinson, Gehrels and Marzoil2010). The Ionia Formation of Dickinson et al. (Reference Dickinson, Gehrels and Marzoil2010) is possibly Jurassic in age, but does not plot where Jurassic bedrock is exposed on this map. Blue arrows are ice flow lines modified from Margold et al. (Reference Margold, Stokes, Clark and Kleman2015b), and Shaw et al. (Reference Shaw, Sharpe, Harris, Lemkow and Pehleman2010). Black arrows are ice flow lines modified from Dworkin et al. (Reference Dworkin, Larson and Monaghan1985) and Gwyn and Driemanis (Reference Gwyn and Dreimanis1979). LE, Lake Erie; LH, Lake Huron; LM, Lake Michigan; LO, Lake Ontario; LS, Lake Superior. (For interpretation of the references to color in this figure legend, the reader is referred to the web version of this article.)

The Michigan Basin includes Cambrian to Jurassic age rocks deposited in marine and stream/floodplain settings that have a dominant paleocurrent direction from the north/northeast (Potter and Siever, Reference Potter and Siever1956; Siever and Potter, Reference Siever and Potter1956; Potter and Pryor, Reference Potter and Pryor1961; Shideler, Reference Shideler1969). The majority of clastic bedrock exposed in the basin is Devonian and younger, the youngest being of possible Jurassic age. Carbonate rocks are typically devoid of or have a very low abundance of zircons and shale is too fine grained for the size fraction we analyzed, so here we focus on sandstones as possible sources. Sandstones of the Pennsylvanian Saginaw and Mississippian Marshall Formations are primarily located in central Michigan. Outcrops of these formations are not common because they are buried under tens of meters of glacial deposits.
There are a few studies of U-Pb ages of detrital zircon from Michigan Basin rocks that are located directly in the LGM flowline for the Saginaw Lobe (Fig. 5; e.g., Dickinson et al., Reference Dickinson, Gehrels and Marzoil2010; Boothroyd, Reference Boothroyd2012). Bedrock samples from these two studies yield broadly similar detrital zircon age populations as our till samples (Fig. 4). The exact distribution of ages varies between each formation but, in general, 36–70% of grains are 1300–950 Ma and 0–11% >2500 Ma based on the original dataset (Dickinson et al., Reference Dickinson, Gehrels and Marzoil2010; Boothroyd, Reference Boothroyd2012) (Supplementary Table 5). Accounting for ZFF, the distribution of ages 1300–950 Ma decreases to 16–44% and slightly increases to 0–17% for grains >2500 Ma. Because paleocurrent direction is generally from the northeast for these formations, we make a simplifying assumption that the provenance signature is similar across the entire formation. There are a few notable differences between till we measured and these bedrock samples. In the till samples, only a few grains had ages that were<950 Ma, while the bedrock samples contain 10–15% grains<950 Ma. In addition, the till samples had 25–30% of grains 1600–1300 Ma, whereas the bedrock samples contain only 10–15% grains of this age. Statistical comparison of the till and bedrock age distributions indicates there is a degree of similarity between the bedrock and till samples, but there is no exact match (Supplementary Table 6). Apart from the aforementioned differences, the overall similarity in zircon age distributions supports the idea that zircon grains in the till were at least partly derived from the underlying bedrock, rather than directly from the Canadian Shield, especially for the Lake Michigan Lobe till. Further studies of the detrital zircon populations in both Michigan Basin rocks and tills are needed to allow more robust comparisons.
The zircons in the till samples are nearly all rounded, with<1% having retained a euhedral shape (Fig. 3). The high degree of roundness suggests that the grains underwent transport, possibly through multiple cycles of sedimentary transport. Clast composition and sand mineralogy of tills associated with the three ice lobes suggest that sedimentary rocks, especially sandstone, make up a significant percentage of the total clast types (Anderson, Reference Anderson1957; Harrison, Reference Harrison1960; Coram, Reference Coram2011). Of the two likely bedrock sources of zircons in the till, sandstone typically breaks down more rapidly than igneous clasts and, therefore, will contribute more zircons to the sand fraction of the till. Even though the upstream parts of the Lake Michigan and Huron-Erie Lobe catchments may have been located over different ages of igneous bedrock, the zircon age population observed in the tills indicates that zircons from other sources diluted the original zircon population. But, because a thick veneer of glacial till overlies most of the bedrock in Michigan, it may be more likely that the zircons are recycled from older till deposits, which may have been deposited by ice lobes that followed different paths than those of the latest LGM advance. Regardless of the source, bedrock or the underlying till, the samples contain an unexpected distribution of zircon ages, in particular the LML, which contains a surprisingly low proportion of >2500 Ma grains.
Comparison with previous methods
Results from this study indicate that the ice lobes in the Great Lakes either did not follow currently accepted LGM ice flow paths or that tills deposited by the lobes were dominantly derived from Paleozoic bedrock underlying the Michigan Basin. We have no physical basis to suggest the flow paths are erroneous and, therefore, favor the latter interpretation. If this is true, any analyses, including mineralogy and geochronology, must consider a more complex history for these grains, which makes their use for long distance provenance and transport more challenging.
Previous provenance studies suggested that there is enough distinction in the till deposited by lobes covering the Midwest to link them to a source area of the Canadian Shield. In particular, statistical differences in types and weight percent of heavy minerals distinguished the lobes (Gwyn and Dreimanis, Reference Gwyn and Dreimanis1979; Dworkin et al., Reference Dworkin, Larson and Monaghan1985). We note that these studies assumed the heavy minerals in the till were derived directly from igneous source rocks of the Canadian Shield and not from local Paleozoic clastic rocks. Gwyn and Dreimanis (Reference Gwyn and Dreimanis1979) investigated differences between till samples along the southern margin of the Canadian Shield across the width of Ontario, with an emphasis on the 1300–950 Ma and >2500 Ma bedrock provinces. They found that till samples overlying >2500 Ma bedrock are<1% heavy minerals and samples overlying 1300–950 Ma bedrock are >1% heavy minerals and that key differences existed between abundances of the magnetic fraction, tremolite, clinopyroxene, purple and red garnets, epidote, and opaque minerals in tills along the Canadian Shield edge. Dworkin et al. (Reference Dworkin, Larson and Monaghan1985) studied till in southern Michigan and determined that tills from the three lobes (Lake Michigan, Huron-Erie, and Saginaw Lobes) could be differentiated based on heavy mineral composition. They used the results of Gwyn and Dreimanis (Reference Gwyn and Dreimanis1979) to reconstruct flow paths for the lobes, tracing heavy mineral characteristics back to a Canadian Shield source.
The results of our zircon study suggest that the assumption that heavy minerals are exclusively derived directly from Canadian Shield is problematic. Because zircon is also considered a heavy mineral, we assume it would have a similar transport history as the other heavy minerals in the till. For example, if LML till contains only heavy minerals that indicate a >2500 Ma source, then the zircons should also reflect this age. However, a lower proportion of zircon ages are >2500 Ma compared to 1300–950 Ma grains in the LML till. The same is true for the SL sample. Based on the flow lines of Margold et al. (Reference Margold, Stokes, Clark and Kleman2015b) and Shaw et al. (Reference Shaw, Sharpe, Harris, Lemkow and Pehleman2010), ice depositing this till flowed primary over >2500 Ma rocks, yet the detrital zircon signature is dominated by 1300–950 Ma grains. The mixture of detrital zircon ages does not support the same assumption made in previous heavy mineral analysis that the till was derived directly from a Canadian Shield source. Further work must be completed to understand why the heavy minerals and detrital zircon analyses yield different conclusions of till provenance.
Unless there are unique heavy minerals limited to a specific geographic region, it is challenging to trace them back to a specific bedrock source with certainty, based solely on mineral type and abundance. The advantage to using detrital zircon U-Pb geochronology is that it provides both a mineralogical signal and a crystallization age that can be directly linked back to the primary igneous source. This is most straightforward when igneous rocks are the only source of zircons. Recycling of grains from igneous bedrock to younger sedimentary rocks to glacial till can increase the complexity of tracing the grains back to the original erosional source. However, our results quite clearly indicate that grains from local Paleozoic bedrock are a larger contributor to the till than igneous sources of the Canadian Shield.
CONCLUSIONS
We conclude from this pilot study that detrital zircon U-Pb geochronology does not yield unique age signatures for the till samples from three ice lobes in northern Indiana. Overall, all the samples are dominated by 1600–950 Ma grains with a much smaller >2500 Ma component. The age distributions in the tills are similar to age distributions in the underlying Paleozoic bedrock and lead us to the conclusion that it is more likely that the till is primarily being derived from more local Paleozoic bedrock than from igneous rocks further upstream. Although erratics from the Canadian Shield occur in the tills (Coram, Reference Coram2011), our data indicate igneous rocks of the Canadian Shield cannot be the dominant contributor of sediment, at least to the sand size fraction of the tills in Indiana. In order to more fully understand the provenance signals and reconstruct the southern margin of the Laurentide Ice Sheet, data from a variety of provenance methods has to be reconciled keeping in mind the inherent biases in each method. Our conclusions also have implications for understanding transport distances of glacial debris and the recycling of older tills into younger deposits.
A larger data set of tills must be collected to fully test the conclusions reached with this pilot study. Although the detrital zircon age populations of the samples overlap and statistical tests show some similarity, the distribution (bimodal, unimodal, and even) of ages is not identical between the samples. Additional analyses could be used to evaluate whether these patterns are robust and, therefore, useful. In addition, the current sample set represents a single point of each glacial lobe and may not be representative of the glacial lobe as a whole. Increasing the sample set stratigraphically and spatially across each lobe will provide key information on whether detrital zircon ages in till are consistent through time and space for a particular lobe and whether sediment is recycled between successive glacial advances.
ACKNOWLEDGMENTS
Funding for this project was provided by the Indiana University-Purdue University Indianapolis Undergraduate Research Opportunity Program Grant to S. Brickles and by the Indiana Geological Survey. We would like to thank Jeff Vervoort at the Washington State University Geoanalytical Laboratory and Victor Valencia at the University of Idaho for assistance with sample preparation and data production. Discussions with Henry Loope and Todd Thompson were extremely helpful as were comments from two anonymous reviewers.
Supplementary Material
To view supplementary material for this article, please visit https://doi.org/10.1017/qua.2017.71