




No CrossRef data available.
Article contents
Effects of meteorological factors on epidemic malaria in Ethiopia: a statistical modelling approach based on theoretical reasoning
Published online by Cambridge University Press: 13 May 2004
Abstract
This study was conducted to quantify the association between meteorological variables and incidence of Plasmodium falciparum in areas with unstable malaria transmission in Ethiopia. We used morbidity data pertaining to microscopically confirmed cases reported from 35 sites throughout Ethiopia over a period of approximately 6–7 years. A model was developed reflecting biological relationships between meteorological and morbidity variables. A model that included rainfall 2 and 3 months earlier, mean minimum temperature of the previous month and P. falciparum case incidence during the previous month was fitted to morbidity data from the various areas. The model produced similar percentages of over-estimation (19·7% of predictions exceeded twice the observed values) and under-estimation (18·6% were less than half the observed values). Inclusion of maximum temperature did not improve the model. The model performed better in areas with relatively high or low incidence (>85% of the total variance explained) than those with moderate incidence (55–85% of the total variance explained). The study indicated that a dynamic immunity mechanism is needed in a prediction model. The potential usefulness and drawbacks of the modelling approach in studying the weather–malaria relationship are discussed, including a need for mechanisms that can adequately handle temporal variations in immunity to malaria.
Information
- Type
- Research Article
- Information
- Copyright
- 2004 Cambridge University Press
INTRODUCTION
Epidemic malaria remains a major public health concern in highland and arid areas in tropical countries (Lindsay & Martens, 1998; Nájera et al. 1998). Changes in weather conditions have probably played a major role as the cause of most of the severe epidemics. Increased temperature in cooler environments shortens the parasite's life-cycle within the vector, thus increasing transmission probability before the mosquito vector dies (MacDonald, 1957; Molineaux, 1988). Increased temperature would also increase the rate of mosquito emergence from breeding places, and in the presence of rainfall increased humidity results in longer survival of the vector to transmit the parasite (Hay et al. 2000). Rainfall also affects the abundance of mosquito breeding sites.
In the Ethiopian highlands, several large-scale epidemics have been reported since the 1950s. In 1958, an estimated 150000 people died during a widespread epidemic of malaria in the highlands (Fontaine et al. 1961). Several epidemics have been reported since then. Abnormal transmission of unusual proportions has affected the highlands and highland-fringe areas in 1988 and 1991–92 which was associated with abnormally increased minimum temperature (Abeku et al. 2003). More recently, epidemics have occurred in the highlands during the second half of the last decade; in particular a widespread epidemic in 1998 was largely attributed to an El Niño event (unpublished data). The association of abnormal weather conditions and increased malaria incidence has been reported in several studies. In the Punjab province of India, epidemics were shown to be significantly more prevalent in a year with a wet (high) monsoon rainfall following a dry El Niño year than in other years, while in Sri Lanka, epidemics were significantly more prevalent during El Niño years, when the same south-west monsoon tends to fail (Bouma & Van der Kaay, 1996). In Venezuela, malaria significantly increased in the year following an El Niño event (Bouma & Dye, 1997).
Currently there is a need for systems for epidemic early warning in areas at risk (Myers et al. 2000; Thomson & Connor, 2001). Previously, we have demonstrated that incidence in areas with unstable transmission may not be predicted well from historical morbidity patterns alone even when a statistically more sophisticated ARIMA (autoregressive and integrated moving average) method is used (Abeku et al. 2002). In areas with highly variable transmission, the use of predictor variables such as temperature and rainfall together with past patterns of incidence might lead to more accurate predictions.
The aim of this study was to quantify the effects of meteorological factors on malaria incidence in areas with unstable transmission using a statistical model based on theoretical reasoning. On the basis of biological arguments, we derived a linear mixed model for monthly data including rainfall, temperature and incidence of confirmed Plasmodium falciparum cases reported from 35 sites across Ethiopia. We also tested whether extending the model by including more variables would significantly improve the basic model. Moreover, we compared the performance of the basic model with methods that use historical morbidity patterns for studying the impact of weather variables on incidence after one month interval.
MATERIALS AND METHODS
Data used for analysis
We used malaria morbidity data (microscopically confirmed cases) reported from 35 Sector Malaria Control Offices (SMCOs) throughout Ethiopia between September 1986 and August 1993. A sector is an area delineated for the purpose of malaria control and covers 2–5 districts, each with approximately 75000 to 150000 inhabitants. The malaria cases were seen at Malaria Detection and Treatment Posts (MDTPs) located in catchment areas of SMCOs, which are supposed to report to their respective SMCOs every month. We assumed that among the confirmed cases reported monthly, the majority were diagnosed at malaria laboratories which were based at the SMCOs. Most of the other MDTPs (e.g. health centres, hospitals, etc.) irregularly report to SMCOs and when they do, the reports constitute only a small proportion of the total confirmed cases in each sector. Furthermore, in view of the limited modes of transportation in rural areas, it is very likely that most of the malaria cases seen at a sector's malaria laboratory originated from localities not far away from the base town of the sector.
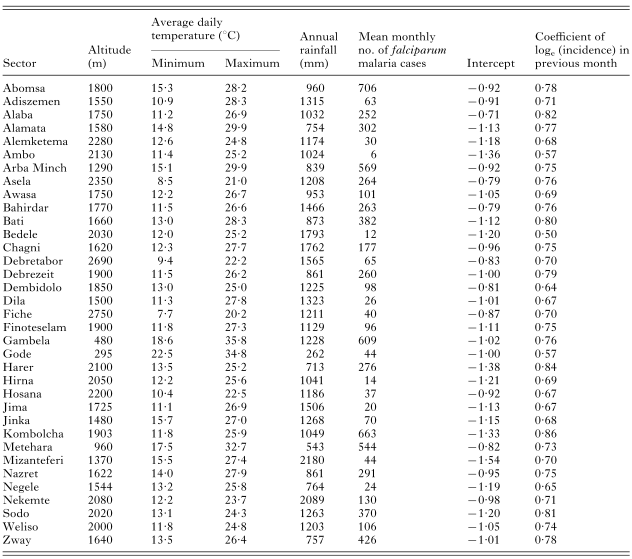
During September 1986–August 1993, on average 320 confirmed malaria cases were reported per sector per month. P. falciparum and P. vivax constituted 68·7% and 31·3% of the total 604589 malaria-positive cases, respectively. To study the seasonal pattern of malaria at different altitudes, the sectors were grouped as ‘highlands’ (above 1750 m, n=18) and ‘lowlands’ (1750 m and below, n=17). Both groups have a similar seasonal pattern of incidence (Fig. 1A) with a peak in P. falciparum incidence in October (P. vivax showed much less inter-seasonal variation). The high degree of seasonality of falciparum malaria is closely associated with seasonal variation in rainfall and temperature. Weather data between January 1950 and December 1998 (monthly rainfall, and minimum and maximum temperatures) and altitudes of base towns of the SMCOs were obtained from the National Meteorological Services Agency of Ethiopia (Table 1). In most areas, the main rainy season is between June and September with peak rains falling in July and August (Fig. 1B). On average, the highland sectors received more rainfall than did the lowlands. Average daily temperature in the highlands ranged from 17·1 °C in December to 19·5 °C in April, whereas in the lowlands, it ranged from 20·7 °C in December to 30·6 °C in March. Mean monthly minimum and maximum temperatures differed (as expected) between highlands and lowlands (Fig. 1C). Minimum and maximum temperatures also show different patterns of seasonal variation. During the rainy months, maximum temperature declines while minimum temperature remains unchanged. After September, minimum temperature gradually falls to a minimum value in December, while, in contrast, maximum temperature increased after September to a peak in March.

Fig. 1. Seasonal variations in (A) incidence of Plasmodium falciparum and P. vivax malaria, (B) rainfall and (C) temperature, in ‘highlands’ (>1750 m) and ‘lowlands’ ([les ]1750 m) in Ethiopia.
Data transformation and imputation
To obtain approximate Normal distribution, log and cube-root transformations were applied to incidence and rainfall data, respectively. Monthly minimum and maximum temperature data were assumed to have Normal distribution. Prior to log transformation, a value of 1 was added to all monthly number of cases to avoid transformation problem which arises in the case of 0 values.
Before fitting models, missing values of rainfall and temperature were imputed using linear interpolation (for gaps of up to 5 months) or by taking seasonal average values (for gaps of more than 5 months). The value of a missing data point for month t (i.e. Xt) was estimated as:

where

is the seasonal average (of the transformed series) for the corresponding calendar month, m is the number of missing observations from the last observed value up to time t and n is the lead time to the next observed value in the ‘future’. Of the data points relevant to the basic model (described below), the percentage imputed values of rainfall and minimum temperature were 12·7% and 15·8%, respectively.
Theoretical reasoning
In areas with low malaria endemicity, the number of new malaria cases in month t (denoted as It) can be considered to depend on the number of new cases in the previous month multiplied by the vectorial capacity during the previous month (vectorial capacity is defined as the average number of secondary malaria cases potentially disseminated in a susceptible population by vector mosquitoes per day from a single primary case). This is due to the fact that nearly all newly infected individuals develop clinical illness as a result of lack of immunity. In areas with high endemicity, many people are (partially) immune and (mostly) not clinically ill, but still infectious; only people who lack sufficient immunity would visit health facilities for treatment, and this means that the number of new cases is mainly determined by vectorial capacity in the previous month alone. The minimum generation time (sometimes referred to as the ‘incubation interval – i.e. the duration of a complete gametocyte-to-gametocyte cycle or the time from take-up of gametocytes by the vector until production of gametocytes by the next host after transmission), normally has a length of approximately 1 month in tropical temperatures, and this corresponds to the monthly character of the data used for analysis. These considerations can be generalized in the following equation:

where a and b are area-specific constants, and Ct−1 is vectorial capacity in month t−1. If b is (close to) 0, we have It=aCt−1 as expected in areas with high endemicity. On the other hand, if b is (close to) 1, we have It=aIt−1Ct−1 as expected in areas with low endemicity.
Ct is defined as the product of mosquito density in relation to the human population (Mt) and vectorial capacity per mosquito (Wt) in month t:

We assume Mt depends on rainfall during the previous 2 months and some area-specific constant M, and that there are enough mosquitoes present to generate an infinite number of offspring, whereby the presence of breeding sites is the limiting factor. Rainfall will be represented as amount during a particular month relative to average annual total for each area. Our assumption for taking rainfall relative to the annual total was that absolute rainfall is not so important but the consequences of rainfall in terms of number (and duration) of mosquito breeding sites are important. These consequences differ strongly among areas (depending on vegetation, soil type, presence of rivers, topography etc.) and therefore there cannot be an absolute relationship between rainfall and vector abundance. For example, if absolute rainfall would be used then a doubling of rainfall in a relatively dry area would have relatively little impact, as the difference involved is small. Thus, the effects of this doubling would be underestimated. In a very wet area, these effects would be overestimated. Thus we have:

where Rt−1 and Rt−2 denote rainfall in months t−1 and t−2, respectively, R is an area-specific average annual rainfall, and β1 and β2 are statistical coefficients of rainfall relative to annual total in months t−1 and t−2, respectively, to be estimated from data.
Vectorial capacity per mosquito Wt in eqn (3) was assumed to depend to a large extent on temperature, and was represented by the sum of a linear and a quadratic term of average minimum temperature (T) after a preliminary exploration of the likely effect of temperature; hence, we can write:

where β3 and β4 are statistical coefficients of Tt and Tt2, respectively, to be estimated from data.
At higher temperatures, the sporogonic cycle of the malaria parasite within the mosquito would be shortened, increasing the probability of transmission (as the parasite would be more likely to be transmitted before the mosquito vector dies when the duration of the cycle is shortened). Temperature also has an effect on the length of the aquatic cycle of the mosquito, but in the present model, the effect on the parasite has been emphasized (and thus Mt is assumed to depend entirely on rainfall as described in eqn (4)). In this regard, the effect of rainfall (a factor for mosquito production) was also made to precede that of temperature (a factor that acts on the parasite prior to transmission).
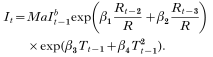
After substitution we get:
Resulting statistical model
After taking (natural) logarithms, eqn (6) can be re-written as a linear mixed model for each sector i as follows:
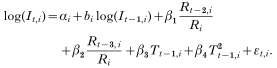
Here αi=log(Mi)+log(ai) denotes the sector-specific intercept, and εt,i is a normally distributed random error with mean 0 and variance σ2. This model describes the area-specific (log) incidence in month t as a function of: (1) (log) incidence in the previous month; (2) rainfall 2 and 3 months earlier; and (3) average minimum temperature in the previous month. In eqn (7), between-sector differences in average incidence and in the effect of previous incidence were accounted for by the random (sector-specific) intercept αi and the slope bi (i.e. parameter of previous incidence). The effects of rainfall and temperature were assumed identical across sectors. Using the MIXED procedure of the SAS/STAT® software of the SAS System Version 8.2 (SAS Institute Inc., Cary, NC 27513, USA), we estimated the intercept αi and the slope bi of log(It−1,i) as sector-specific random effects, and β1, β2, β3 and β4, as fixed effects from the data (SAS Institute, Inc. 1999; Verbeke & Molenberghs, 2000). This procedure can handle problems related to spatial and temporal autocorrelations in the data set during estimation of model coefficients and their variance.
In order to judge the quality of the predictions, the model was also extended to include more meteorological variables at different lags. Likelihood ratio tests were performed to test the goodness-of-fit of the various extensions in comparison to the basic model given in eqn (7). Also, variance as explained was used to reflect the goodness-of-fit per sector. Predictions were considered not good enough if they exceeded twice the observed values (over-estimation) or were less than half the observed values (under-estimation). Gross under-estimation in relation to missing epidemic events which was considered more important than over-estimation was also studied using a threshold value of 200 cases per month per sector, and the results were compared to other simpler models not using weather data, including a simple method using incidence of the previous month as a forecast value for the current month and a seasonal adjustment method that uses values of 3 previous months (Abeku et al. 2002).
RESULTS
The estimates of coefficients in the basic model represented by eqn (7), estimated from data from the 35 sectors, are given in Table 2. All included effects were statistically highly significant except rainfall 3 months earlier which was significant at the 10% level. Area-specific intercepts and incidence in the previous month are given in Table 1. The area-specific effect of incidence in the previous month (i.e. term bi in model (7)) showed little variation between sectors, with a mean of 0·72 (95%CI: 0·69–0·75). Three-quarters of the sectors had values of the coefficient between 0·65 and 0·80.

Observed and predicted values of the basic model are shown in Fig. 2. The model produced similar percentages of over-estimation (19·7%) and under-estimation (18·6%). Especially high incidence values showed a good fit in the model. Detailed analysis of the under-estimation problem showed that about 10% of the observations were under-estimated by more than 200 cases per month, and about 5% were under-estimated by 400 cases per month. It was also found that sectors with normally high and low number of malaria cases had better fits than did sectors with moderate number of cases (Fig. 3). For most areas, the amount of variance in incidence explained by the model exceeded 80%, and for nearly half of the 35 sectors this proportion exceeded 90%. The model performed better in areas with relatively high or low incidence (>85% of the variance explained) than in those with moderate incidence (55–85% of the variance explained).

Fig. 2. Goodness-of-fit of the linear mixed model: observed vs model-predicted values given in number of Plasmodium falciparum cases. Each dot represents a month and a site (n=2067). The diagonal parallel lines indicate prediction values twice observed values (upper line), equal to observed values (middle line) and half the observed values (lower line). (Of the predictions, 19·7% were twice the observed values and 18·6% were less than half of the observed values; furthermore, 10·2% of all observations were grossly underestimated – i.e. greater than 200 cases per month per sector.)

Fig. 3. Goodness-of-fit of the model (measured in R2 values) as a function of mean monthly number of Plasmodium falciparum cases in each sector.
The various extensions of the basic model are given in Table 3 with their respective likelihood ratio tests for goodness-of-fit in comparison to the basic model. In general, there was no significant improvement when maximum temperature was included. Due to the fact that rainfall relative to annual total in the previous month, and the quadratic terms of rainfall relative to annual total 2 months and 3 months earlier significantly improved the model, these factors were used in an extended model which improved the model significantly (Table 3). However, in terms of prediction and percentage under- or over-estimated observations, virtually no improvement was obtained with the various extensions of the basic model, including the extended model.

In terms of percentage of observations grossly under-estimated (>200 cases per month per sector), using the previous month's incidence as a prediction was surprisingly slightly better than the basic model (9·1% vs 10·2%). However, in terms of percentage of ‘not good enough’ predictions, the basic model performed better (38·3%) than the model using previous month's incidence (42·9%) (Table 4). The alternative model based on the seasonal adjustment method was slightly worse than both the basic model and the previous month's incidence prediction (Table 4).
Table 4. Comparison of different models in terms of percentage of ‘unacceptable’ predictions (greater than twice or less than half observed values) and percentage of observations grossly underestimated (i.e. greater than 200 cases per month) (n=2067) (The seasonal adjustment model was based on Abeku et al. (2002).)

DISCUSSION
This study showed an association between monthly meteorological and malaria morbidity data in areas with unstable transmission using a statistical model based on theoretical reasoning. This linear mixed model, which includes rainfall 2 and 3 months earlier and mean minimum temperature in the previous month entered as fixed effects and incidence in previous month entered as a random effect, was fitted to malaria incidence data from 35 areas throughout Ethiopia. The model's fit was generally good especially in areas with high (and to some extent low) monthly incidence.
The model performed relatively poorly in areas with the mean number of cases per month between approximately 50 and 300. This may be due to the fact that only in high and low endemicity areas the immunological status of the population is constant (high and low, respectively). These observations indicate a need to incorporate in a prediction model dynamic or temporally varying immunity levels. Although the model was motivated using immunological arguments and takes account of spatial variations in communal immunity levels across areas, it does not incorporate varying levels of immunity over time, to handle, for example, a consequence of recent outbreaks on incidence. Nevertheless, the developed theory of varying immunity is speculative and needs further study. It should be noted also that incidence and immunity levels interact in such a way that one leads to the other and models for epidemic early warning need to include such interactions. In an attempt to incorporate the level of immunity in forecasting incidence, the spleen rate has been used as a proxy to immunity status of the population in epidemic early warning in India, although this approach did not appear to help in providing an adequate basis for accurate forecast (Swaroop, 1949). In terms of prediction, the present model, however, performed better than our best model that was devised previously based on historical incidence patterns alone (Abeku et al. 2002). This indicates that weather variables are essential components in a model used for epidemic prediction. Potentially confounding factors that affect transmission such as the level of drug resistant P. falciparum and the use of insecticides in malaria control in Ethiopia were ignored in the model, as (simple) prediction was our objective and the role of confounding factors was of less importance than in epidemiological studies of causation.
The 95%CI for the estimates of the coefficient of incidence in the previous month (0·69–0·75) indicated a uniform value for most areas in the country. This is in concordance with the fact that most sectors in Ethiopia have similar endemicity levels. The individual effect of each of the predictor variables was investigated in the present study using model estimates for which the best fit was obtained, while keeping the other variables constant. Increased minimum temperature resulted in increase in incidence up to a threshold limit of approximately 23 °C, after which increase in minimum temperature ceased to have an effect on incidence. Around 14 °C, an increase in minimum temperature of 1 °C resulted in 8% increase in incidence. The exponential effect of rainfall associates with a 3% increase in incidence for every 1% increase in rainfall.
Although more detailed studies are still required to thoroughly understand the impact of meteorological variables in the genesis of epidemics in different areas, it seems that the effect of rainfall varies from sector to sector depending on prevailing temperature and other epidemiological factors. Previously, an inverse relationship was found between rainfall and incidence in southern Ethiopia in drought-associated epidemics due to breeding of vector mosquitoes in pools formed in river beds and streams (unpublished data). Abnormally high rainfall is a causative factor for epidemics in lowlands and fringe areas bordering lowlands. In the cooler highlands, temperature (especially minimum temperature) has a more profound role in determining malaria transmission. A drop in temperature has been shown to be associated with interruption of transmission in the highland sectors of Ethiopia (Abeku et al. 2003). In the hypoendemic highlands, temperature exerts its effect on transmission mainly as the result of shortened sporogonic cycle of the parasite within the vector, and to some extent also by accelerating larval development and frequency of blood feeding by the vector.
In a study conducted in Rwanda, Loevinsohn (1994) showed that changes in malaria incidence at health facilities were significantly associated with rainfall while temperature predicted incidence best at higher altitudes. It was shown that a model that included log of minimum temperature 1 and 2 months earlier, and rainfall 2 and 3 months earlier fitted the health facility data adequately. In our study minimum temperature in the previous month included with its quadratic term usually gave adequate fits in the presence of the previous month's incidence level. Incidence was not included as a predictor variable in the Rwandan study, but in our model we have shown that it is highly significant as a determinant of incidence in the following month. Previously, we have shown that malaria epidemics in Ethiopia were significantly more often preceded by a month of abnormally high minimum temperature in the preceding 3 months than based on random chance (Abeku et al. 2003). In another observation made in Zimbabwe, Freeman & Bradley (1996), reported that rainfall has little effect on severity of malaria (assessed by comparing the numbers of malaria deaths and malaria-inpatients in any one year with respect to those in the preceding years), while temperature has an effect. In Uganda, Kilian et al. (1999) reported the existence of a close correlation between peak of rainfall and peak of malaria incidence with a time lag of 2–3 months between them. In a study conducted in central Ethiopia, Tulu (1996) reported that a rise in monthly mean minimum temperatures 2 and 3 months earlier was the strongest predictor of a rise in incidence. In the present study, the inclusion of minimum temperature of 2 or 3 months earlier did not improve the basic model and the effects were not significant whereas the effect of minimum temperature of the previous month (already in the model) was strongly significant.
To test whether changes in the weather variables have different effects on incidence in highlands and lowlands, we carried out a stratified analysis by dichotomizing altitude into high (>1750 m) and low ([les ]1750 m) and including in the model interaction terms between meteorological and the dichotomized altitude variables. The altitude variable and all the interactions with the weather variables did not have significant coefficients, and the inclusions did not improve the basic model; the main results of the study remained unchanged. This is probably due to either absence of difference in effects of meteorological variables at different altitudes or due to the already included temperature variables in the model as temperature is strongly negatively correlated with altitude, thus indirectly taking account of the effect of altitude.
Climate-based distribution of malaria transmission and infection risk models for Africa has been proposed (Craig, Snow & Le Sueur, 1999) and spatially predictive models have been prepared for epidemic-affected areas of Africa (Cox et al. 1999). The present study has indicated how the association between some meteorological factors and incidence may be modeled in a continuing effort to develop epidemic early warning systems in highland areas for temporal prediction.
Satellite-derived remote sensing (RS) data are potentially useful for monitoring malaria epidemics, although in some cases they may not provide accurate spatial proxies to actual ground meteorological measurements. The relative accuracy of RS and spatial interpolation (SI) of data from meteorological stations has been assessed for the prediction of spatial variation in monthly climate across Africa (Hay & Lennon, 1999). It has been found that SI was a more accurate predictor of temperature, whereas RS provided a better surrogate for rainfall. On the other hand, it has been shown that Normalized Difference Vegetation Index (NDVI) in the previous month correlated consistently with malaria incidence across three sites in Kenya (Hay et al. 1998). Although there is obviously no direct causal link between NDVI and malaria cases to use it as a variable in the current model, the relationships between this and other RS data, ground meteorological records and malaria incidence in the highlands need to be further investigated, for possible use in similar models. A detailed study has been initiated to investigate such relationships with epidemic malaria in four highland districts in Kenya and Uganda, as part of the Highland Malaria Project (HIMAL) (www.himal.uk.net).
The present analysis showed that a statistical model based on theoretical reasoning is a good starting point to understand the role of abnormal weather variables in triggering epidemics in the highlands or highland fringe areas, and that the impact of the effects of these variables in terms of morbidity outcomes may depend on several factors including communal immunity and number of pre-epidemic parasite reservoirs in the population.
Prediction of incidence several months in advance will require major adaptation of the current model, for example, by making use of predicted values of the predictor variables themselves. However, it is anticipated that the accuracy of such prediction would deteriorate after a few months, compared to the (already moderate) performance of one month prediction. Further validation is also needed by fitting the model to new data sets to estimate random effects by using optimal estimates of the fixed parameters. Ways to improve forecasts by making use of past patterns of incidence and other variables and/or by combining seasonality and weighted forecasts of different methods in relation to population immunity levels are currently under investigation. In terms of prediction of malaria incidence using the basic model, although the main contribution comes from the previous month's incidence, the weather parameters included are highly significant and values of their coefficients meet our expectations. Also, we have demonstrated that inclusion of maximum temperature is not important at all. Nevertheless, the study shows that prediction rules derived from simple and straightforward use of monthly weather variables alone might not produce accurate forecasts. In addition, it may be important to study the weather–malaria relationships in some more details using time series of weather, morbidity and entomological variables at intervals of less than a month. The modelling approach used in this study has shown the most important variables that need to be considered in developing a malaria epidemic early warning system in areas where communities are at risk of sudden increase in transmission due to slight changes in the precipitating factors.
We are grateful to the National Meteorological Services Agency and the Ministry of Health of the Federal Democratic Republic of Ethiopia for providing data used for the analyses and for facilitating the study. Financial support for this study was provided by The Trust Fund, Erasmus University Rotterdam, The Netherlands Institute of Health Sciences (NIHES), Gates Malaria Partnership and DfID Malaria Knowledge Programme. S.J.V. received financial support from the Netherlands Foundation for the Advancement of Tropical Research (WOTRO/NWO). Compilation of meteorological data was supported by the United Nations Development Programme (UNDP).
References
REFERENCES
ABEKU, T. A.,
DE VLAS, S. J.,
BORSBOOM, G.,
TEKLEHAIMANOT, A.,
KEBEDE, A.,
OLANA, D.,
VAN OORTMARSSEN, G. J. &
HABBEMA, J. D. F.
(
2002).
Forecasting malaria incidence from historical morbidity patterns in epidemic-prone areas of Ethiopia: a simple seasonal adjustment method performs best.
Tropical Medicine and International Health 7, 851–857.CrossRefGoogle Scholar
ABEKU, T. A.,
VAN OORTMARSSEN, G. J.,
BORSBOOM, G.,
DE VLAS, S. J. &
HABBEMA, J. D. F.
(
2003).
Spatial and temporal variations of malaria epidemic risk in Ethiopia: factors involved and implications.
Acta Tropica 87, 331–340.CrossRefGoogle Scholar
BOUMA, M. J. &
DYE, C.
(
1997).
Cycles of malaria associated with El Niño in Venezuela.
Journal of the American Medical Association 278, 1772–1774.CrossRefGoogle Scholar
BOUMA, M. J. &
VAN DER KAAY, J.
(
1996).
The El Niño Southern Oscillation and the historic malaria epidemics on the Indian subcontinent and Sri Lanka: an early warning system for future epidemics?
Tropical Medicine and International Health 1, 86–96.Google Scholar
COX, J.,
CRAIG, M.,
LE SUEUR, D. &
SHARP, B.
(
1999).
Mapping Malaria Risk in the Highlands of Africa.
MARA/HIMAL Technical Report.
CRAIG, M. H.,
SNOW, R. W. &
LE SUEUR, D.
(
1999).
A climate-based distribution model of malaria transmission in Sub-Saharan Africa.
Parasitology Today 15, 105–111.CrossRefGoogle Scholar
FONTAINE, R. E.,
NAJJAR, A. E. &
PRINCE, J. S.
(
1961).
The 1958 malaria epidemic in Ethiopia.
American Journal of Tropical Medicine and Hygiene 10, 795–803.CrossRefGoogle Scholar
FREEMAN, T. &
BRADLEY, M.
(
1996).
Temperature is predictive of severe malaria years in Zimbabwe.
Transactions of the Royal Society of Tropical Medicine and Hygiene 90, 232.CrossRefGoogle Scholar
HAY, S. I. &
LENNON, J. J.
(
1999).
Deriving meteorological variables across Africa for the study and control of vector-borne diseases: a comparison of remote sensing and spatial interpolation of climate.
Tropical Medicine and International Health 4, 58–71.CrossRefGoogle Scholar
HAY, S. I.,
OMUMBO, J. A.,
CRAIG, M. H. &
SNOW, R. W.
(
2000).
Earth observation, geographic information systems and Plasmodium falciparum malaria in Sub-Saharan Africa.
Advances in Parasitology 47, 173–215.CrossRefGoogle Scholar
HAY, S. I.,
SNOW, R. W. &
ROGERS, D. J.
(
1998).
Predicting malaria seasons in Kenya using multitemporal satellite sensor data.
Transactions of the Royal Society of Tropical Medicine and Hygiene 92, 12–20.CrossRefGoogle Scholar
KILIAN, A. H. D.,
LANGI, P.,
TALISUNA, A. &
KABAGAMBE, G.
(
1999).
Rainfall pattern, El Niño and malaria in Uganda.
Transactions of the Royal Society of Tropical Medicine and Hygiene 93, 22–23.CrossRefGoogle Scholar
LINDSAY, S. W. &
MARTENS, W. J. M.
(
1998).
Malaria in the African highlands: past, present and future.
Bulletin of the World Health Organization 76, 33–45.Google Scholar
LOEVINSOHN, M. E.
(
1994).
Climate warming and increased malaria incidence in Rwanda.
The Lancet 343, 714–718.CrossRefGoogle Scholar
MYERS, M. F.,
ROGERS, D. J.,
COX, J.,
FLAHAULT, A. &
HAY, S.
(
2000).
Forecasting disease risk for increased epidemic preparedness in public health.
Advances in Parasitology 47, 309–330.CrossRefGoogle Scholar
MACDONALD, G.
(
1957).
The Epidemiology and Control of Malaria.
Oxford:
Oxford University Press.
MOLINEAUX, L.
(
1988).
Malaria: the epidemiology of human malaria as an explanation of its distribution, including some implications for control. In
Principle and Practice of Malariology
(
ed. Wernsdorfer, W. H. &
McGregor, I.
), pp. 913–998. Churchill Livingstone, Edinburgh.
NÁJERA, J. A.,
KOUZNETZSOV, R. L. &
DELACOLLETTE, C.
(
1998).
Malaria Epidemics: Detection and Control, Forecasting and Prevention.
World Health Organization document: WHO/MAL/98.1084.
SAS INSTITUTE INC. (
1999).
SAS/STAT® User's Guide, Version 8.
Cary, NC: SAS Institute Inc., USA.
SWAROOP, S.
(
1949).
Forecasting of epidemic malaria in the Punjab, India.
American Journal of Tropical Medicine 29, 1–17.CrossRefGoogle Scholar
THOMSON, M. C. &
CONNOR, S. J.
(
2001).
The development of malaria early warning systems for Africa.
Trends in Parasitology 17, 438–445.CrossRefGoogle Scholar
TULU, A. N.
(
1996).
Determinants of malaria transmission in the highlands of Ethiopia: The impact of global warming on morbidity and mortality ascribed to malaria.
Ph.D. thesis. London School of Hygiene and Tropical Medicine, University of London.
VERBEKE, G. &
MOLENBERGHS, G.
(
2000).
Linear Mixed Models for Longitudinal Data.
New York,
Springer.
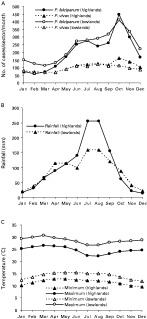
Fig. 1. Seasonal variations in (A) incidence of Plasmodium falciparum and P. vivax malaria, (B) rainfall and (C) temperature, in ‘highlands’ (>1750 m) and ‘lowlands’ ([les ]1750 m) in Ethiopia.
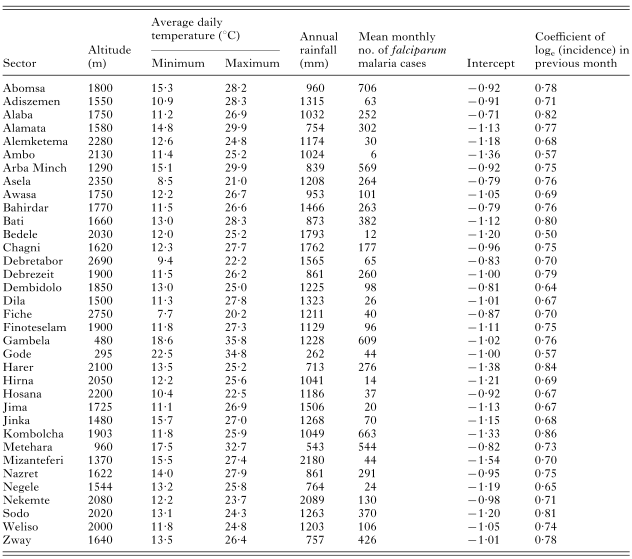
Table 1. Characteristics of the 35 study areas (sectors) and area-specific random effects of the basic linear mixed model fitted to log-transformed Plasmodium falciparum incidence data reported during September 1986–August 1993
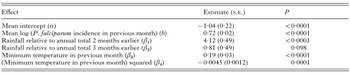
Table 2. Estimates of the fixed parameters of the basic linear mixed model fitted to log-transformed Plasmodium falciparum incidence data reported from 35 sectors in different parts of Ethiopia during September 1986–August 1993
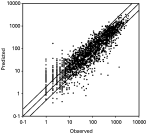
Fig. 2. Goodness-of-fit of the linear mixed model: observed vs model-predicted values given in number of Plasmodium falciparum cases. Each dot represents a month and a site (n=2067). The diagonal parallel lines indicate prediction values twice observed values (upper line), equal to observed values (middle line) and half the observed values (lower line). (Of the predictions, 19·7% were twice the observed values and 18·6% were less than half of the observed values; furthermore, 10·2% of all observations were grossly underestimated – i.e. greater than 200 cases per month per sector.)
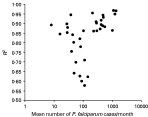
Fig. 3. Goodness-of-fit of the model (measured in R2 values) as a function of mean monthly number of Plasmodium falciparum cases in each sector.
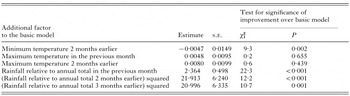
Table 3. Comparison of goodness-of-fit of the basic model to its extensions by adding more predictor variables (n=2067 and −2log likelihood of basic model=5290·1)
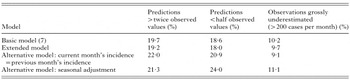
Table 4. Comparison of different models in terms of percentage of ‘unacceptable’ predictions (greater than twice or less than half observed values) and percentage of observations grossly underestimated (i.e. greater than 200 cases per month) (n=2067)
 You have
Access
- 62
- Cited by