1. Introduction
During the evolution of a convergent plate boundary, different types of fold-and-thrust belts (FTBs) are generated, including accretionary prisms and foreland FTBs (e.g. Price, Reference Price, McClay and Price1981; Moore & Silver, Reference Moore and Silver1987; Poblet & Lisle, Reference Poblet, Lisle, Poblet and Lisle2011). In the early collision stage, the toe of the deforming thrust wedge is fully submarine; the associated deepwater sedimentary record is classically termed flysch (Allen et al. Reference Allen, Crampton and Sinclair1991; Sinclair, Reference Sinclair1997). As the foreland basin becomes filled with sediment, depositional environments become shallow marine and continental; these sediments are classically termed molasse (e.g. Sinclair, Reference Sinclair1997; Allen et al. Reference Allen, Burgess, Galewsky and Sinclair2001; Allen & Allen, Reference Allen and Allen2005). In the inner part of mature FTBs, tectonic units related to the early contractional stages can often be recognized. These units were emplaced during the early deepwater stage of collision or possibly during the accretionary prism stage.
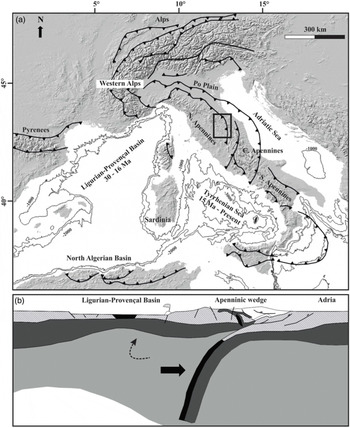
A prime example for the complex, time-dependent tectonostratigraphic evolution of FTBs is the Northern Apennine belt of Italy (Fig. 1). The Northern Apennine belt is presently an emerged FTB, associated with a shallow marine (Northern Adriatic) and a continental (Po Plain) molasse-type foreland basin. The external front of the Northern Apennine FTB is still active, as demonstrated by the presence of compressional seismicity (e.g. Boccaletti et al. Reference Boccaletti, Corti and Martelli2010; Ponza et al. Reference Ponza, Pazzaglia and Piccotti2010; Gunderson et al. Reference Gunderson, Anastasio, Pazzaglia and Picotti2013; Maesano et al. Reference Maesano, Toscani, Burrato, Mirabella, D’Ambrogi and Basili2013, Reference Maesano, D’Ambrogi, Burrato and Toscani2015; Chiarabba et al. Reference Chiarabba, De Gori, Improta, Pio Lucente, Moretti, Govoni, Di Bona, Margheriti, Marchetti and Nardi2014; Martelli et al. Reference Martelli, Santulin, Sani, Tamaro, Bonini, Rebez, Corti and Slejko2017; Maestrelli et al. Reference Maestrelli, Benvenuti, Bonini, Carnicelli, Piccardi and Sani2018) as well as by geodetic global positioning system data (Hunstad et al. Reference Hunstad, Selvaggi, D’Agostino, England, Clarke and Pierozzi2003; Serpelloni et al. Reference Serpelloni, Anzidei, Baldi, Casula and Galvani2005, Reference Serpelloni, Anzidei, Baldi, Casula and Galvani2006; Bennett et al. Reference Bennett, Serpelloni, Hreinsdóttir, Brandon, Buble, Basic, Casale, Cavaliere, Anzidei, Marjonovic, Minelli, Molli and Montanari2012; Devoti et al. Reference Devoti, D’Agostino, Serpelloni, Pietrantonio, Riguzzi, Avallone, Cavaliere, Cheloni, Cecere, D’Ambrosio, Falco, Selvaggi, Métois, Esposito, Sepe, Galvani and Anzidei2017). Within the inner and central parts of the Northern Apennines, diachronous syn-orogenic successions were deposited in E-migrating foreland basins, and emplaced in-sequence either during the accretionary prism stage or during the subsequent early and mature stages of continental collision (e.g. Merla, Reference Merla1951; Ricci Lucchi, Reference Ricci Lucchi, Allen and Homewood1986; Barchi et al. Reference Barchi, Landuzzi, Minelli, Pialli, Vai and Martini2001).
(a) Tectonic setting of the peri-Mediterranean region including the main mountain belts and basins. (b) Section showing the middle Miocene beginning of retreat of the Apenninic subduction zone with transtension in Corsica and Northern Tyrrhenian sea (modified after Molli, Reference Molli, Siegesmund, Fugenschuh and Froitzheim2008).

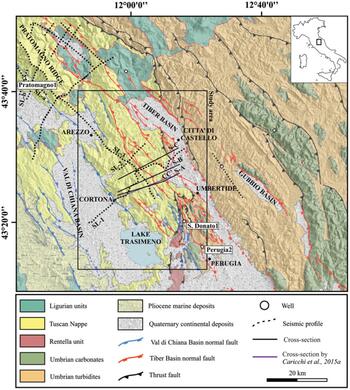
In this framework, our study area is located at the external front of the so-called Tuscan Nappe (e.g. Carmignani et al. Reference Carmignani, Decandia, Disperati, Fantozzi, Kligfield, Lazzarotto, Liotta, Meccheri, Vai and Martini2001; Brogi et al. Reference Brogi, Capezzuoli, Liotta and Meccheri2015), a complex stack of transported (i.e. allochthonous) tectonic units, originally pertaining to the same palaeogeographic (Tuscan) domain, in the inner portion of the Northern Apennines FTB (Fig. 2). In particular, our study focuses on the Trasimeno Tectonic Wedge (TTW), which represents the external, imbricated front of the allochthonous Tuscan units, located in the Trasimeno Lake area. The study area is bounded by two major Pliocene–Quaternary extensional basins, the Val di Chiana Basin to the west and the High Tiber Basin to the east (Fig. 2).
Regional geological scheme reporting the relative position of the stacked units, the main thrusts and normal faults traces, basins, units cropping out, geological cross-sections, wells and seismic traces. Normal faults have two colours: those in blue are related to the Val di Chiana Basin and those in red to the High Tiber Basin (modified after Mirabella et al. Reference Mirabella, Brozzetti, Lupattelli and Barchi2011).

The TTW is a lower Miocene imbricate thrust complex comprising Upper Cretaceous – Tertiary rocks. Due to well-exposed outcrops, the stratigraphy and tectonics of the study area has been intensively studied in the past by many researchers (e.g. Nocchi, Reference Nocchi1961, Reference Nocchi1962; Baldacci et al. Reference Baldacci, Elter, Gianini, Giglia, Lazzarotto, Nardi and Tongiorgi1967; Sestini, Reference Sestini1970; Ricci Lucchi, Reference Ricci Lucchi, Allen and Homewood1986; Abbate & Bruni, Reference Abbate and Bruni1987; Costa et al. Reference Costa, Di Giulio, Negri and Plesi1991, Reference Costa, Di Giulio, Plesi, Villa and Baldini1997; Damiani et al. Reference Damiani, Minelli, Pialli, Pialli, Barchi and Menichetti1991; D’Offizi et al. Reference D’Offizi, Minelli and Pialli1994; Aruta & Pandeli, Reference Aruta and Pandeli1995; Brozzetti et al. Reference Brozzetti, Lucchetti and Pialli2000, Reference Brozzetti, Boncio and Pialli2002; Plesi et al. Reference Plesi, Galli and Daniele2002a, b; Brozzetti, Reference Brozzetti2007; Barsella et al. Reference Barsella, Boscherini, Botti, Meneghini, Motti, Palandri, Marroni and Pandolfi2009). Knowledge of the study area has been significantly increased by several recent studies, including: (1) the publication of new 1:50 000 geological maps in the framework of the Cartografia Geologica (CARG) project (sheets 289, 299 and 310 of the Carta Geologica d’Italia; Pialli et al. Reference Pialli, Plesi, Boscherini, Martini, Damiani, Nocchi, Lucchetti, Rettori, Bucefalo, Negri, Aruta, Bigozzi, Brozzetti, Galli, Daniele, Cardinali, Merangola, Motti, Ridolfi, Tosti and Menichetti2009; Barchi et al. Reference Barchi, Marroni, Barsella, Bizzari, Botti, Meneghini, Pandolfi, Passeri, Pazzaglia, Argenti, Baldanza, Checconi, Ciarapica, Palandri, Venturi, Barsella, Botti, Boscherini, Cenci, Felicioni, Mencaroni, Motti, Natale, Natali, Ponziani, Sorrentino, Simone, Bellucci, Bortoluzzi, Gasperini and Pauselli2010; Plesi et al. Reference Plesi, Damiani, Boscherini, Martini, Lucchetti, Palandri, Rettori, Tuscano, Botti, Daniele, Tosti, Del Gaia, Arcaleni, Galli, Sabatini, Preziosi, Bartoccini and Uffredduzzi2010); (2) geothermometric measures, aimed at defining the wedge thickness and the amount of post-orogenic erosion (Thomson et al. Reference Thomson, Brandon, Reiners, Zattin, Isaacson and Balestrieri2010; Meneghini et al. Reference Meneghini, Botti, Aldega, Boschi, Corrado, Marroni and Pandolfi2012; Caricchi et al. Reference Caricchi, Aldega and Corrado2015a, b); and (3) a palaeomagnetic campaign, constraining the rotation of the vertical axes of the TTW (Caricchi et al. Reference Caricchi, Cifelli, Sagnotti, Sani, Speranza and Mattei2014).
In this study, the subsurface structure of the TTW is investigated by interpreting a previously unpublished set of two-dimensional (2D) seismic reflection profiles acquired in the 1980 s for hydrocarbon exploration purposes, calibrated by deep borehole data from the Pratomagno 1 well (see locations in Fig. 2). Combined with existing knowledge of surface geology, these data provide a comprehensive view of the stratigraphy, internal architecture and tectonic evolution of the TTW. The overall geometry of the thrust complex is synthesized along a WSW–ENE-oriented integrated geological cross-section, 33 km in length, extrapolated down to c. 9 km depth; the kinematic evolution of the tectonic wedge is investigated by a 2D restoration of the integrated section.
The results of this tectonic interpretation and restoration study contribute to a better understanding of the TTW by documenting and discussing: (1) the original wedge geometry before it was uplifted and deeply eroded, and partly dissected by later extensional tectonics; (2) the total amount of shortening and the kinematic relationship between the basal décollement and the internal imbrication; and (3) the mechanics of the wedge.
The tectonic balancing of the TTW provides, within the uncertainty limits, a comprehensive image of the geometry of the Northern Apennines during the early Miocene early continental collision stage. The reconstruction results can be therefore – in a wider perspective – compared with data collected in modern deepwater FTBs worldwide, formed under similar geodynamic conditions. Since the fossil TTW is located onshore and in places well exposed, it forms a paradigmatic field analogue for modern deepwater FTBs.
2. Northern Apennines: regional and geodynamic framework
The Northern Apennines form an orogenic belt that is the backbone of the northern part of the Italian peninsula between the Western Alps and the Central/Southern Apennines (Fig. 1). The theory of the tectonic evolution and the geodynamic scenario of the Northern Apennines is complex and controversial (e.g. Jolivet et al. Reference Jolivet, Faccenna, Goffé, Mattei, Rossetti, Brunet, Fabrizio, Funiciello, Cadet, D’Agostino and Parra1998; Doglioni et al. Reference Doglioni, Gueguen, Harabaglia, Mongelli, Durand, Jolivet, Horvath and Séranne1999; Lavecchia et al. Reference Lavecchia, Boncio, Creati and Brozzetti2003; Molli, Reference Molli, Siegesmund, Fugenschuh and Froitzheim2008). Following Molli (Reference Molli, Siegesmund, Fugenschuh and Froitzheim2008) and Molli & Malavieille (Reference Molli and Malavieille2011), the Northern Apennines evolution can be schematically divided into two major stages with opposite subduction polarity: the first stage (the Alpine Cycle, Late Cretaceous – middle Eocene) is characterized by an E-dipping intraoceanic and then continental subduction of the European–Corsica Plate; the second stage (the Apenninic Cycle, Oligocene – present) is characterized by a W-dipping subduction of the remnant oceanic lithosphere of the late Mesozoic Western Tethys Ocean (i.e. the late Mesozoic ocean separating palaeo-Europe and palaeo-Africa plates) and of the attached, thinned continental crust of Adria. The westwards retreat of the subducting Adria Plate generated the back-arc extension of the Ligurian–Provençal Basin (Oligocene – early Miocene) and, subsequently, back-arc extension of the Tyrrhenian Basin (middle Miocene – present). During the Apenninic Cycle (i.e. since Oligocene time), the eastwards migration of the orogen is marked by the eastwards progressively younger age of the foredeep and the occurrence of piggyback basin deposits, which were subsequently incorporated into the Northern Apennines FTB (e.g. Merla, Reference Merla1951; Ori et al. Reference Ori, Roveri, Vannoni, Allen and Homewood1986; Ricci Lucchi, Reference Ricci Lucchi, Allen and Homewood1986; Barchi et al. Reference Barchi, Landuzzi, Minelli, Pialli, Vai and Martini2001; Casero, Reference Casero and Crescenti2004).
The Northern Apennines comprise a stack of imbricate tectonic units derived from the Mesozoic Tethys Ocean (Ligurian domain) and the adjacent continental passive margin of Adria (Tuscan and Umbria–Marche–Romagna domains) (Fig. 2). Recent reviews of the stratigraphy, structural setting and evolution of the Northern Apennines are provided by Carmignani et al. (Reference Carmignani, Decandia, Disperati, Fantozzi, Kligfield, Lazzarotto, Liotta, Meccheri, Vai and Martini2001) and Molli et al. (Reference Molli, Crispini, Malusà, Mosca, Piana and Federico2010) for the inner Tuscan region, and by Barchi et al. (Reference Barchi, Landuzzi, Minelli, Pialli, Vai and Martini2001) and Barchi (Reference Barchi2010) for the outer Umbria–Marche region.
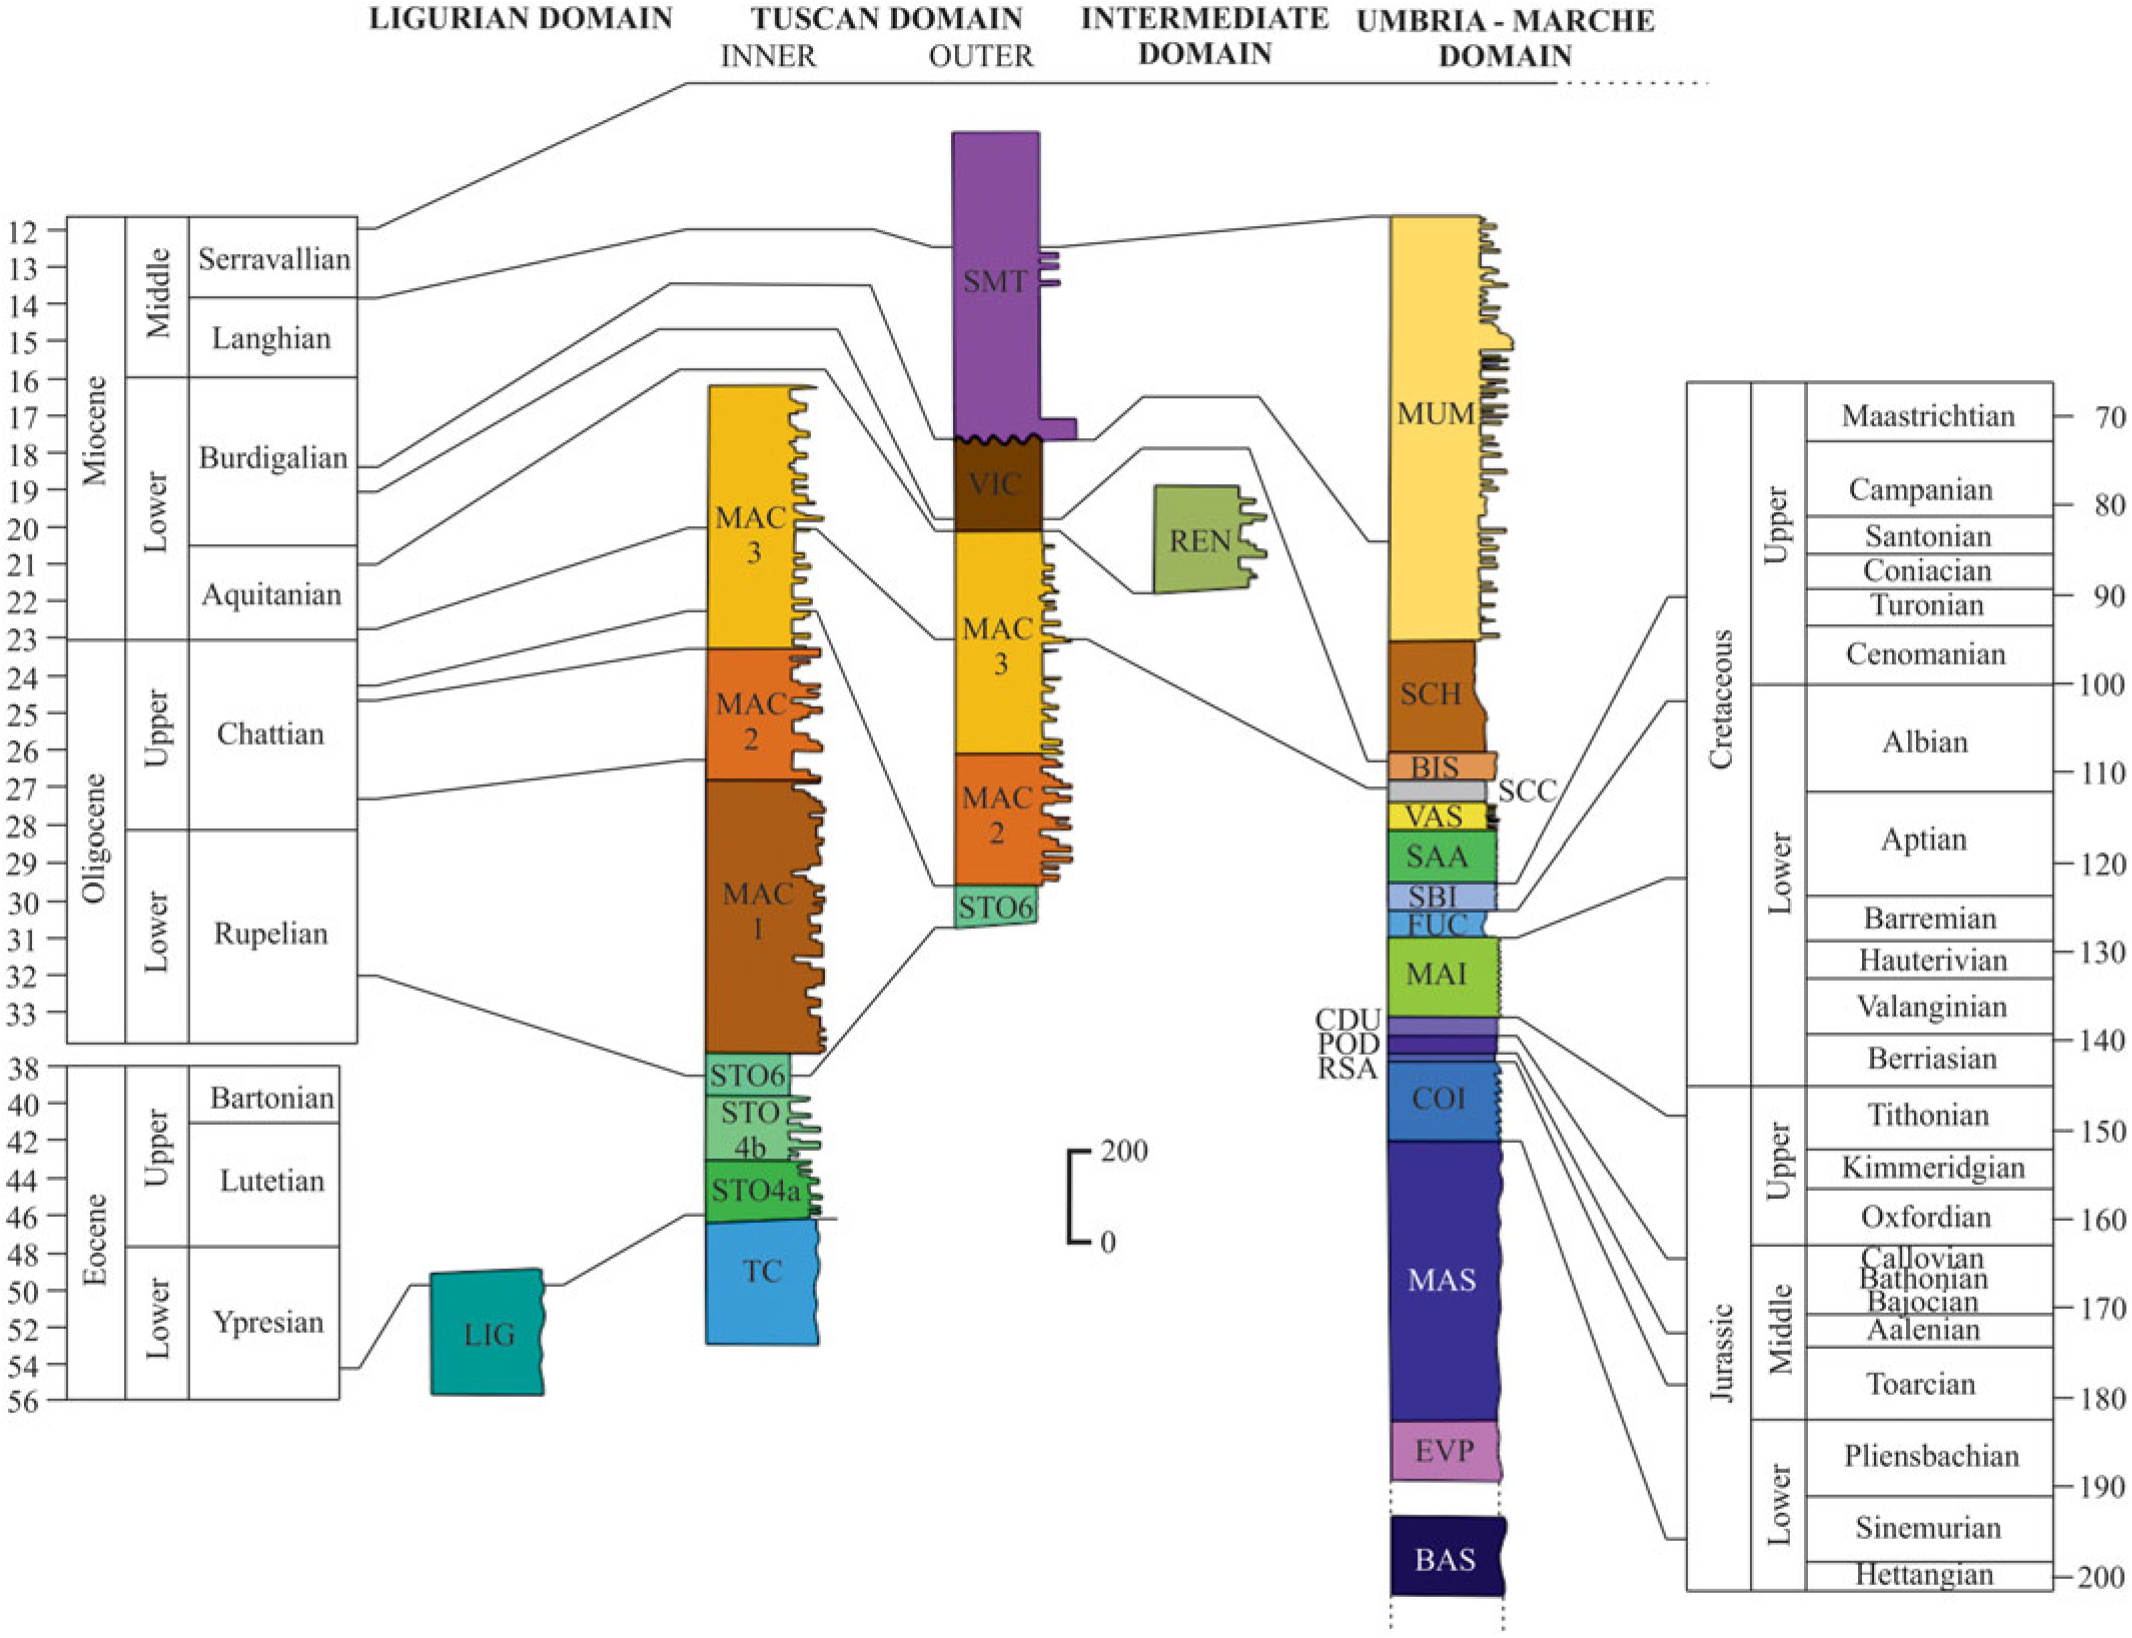
In the study area (Fig. 2), stratigraphic successions pertaining to all the main palaeogeographic domains of the Northern Apennines are exposed, with the individual stratigraphy shown in Figure 3. The Ligurian domain is here represented by a pre-orogenic succession, consisting of narrow outcrops of ophiolites and their sedimentary cover, including Upper Jurassic – Lower Cretaceous pelagites, covered by syn-orogenic Upper Cretaceous – lower Tertiary turbidites (Barchi et al. Reference Barchi, Marroni, Barsella, Bizzari, Botti, Meneghini, Pandolfi, Passeri, Pazzaglia, Argenti, Baldanza, Checconi, Ciarapica, Palandri, Venturi, Barsella, Botti, Boscherini, Cenci, Felicioni, Mencaroni, Motti, Natale, Natali, Ponziani, Sorrentino, Simone, Bellucci, Bortoluzzi, Gasperini and Pauselli2010). The Tuscan domain (Plesi et al. Reference Plesi, Lucchetti, Boscherini, Botti, Brozzetti, Bucefalo, Daniele, Motti, Nocchi and Rettori2002b; Barsella et al. Reference Barsella, Boscherini, Botti, Meneghini, Motti, Palandri, Marroni and Pandolfi2009) includes a pre-orogenic Mesozoic–Palaeogene carbonate multilayer and a syn-orogenic succession made up of Eocene – lower Oligocene marly limestones of the Scaglia Toscana Formation, overlain by the siliciclastic foredeep turbidites of the Macigno Formation (Chattian–Aquitanian) (Plesi et al. Reference Plesi, Lucchetti, Boscherini, Botti, Brozzetti, Bucefalo, Daniele, Motti, Nocchi and Rettori2002b; Barsella et al. Reference Barsella, Boscherini, Botti, Meneghini, Motti, Palandri, Marroni and Pandolfi2009). These deposits are in turn partially covered by the Marne di Vicchio Formation deposited in an upper Aquitanian – middle Burdigalian piggyback basin. The Umbria–Marche domain is characterized by a pre-orogenic Mesozoic–Palaeogene carbonate multilayer resting on Upper Triassic evaporites, cropping out in the Perugia Mountains (Fig. 2). A basal upper Palaeozoic – Middle Triassic metasedimentary succession, drilled in the San Donato 1 and Perugia 2 wells, is also documented (Martinis & Pieri, Reference Martinis and Pieri1964; Menichetti & Minelli, Reference Menichetti and Minelli1991; Anelli et al. Reference Anelli, Gorza, Pieri and Riva1994). The calcareous multilayer is overlain by the syn-orogenic lower–middle Miocene foredeep turbidites of the Marnoso-Arenacea Formation (e.g. Brozzetti et al. Reference Brozzetti, Boncio and Pialli2002; Pialli et al. Reference Pialli, Plesi, Boscherini, Martini, Damiani, Nocchi, Lucchetti, Rettori, Bucefalo, Negri, Aruta, Bigozzi, Brozzetti, Galli, Daniele, Cardinali, Merangola, Motti, Ridolfi, Tosti and Menichetti2009; Plesi et al. Reference Plesi, Damiani, Boscherini, Martini, Lucchetti, Palandri, Rettori, Tuscano, Botti, Daniele, Tosti, Del Gaia, Arcaleni, Galli, Sabatini, Preziosi, Bartoccini and Uffredduzzi2010). The Rentella intermediate domain is located in the southernmost part of the study area between the Tuscan (to the west) and the Umbria–Marche (to the east) domains. It consists of syn-orogenic Rupelian–Aquitanian varicoloured pelagic and hemipelagic marls, topped by Aquitanian–Burdigalian siliciclastic foredeep turbidites (Signorini & Alimenti, Reference Signorini and Alimenti1968; Brozzetti et al. Reference Brozzetti, Lucchetti and Pialli2000; Barsella et al. Reference Barsella, Boscherini, Botti, Meneghini, Motti, Palandri, Marroni and Pandolfi2009).
Chronostratigraphic log representing the relative position of the stacked units, timing of deposition and thickness. LIG – Ligurian units; SMT – Santa Maria Tiberina Formation; VIC – Marne di Vicchio Formation; MAC – members of the Macigno Formation; TSC – members of the Scaglia Toscana Formation; TC – Tuscan carbonates; REN – Rentella intermediate unit; MUM – Marnoso–Arenacea Formation; SCH – Schlier Formation; BIS – Bisciaro Formation; SCC – Scaglia Cinerea Formation; VAS – Scaglia Variegata Formation; SAA – Scaglia Rossa Formation; SBI – Scaglia Bianca Formation; FUC – Marne a Fucoidi Formation; MAI – Maiolica Formation; CDU – Calcari Diasprigni Formation; POD – Calcari e Marne a Posidonia Formation; RSA – Rosso Ammonitico Formation; COI – Corniola Formation; MAS – Calcare Massiccio Formation; EVP – evaporites; BAS – phyllitic basement.

Since late Miocene time, eastwards migrating extensional tectonics in the western part of the Northern Apennines dissected the previous compressional structures (Barchi, Reference Barchi2010), a process which is still active in the main ridge of the Apennines as demonstrated by present-day seismicity (Lavecchia et al. Reference Lavecchia, Brozzetti, Barchi, Keller and Menichetti1994; Chiaraluce et al. Reference Chiaraluce, Di Stefano, Tinti, Scognamiglio, Michele, Casarotti, Cattaneo, De Gori, Chiarabba, Monachesi, Lombardi, Valoroso, Latorre and Marzorati2017; Porreca et al. Reference Porreca, Minelli, Ercoli, Brobia, Mancinelli, Cruciani, Giorgetti, Carboni, Mirabella, Cavinato, Cannata, Pauselli and Barchi2018).
The gross lithology encountered in the TTW provides a clear indication of the deepwater environment in which it developed, and the stratigraphic data effectively constrain the timing of deformation. The sedimentation of the Macigno Formation occurred in a basin, mostly referred to as being characterized by lower shelf and abyssal plain environments, the latter possibly below the calcite compensation depth (Monaco & Trecci, Reference Monaco and Trecci2014). This view is in line with the interpretation of overlying siliceous pelites of the Marne di Vicchio Formation as draping muds of a middle–deep bathyal environment (1500 and 2000 m below sea level), deposited in piggyback basins (Delle Rose et al. Reference Delle Rose, Guerra, Renzulli, Ravasz-Baranyai and Serrano1994; Lucchetti et al. Reference Lucchetti, Brozzetti, Nini, Nocchi and Rettori2002). In the easternmost position, the emplacement of the TTW along the west boundary of the Umbria foredeep (Marnoso–Arenacea Formation, lower–middle Burdigalian) was accompanied by the syn-kinematic deposition of the Monte Santa Maria Tiberina Formation (upper Burdigalian–Serravallian). This formation is recognized as sealing the leading edge of the TTW (Brozzetti, Reference Brozzetti2007), providing a strict temporal constraint for the end of the TTW emplacement which can be bracketed between late Aquitanian (end of the Macigno Formation deposition) and late Burdigalian (initial deposition of the Monte Santa Maria Tiberina Formation) time.
3. Surface geology of the study area
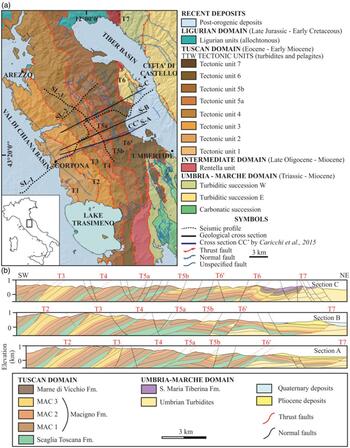
Recent geological maps (1:50 000 scale) by the Italian Geological Survey (Pialli et al. Reference Pialli, Plesi, Boscherini, Martini, Damiani, Nocchi, Lucchetti, Rettori, Bucefalo, Negri, Aruta, Bigozzi, Brozzetti, Galli, Daniele, Cardinali, Merangola, Motti, Ridolfi, Tosti and Menichetti2009; Barchi et al. Reference Barchi, Marroni, Barsella, Bizzari, Botti, Meneghini, Pandolfi, Passeri, Pazzaglia, Argenti, Baldanza, Checconi, Ciarapica, Palandri, Venturi, Barsella, Botti, Boscherini, Cenci, Felicioni, Mencaroni, Motti, Natale, Natali, Ponziani, Sorrentino, Simone, Bellucci, Bortoluzzi, Gasperini and Pauselli2010; Plesi et al. Reference Plesi, Damiani, Boscherini, Martini, Lucchetti, Palandri, Rettori, Tuscano, Botti, Daniele, Tosti, Del Gaia, Arcaleni, Galli, Sabatini, Preziosi, Bartoccini and Uffredduzzi2010) provide a homogeneous and up-to-date dataset for the surface geology of the study area. Through the compilation of these maps, integrated with further structural data collected at selected sites, we produced a synthetic tectonic sketch of the study area (Fig. 4a) and constructed a set of three closely spaced WSW–ENE-trending geological cross-sections (Fig. 4b).
Geological and structural framework of the study area, representing the extensional faults, the main compressive features and structural units of the TTW, the main interpreted seismic lines, the three geological cross-sections and the cross-section by Caricchi et al. (Reference Caricchi, Aldega and Corrado2015a). (b) The three geological cross-sections positioned from south (Section A) to north (Section C). Both the structural map and the geological sections are based on the 1:50 000 maps produced in the framework of the CARG project (Sheets 289, 299 and 310) of the Carta Geologica d’Italia (Pialli et al. Reference Pialli, Plesi, Boscherini, Martini, Damiani, Nocchi, Lucchetti, Rettori, Bucefalo, Negri, Aruta, Bigozzi, Brozzetti, Galli, Daniele, Cardinali, Merangola, Motti, Ridolfi, Tosti and Menichetti2009; Plesi et al. Reference Pialli, Plesi, Boscherini, Martini, Damiani, Nocchi, Lucchetti, Rettori, Bucefalo, Negri, Aruta, Bigozzi, Brozzetti, Galli, Daniele, Cardinali, Merangola, Motti, Ridolfi, Tosti and Menichetti2009; Barchi et al. Reference Barchi, Marroni, Barsella, Bizzari, Botti, Meneghini, Pandolfi, Passeri, Pazzaglia, Argenti, Baldanza, Checconi, Ciarapica, Palandri, Venturi, Barsella, Botti, Boscherini, Cenci, Felicioni, Mencaroni, Motti, Natale, Natali, Ponziani, Sorrentino, Simone, Bellucci, Bortoluzzi, Gasperini and Pauselli2010).

At the surface, the TTW is characterized by a set of eight major WSW-dipping imbricate thrust faults (T1–7, Fig. 4a), each extending several tens of kilometres along-strike. The innermost thrust fault (T1) is mostly buried by Pliocene–Quaternary deposits of the Val di Chiana Basin. The thrust fault T6′ represents a secondary thrust within the tectonic unit 6, while the thrust fault T5 is divided into two major splays (T5a and T5b).
The geological sections (Fig. 4b) show that only the uppermost part (Upper Cretaceous – lower Miocene) of the Tuscan domain succession is incorporated in the tectonic units, detached from their original Triassic – Lower Cretaceous substrate, whose closest outcrop is located west of the Val di Chiana Basin (Fig. 2; e.g. Damiani et al. Reference Damiani, Minelli, Pialli, Pialli, Barchi and Menichetti1991). The internal stratigraphy of the tectonic units (Fig. 3) includes the Scaglia Toscana Formation and the subsequent Macigno Formation (subdivided into three members: MAC 1, MAC 2 and MAC 3), showing an overall evolution from inner turbidite fan to distal foredeep facies (Plesi et al. Reference Plesi, Lucchetti, Boscherini, Botti, Brozzetti, Bucefalo, Daniele, Motti, Nocchi and Rettori2002b). The thickness of the Tuscan domain succession decreases eastwards from the innermost to the outermost units (Fig. 3). The Scaglia Toscana Formation becomes thinner and comprises only its upper part, due to the eastwards upsection trajectory of the basal thrust and a regional-scale pinch-out. The Macigno Formation also becomes thinner eastwards, and only the two upper members (MAC2 and MAC3) are present in the easternmost tectonic units due to a regional-scale onlap of the turbidites above the upper Oligocene foreland ramp (Barsella et al. Reference Barsella, Boscherini, Botti, Meneghini, Motti, Palandri, Marroni and Pandolfi2009).
The geological sections also show that the major W-dipping thrust faults are accompanied by a set of asymmetric fault-propagation folds in their hanging wall, involving the three members of the Macigno Formation. Within the TTW, a systematic decrease in the average splay dip angles can be observed from west to east; along geological cross-section B the values range from 27° (T2) to 9° (T6). This suggests that the internal imbrication of the TTW was chiefly characterized by in-sequence thrust propagation where the emplacement of the younger splays progressively increased the deformation on their hanging wall, making the older splays steeper (Boyer & Elliott, Reference Boyer and Elliott1982).
The tectonic wedge is disrupted by numerous W-dipping and E-dipping normal faults. Extensional tectonics is particularly intense at the western border of the study area, where a major W-dipping normal fault controls the eastern flank of the Val di Chiana Basin (Figs 2, 4a). Significant extension also occurs in the eastern part of the sections (Fig. 4b) where conjugate both E- and W-dipping normal faults are observed, locally causing several hundred metres of displacement.
4. Subsurface data
4.a. Seismic dataset
The subsurface dataset used for this project covers an area located between the Pratomagno Ridge to the north and Lake Trasimeno to the south (see location map in Fig. 2). It consists of: (1) three seismic reflection profiles (SL-1, SL-2 and SL-3) located in the study area and calibrated with surface geology data; (2) two 2D seismic profiles (SL-a and SL-b) located outside of the study area; and (3) the Pratomagno 1 well, located c. 40 km NW of the SL-2 profile (Fig. 2). All seismic data are in the time domain and were acquired during exploration campaigns carried out between 1975 and 1990.
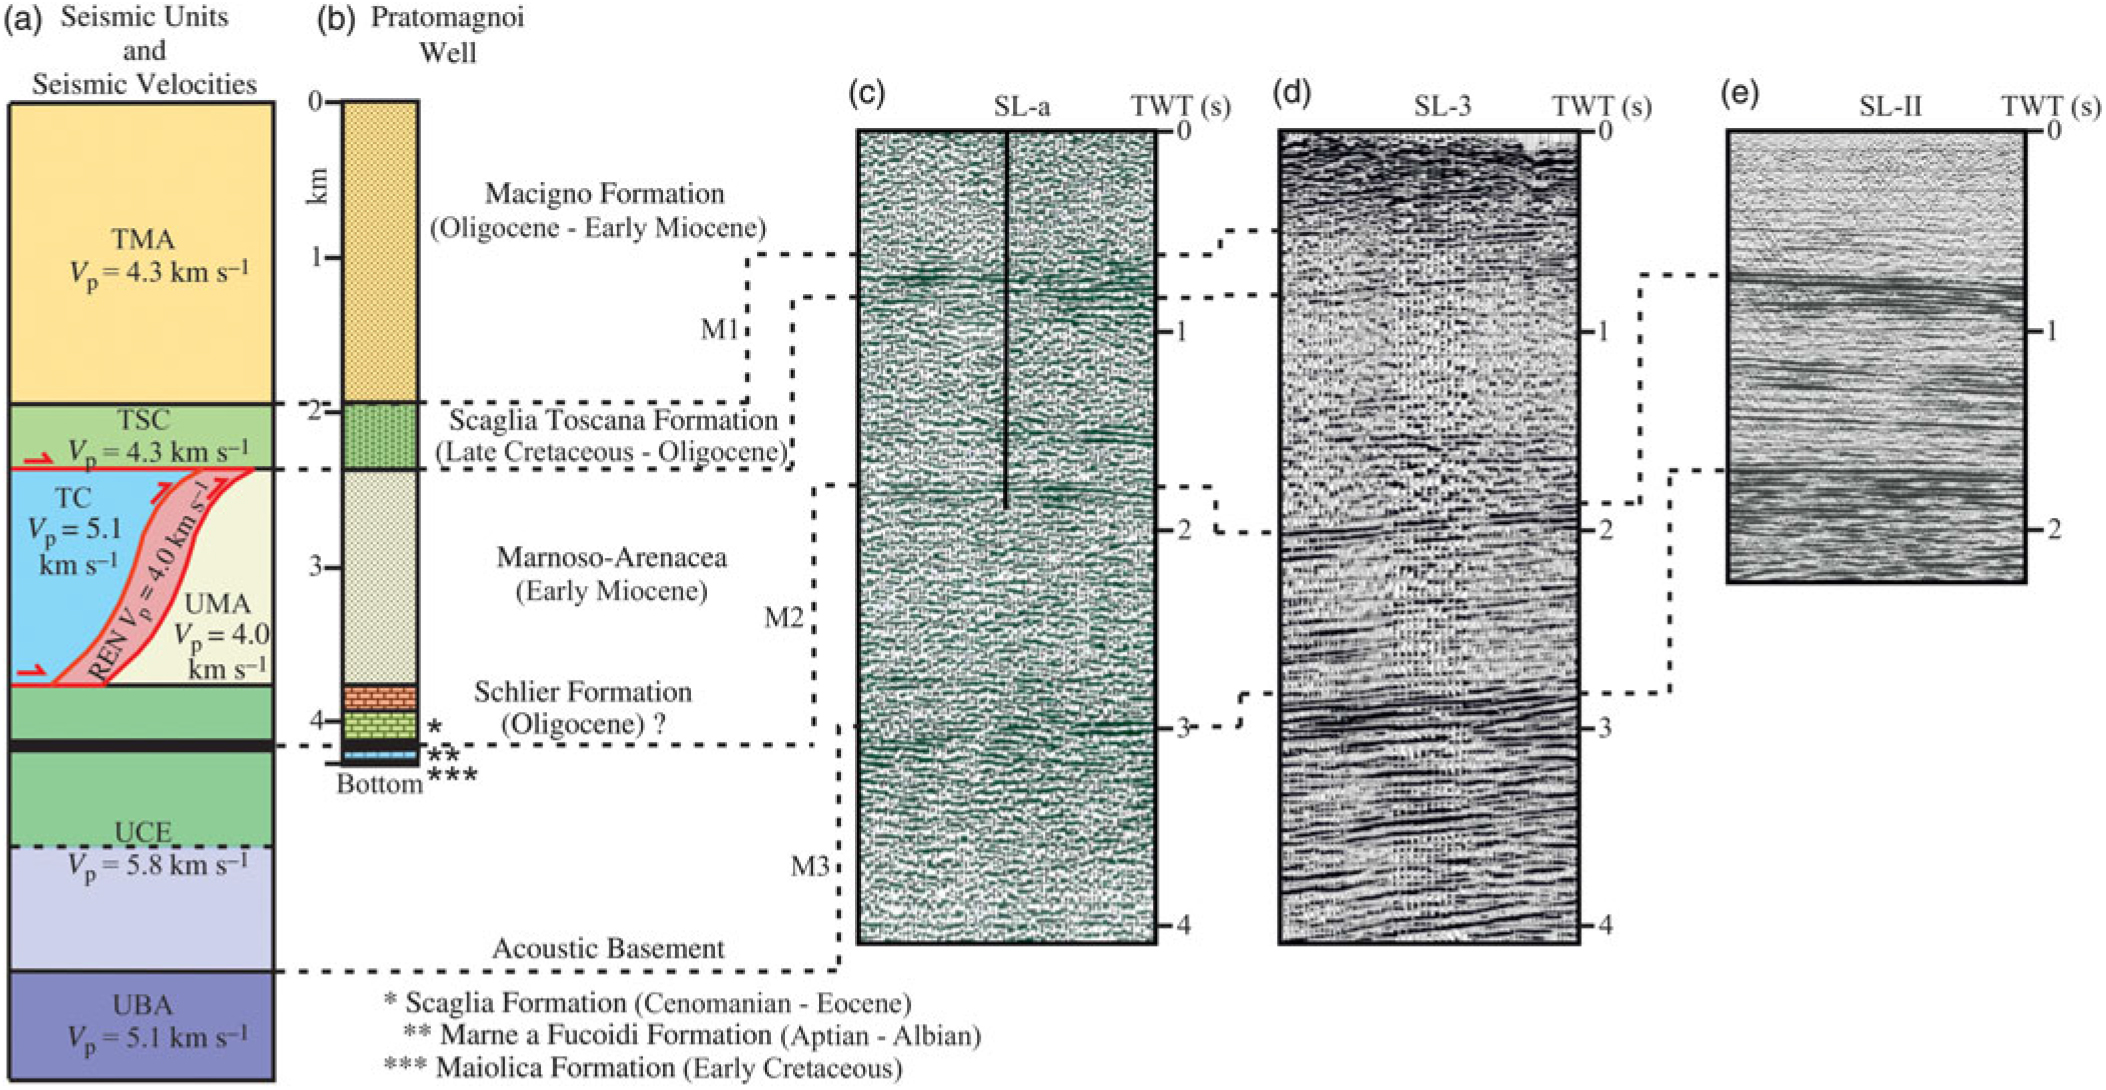
The interpretation of the most important reflectors of the considered profiles was calibrated by using the 4320 m deep Pratomagno 1 well (Fig. 5b) (VIDEPI, http://www.videpi.com), with the well stratigraphy projected onto the closest seismic profiles SL-a and SL-b (traces in Fig. 2). The stratigraphy of the Pratomagno 1 well consists of two superposed tectonic units, that are, the Tuscan tectonic unit (above) and the Umbria–Marche tectonic unit (below) (Fig. 5a, b). The Tuscan tectonic unit comprises the turbidites of the Macigno Formation and the underlying Eocene – upper Oligocene Scaglia Toscana Formation whose base, that is the tectonic contact between the two units, is encountered at a depth of 2350 m from the well top. The Umbria–Marche tectonic unit comprises the Umbrian turbidites of the lower–middle Miocene Marnoso–Arenacea Formation overlying the Meso-Cenozoic Umbria carbonates. The base of the well reaches the Lower Cretaceous pelagic limestones of Maiolica Formation, underlying the marly Marne a Fucoidi Formation, intercepted at a depth of 4100 m from the well top.
(a) Seismic units with their seismic velocities from Bally et al. (Reference Bally, Burbi, Cooper and Ghelardoni1986) and Mirabella et al. (Reference Mirabella, Brozzetti, Lupattelli and Barchi2011); (b) stratigraphy of the Pratomagno 1 well; (c) corresponding reflectors in the seismic profile SL-a; (d) corresponding reflectors in the seismic profile SL-3; and (e) corresponding reflectors in the seismic profiles in the seismic profile SL-II.

As demonstrated by previous seismic studies in this region (e.g. Bally et al. Reference Bally, Burbi, Cooper and Ghelardoni1986; Barchi et al. Reference Barchi, De Feyter, Magnani, Minelli and Pialli1998a, b, c), the Marne a Fucoidi and the Scaglia Toscana formations form the most prominent reflectors in the seismic stratigraphy of the study area, due to their marly lithology that produces a strong acoustic impedance contrast with respect to the adjacent, mainly carbonate rocks. In seismic profile SL-a (Fig. 5c), the Scaglia Toscana Formation is interpreted to correspond to a group of high-amplitude, medium-continuity reflectors between 0.5 s (top) and 0.7 s (base) (two-way travel time or TWT). In turn, the Marne a Fucoidi Formation is a regionally recognized prominent reflector located in the uppermost part (0.1–0.15 s TWT below the top) of the Umbrian carbonates; in seismic profile SL-a (Fig. 5c) it is interpreted on a high-amplitude and laterally continuous reflector at around 1.5 s (TWT). In summary, the Pratomagno 1 well provides direct evidence of the superposition of the allochthonous Tuscan tectonic unit over the autochthonous Umbrian–Marche tectonic unit and constrains the main basal thrust separating the two superposed units at a depth greater than 2 km. This tectonic stacking is not limited to the study area but is a regional feature, as demonstrated by other wells in the Northern Apennines (e.g. Suviana 1, Anelli et al. Reference Anelli, Gorza, Pieri and Riva1994) that drilled through the TTW into the Umbria–Marche tectonic unit.
We analysed and interpreted in detail the three seismic reflection profiles that cross both transversally (SW–NE, SL-1 and SL-2) and longitudinally (NW–SE, SL-3) the tectonic units of the study area (Fig. 2). SL-1 crosses the entire TTW, SL-2 crosses the study area 4 km north of SL-1 and SL-3 is oriented NW–SE, intercepting both the SL-1 and SL-2 transversal lines.
The three seismic profiles were recorded using different parameters (e.g. sample rate and record length) and sources (vibroseis or dynamite); a summary of the main acquisition parameters is reported in Table 1. The profiles recorded with an explosive source provide a better signal-to-noise ratio and therefore a clearer imaging of the main reflectors. Considering the target units of this study, we limited the interpretation to a depth of c. 4 s TWT; the deepest part of the profiles is characterized by lower quality in terms of resolution and signal-to-noise ratio.
Acquisition parameters of the main interpreted seismic lines

4.b. Seismic stratigraphy
The seismic stratigraphy of the study area, illustrated in Figure 5a, consists of seven seismic units and three major seismic markers, which are described from top to bottom in the following.
Seismic unit TMA (T – Tuscan tectonic unit; MA – Macigno Formation) is characterized by low-amplitude and high-frequency reflectors, generally with low continuity; this unit corresponds to the Macigno Formation and its thickness varies from 0.2 to 1.5 s (TWT), thinning northeastwards.
Seismic unit TSC (T – Tuscan tectonic unit; SC – Scaglia Toscana Formation) is characterized by a series of high-amplitude, low-frequency reflectors, of c. 0.2 s (TWT) thickness; this unit is located below the TMA and is associated with the Scaglia Toscana Formation.
Seismic unit UMA (U – Umbrian tectonic unit; MA – Marnoso–Arenacea Formation) contains discontinuous, high-amplitude, mid-frequency reflectors and several secondary reflectors slightly dipping southwestwards; the observed thickness is generally c. 0.6 s (TWT) but, in correspondence with the major thrust faults, it is locally doubled, reaching a thickness of c. 1.2 s (TWT). It is associated with the Marnoso–Arenacea Formation.
Seismic unit UCE (U – Umbrian tectonic unit; CE – carbonates and evaporites) shows good-continuity, high-amplitude and mid-frequency reflectors. The top of this seismic unit is recognized by a couple of near-parallel strong reflectors and its thickness is c. 0.9 s (TWT), often increased by a series of deep-seated thrusts. This is interpreted as corresponding to the Umbrian carbonates and evaporites.
The lowermost seismic unit UBA (U – Umbrian tectonic unit; BA – basement) is composed of high-amplitude, low-frequency reflectors, associated with the acoustic basement of the Umbria–Marche domain (sensu Bally et al. Reference Bally, Burbi, Cooper and Ghelardoni1986; Barchi et al. Reference Barchi, De Feyter, Magnani, Minelli and Pialli1998a, b, c; Mirabella et al. Reference Mirabella, Barchi, Lupatelli, Stucchi and Ciaccio2008).
In the interpreted sections, two other seismic units, referred to TC (T – Tuscan tectonic unit; C – carbonates) and REN (Rentella tectonic unit) were traced, whose presence is solely predicted based on the regional stratigraphic framework since they were not encountered by the Pratomagno 1 Well.
Seismic unit TC consists of wedge-shaped bodies characterized by transparent reflectors, bounded by mid- to high-amplitude and low-frequency reflectors in the western part of SL-1. It is interpreted as carbonates of the Tuscan tectonic unit, that is, the Mesozoic calcareous substrate of the Scaglia Toscana Formation.
Seismic unit REN is characterized by high-amplitude and low-frequency reflectors and interposed between the base of the allochthonous Tuscan tectonic unit (TMA + TSC) and the top UMA.
The seismic interpretation is furthermore based on the identification of three key seismic marker horizons (Fig. 5) as follows.
(1) M1: top of Scaglia Toscana Formation (top of seismic unit TSC), top of a group of closely spaced, high-amplitude, medium-continuity reflectors, with a thickness of 0.2–0.3 s (TWT).
(2) M2: top of Umbria carbonates (top of UCE), upper reflection of two parallel, high-amplitude, high-continuity reflectors, spaced c. 0.2 s (TWT), which marks the position of the top of the Calcareous Scaglia and the top of the Marne a Fucoidi Formation, thus tracing the position of the upper part of the Umbria carbonates.
(3) M3: top acoustic basement (top UBA), the almost transparent seismic facies of the Umbria carbonates and evaporites, is bounded at its base by a group of discontinuous, high-amplitude reflectors, defining the acoustic basement (sensu Bally et al. Reference Bally, Burbi, Cooper and Ghelardoni1986; Mirabella et al. Reference Mirabella, Barchi, Lupatelli, Stucchi and Ciaccio2008).
The correlation with the Pratomagno 1 well (Fig. 5), showing the superposition of TMA, TSC, UMA and UCE, controls the calibration of the markers M1 and M2 in the seismic profiles SL-a and SL-b. The comparison of the main reflectors in the seismic profiles (SL-1, SL-2, SL-3) and their intersections allows the correlation of the Umbria units UMA, UCE and UBA and the reflectors M2 and M3. The comparison with previous interpretations of adjacent regions (Western Umbria in particular, see e.g. Mirabella et al. Reference Mirabella, Ciaccio, Barchi and Merlini2004, Reference Mirabella, Brozzetti, Lupattelli and Barchi2011) further supports the proposed seismic stratigraphy. For the M1 marker, further control is offered by the correspondence between the reflector and the outcrops of Scaglia Toscana in the study area.
4.c. Seismic interpretation and depth conversion
The three seismic profiles crossing the study area were all interpreted using the three marker reflections and the seven seismic units as key building elements. The interpretation of seismic lines SL-2 and SL-3 was mainly used for structural framework interpretation of the study area. The integrated section balancing approach presented in the following focuses on seismic line SL-1, which crosses the study area transversally and offers a complete strike-perpendicular view into the TTW.
4.c.1. SL-1 profile
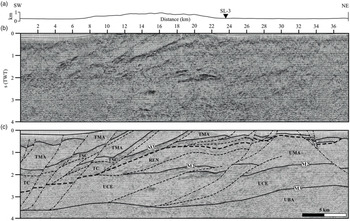
At relatively shallow depth the profile SL-1 (Fig. 6) shows a prominent package of high-amplitude reflectors interpreted as the Scaglia Toscana Formation (TSC), which regionally corresponds to the basal décollement of the TTW (TMA and TSC) that becomes progressively shallower from the SW (1.5 s TWT at 10 km) to the NE (0.6 s TWT at 24 km). The major splays of the imbricate thrust system splaying out from this basal décollement are particularly evident in the central part of the profile (between 10 and 24 km) while, towards the NE, the seismic reflections become more chaotic and discontinuous. The geometry of the TTW to the NE was chiefly reconstructed on the basis of surface geology data.
(a) Topography distribution above the SL-1 trace. (b) Seismic profile SL-1 in TWT. (c) Interpretation showing the main tectonic features. Full lines are lithological contacts, dashed lines are thrust faults and dashed-dotted lines are normal faults. Abbreviations as for Figure 3.

At the western end of the profile between 0 and 10 km there are two sigmoidal reflection packages bound by medium- to high-amplitude and low-frequency reflectors that pinch-out westwards below the TSC. The reflection packages were tentatively associated with the TC, as also proposed in previous interpretations (Barchi et al. Reference Barchi, Cardellini, Checcucci, Frondini, Fulignati, Pauselli, Pazzaglia, Sbrana and Viterbo2013). In the central part of the seismic line, the M2 horizon traces the top of the UCE, forming a long-wavelength anticline structure culminating at 1.7 s (TWT). Local doubling of M2 (e.g. between 17 and 24 km) marks the involvement of the UCE in thrusting. In the deepest part of the profile, the underlying acoustic basement (M3) coincides with high-amplitude, low-frequency reflectors dipping westwards between c. 2.6 and 3.8 s (TWT).
In the central part of the profile (between 12 and 18 km), c. 0.5 s (TWT) beneath the base of the TTW, a prominent W-dipping reflection is interpreted as the base of the REN, which crops out c. 10 km southwards of the interpreted section east and SE of the Trasimeno Lake, interposed between the TTW and the TMA (Fig. 2) (Brozzetti et al. Reference Brozzetti, Lucchetti and Pialli2000; Meneghini et al. Reference Meneghini, Botti, Aldega, Boschi, Corrado, Marroni and Pandolfi2012).
All along the profile, several normal faults were recognized that displace the stacked compressional structures. Both SW-dipping and NE-dipping normal faults, recognized at both edges of the profile, displace the TTW, creating accommodation space for the post-orogenic deposits of the Val di Chiana Basin to the west and of the High Tiber Basin to the east (Fig. 2) with a maximum thickness of 0.3 s (TWT).
4.c.2. SL-2 profile
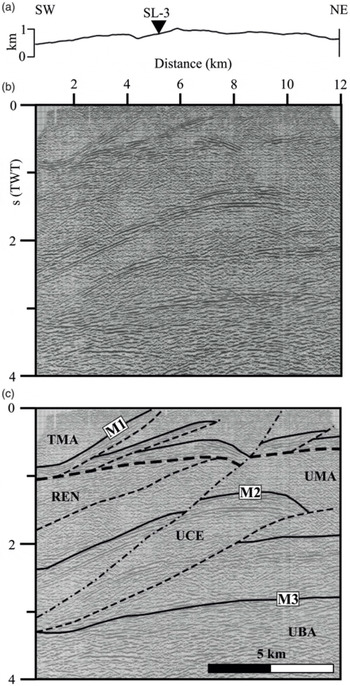
The seismic line SL-2 (Fig. 7), located about 10 km north with respect to SL-1 with a SW–NE orientation, is 12 km long and intersects SL-3 at 5 km. Similar to SL-1, SL-2 clearly displays at shallow depth the internal imbrication of the TTW, expressed by a set of high-amplitude reflectors associated with the TSC, showing two major imbrications. These are detached above a SW-dipping basal décollement, localized between 0.5 and 1 s (TWT). At intermediate depth (1.5–2.5 s TWT), reflector M2 is folded and displaced by a SW-dipping thrust fault and the related hanging-wall anticline; the footwall is less deformed, showing a regular, gently W-dipping geometry.
(a) Topography distribution above the SL-2 trace. (b) Seismic profile SL-2 in TWT. (c) Interpretation showing the main tectonic features. Full lines are lithological contacts, dashed lines are thrust faults and dashed-dotted lines are normal faults. Abbreviations as for Figure 3.

In the eastern part of profile SL-2 (progressive 10 km at the surface), both M1 and M2 are displaced by a major SW-dipping normal fault, reaching a depth greater than 3 s (TWT) at the western end of the profile.
In the southwestern part of seismic line SL-2 (Fig. 7), between 0 and 7 km, interposed between TSC and M2, a set of prominent W-dipping reflectors is associated with the REN, in line with the interpretation proposed for SL-1. At greater depth (3–3.5 s TWT), the strong reflections of the M3 appear slightly folded and unaffected by thrusting. Within the UBA unit, various secondary internal reflectors can be recognized. In the northeastern part of the profile, the distance between M2 and M3 (0.9 s TWT) is representative of the stratigraphic thickness of the UCE.
4.c.3. SL-3 profile
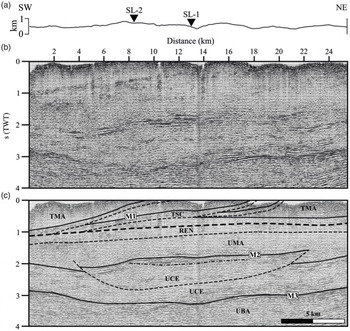
The NW–SE-oriented seismic line SL-3 (Fig. 8) crosses the main structures of the study area longitudinally. It is 25 km long and intersects both SL-2 and SL-1 at 9 km and 13 km, respectively. The uppermost part of the SL-3 section (down to about 1 s) images the TTW, bounded at its base by its basal décollement. Three main packages of TSC splay out from the almost flat basal décollement, imaging a set of imbricate thrust faults, with an apparent dip towards the NW. All along the profile, below the basal décollement, the REN is homogeneously distributed with a thickness in the order of 0.3 s (TWT) overlying the UMA.
(a) Topography distribution above the SL-3 trace. (b) Seismic profile SL-3 in TWT. (c) Interpretation showing the main tectonic features. Full lines are lithological contacts, dashed lines are thrust faults and dashed-dotted lines are normal faults.

Between 1.5 and 1.9 s (TWT), M2 is recognized to be faulted at 3 km and 22 km by a single thrust fault, cut along-strike, with the transport direction perpendicular to the profile, showing opposite dip in its NW-ward and SE-ward terminations. Because of thrust faulting, the true stratigraphic thickness of the UCE (c. 0.9 s TWT) can be estimated only in the footwall blocks at the opposite sides of the profiles; in the central part of the profile, the UCE is tectonically thickened (up to 1.4 s TWT). In the proposed interpretation, this thrust does not affect the underlying top basement M3, located between 2.7 and 3.2 s (TWT).
4.c.4. Depth conversion
A simplified time-to-depth conversion of the three seismic profiles was performed by using interval velocities (see Fig. 5a) derived from previous works (Bally et al. Reference Bally, Burbi, Cooper and Ghelardoni1986; Barchi et al. Reference Barchi, De Feyter, Magnani, Minelli and Pialli1998a, b, c; Mirabella et al. Reference Mirabella, Brozzetti, Lupattelli and Barchi2011) that averaged log velocity data recorded in various exploration wells of the region. Coherently with the cited studies, the interval velocities (V p) within each seismostratigraphic unit were assumed to be constant with depth and laterally. Figure 9 shows the interpretation of seismic line SL-1, converted to depth, to provide a geological cross-section of the study area integrated with surface geology data.
(a) Geological cross-section B. (b) Interpretation of SL-1, projected onto the geological cross-section B and subsequently converted to depth. (c) Final integrated section displaying the reconstructed TTW geometry. Black dots represent the values of maximum burial depth obtained by Caricchi et al. (Reference Caricchi, Aldega and Corrado2015a), re-projected onto the integrated section and fitted by a line which represents the extrapolated maximum thickness of the TTW. (d) Close-up of the upper part of the wedge after the restoration of the extensional faults to demonstrate how the reconstructed wedge fits thermal and burial data by Caricchi et al. (Reference Caricchi, Aldega and Corrado2015a).

5. Section integration and timing of deformation
5.a. Surface–subsurface integration
By combining surface data (i.e. geological maps and geological cross-section B, Fig. 4b) and subsurface data converted to depth (SL-1, Fig. 9), we obtained a 33 km long, WSW–ENE-trending, integrated geological cross-section that shows the internal geometry of the imbricate thrust system of the TTW and of the underlying Umbrian siliciclastic turbidites and carbonates, down to the top of the acoustic basement (Fig. 9c).
The reflections interpreted as thrust faults on the seismic sections show a good correspondence with the thrust faults exposed at the surface. The seismostratigraphic units attributed to the Macigno and the Scaglia Toscana formations are also in agreement with respective surface exposures. In the western and central part of the section, the basal décollement of the TTW, as well as the trajectories at depth of the internal splays, are well constrained by the seismic data. On the contrary, in the eastern part of the section the seismic image of the basal décollement is unclear, possibly due to a lower thickness of the tectonic wedge and to the effects of younger normal faults which cause complex deformation patterns. For this reason, in the easternmost part the proposed reconstruction is largely based on the surface geology. The interpretation of the deepest units in the footwall of the TTW, including the Rentella intermediate tectonic unit (REN), the Umbria–Marche turbidites (UMA) and the underlying Umbria–Marche carbonates and evaporites (UCE), down to the top of the acoustic basement (UBA), is entirely based on seismic data interpretation.
In order to reconstruct the original TTW geometry at the time of its emplacement (i.e. before the main erosional phase and the subsequent extensional tectonics), the integrated section was extended above the topography (Fig. 9c) using the following approach.
The top of the Scaglia Toscana Formation (M1), as constrained by both surface and subsurface data, was used as the key-horizon to estimate the actual displacement associated with each thrust of the imbricated system. In all interpreted profiles, the footwall cut-off of TSC is well imaged and constrained by the seismic data as the TSC is marked by a group of prominent reflections. The seismic data also constrain the position of the hanging-wall cut-off for the easternmost thrusts, where the TSC is not exposed at the surface. For the western thrusts, the position of the hanging-wall cut-off is determined based on surface geology data.
Above the top of the Scaglia Toscana Formation (M1), the thickness, geometry and elevation of the different members of the Macigno Formation were also derived from the surface geological data (synthesized along the surface geological cross-sections, see Fig. 4b). The Macigno Formation was extended above the topography, maintaining a conservative interpretation of the thickness of the TTW using the same stratigraphic thickness estimated in the field.
5.b. Timing of deformation
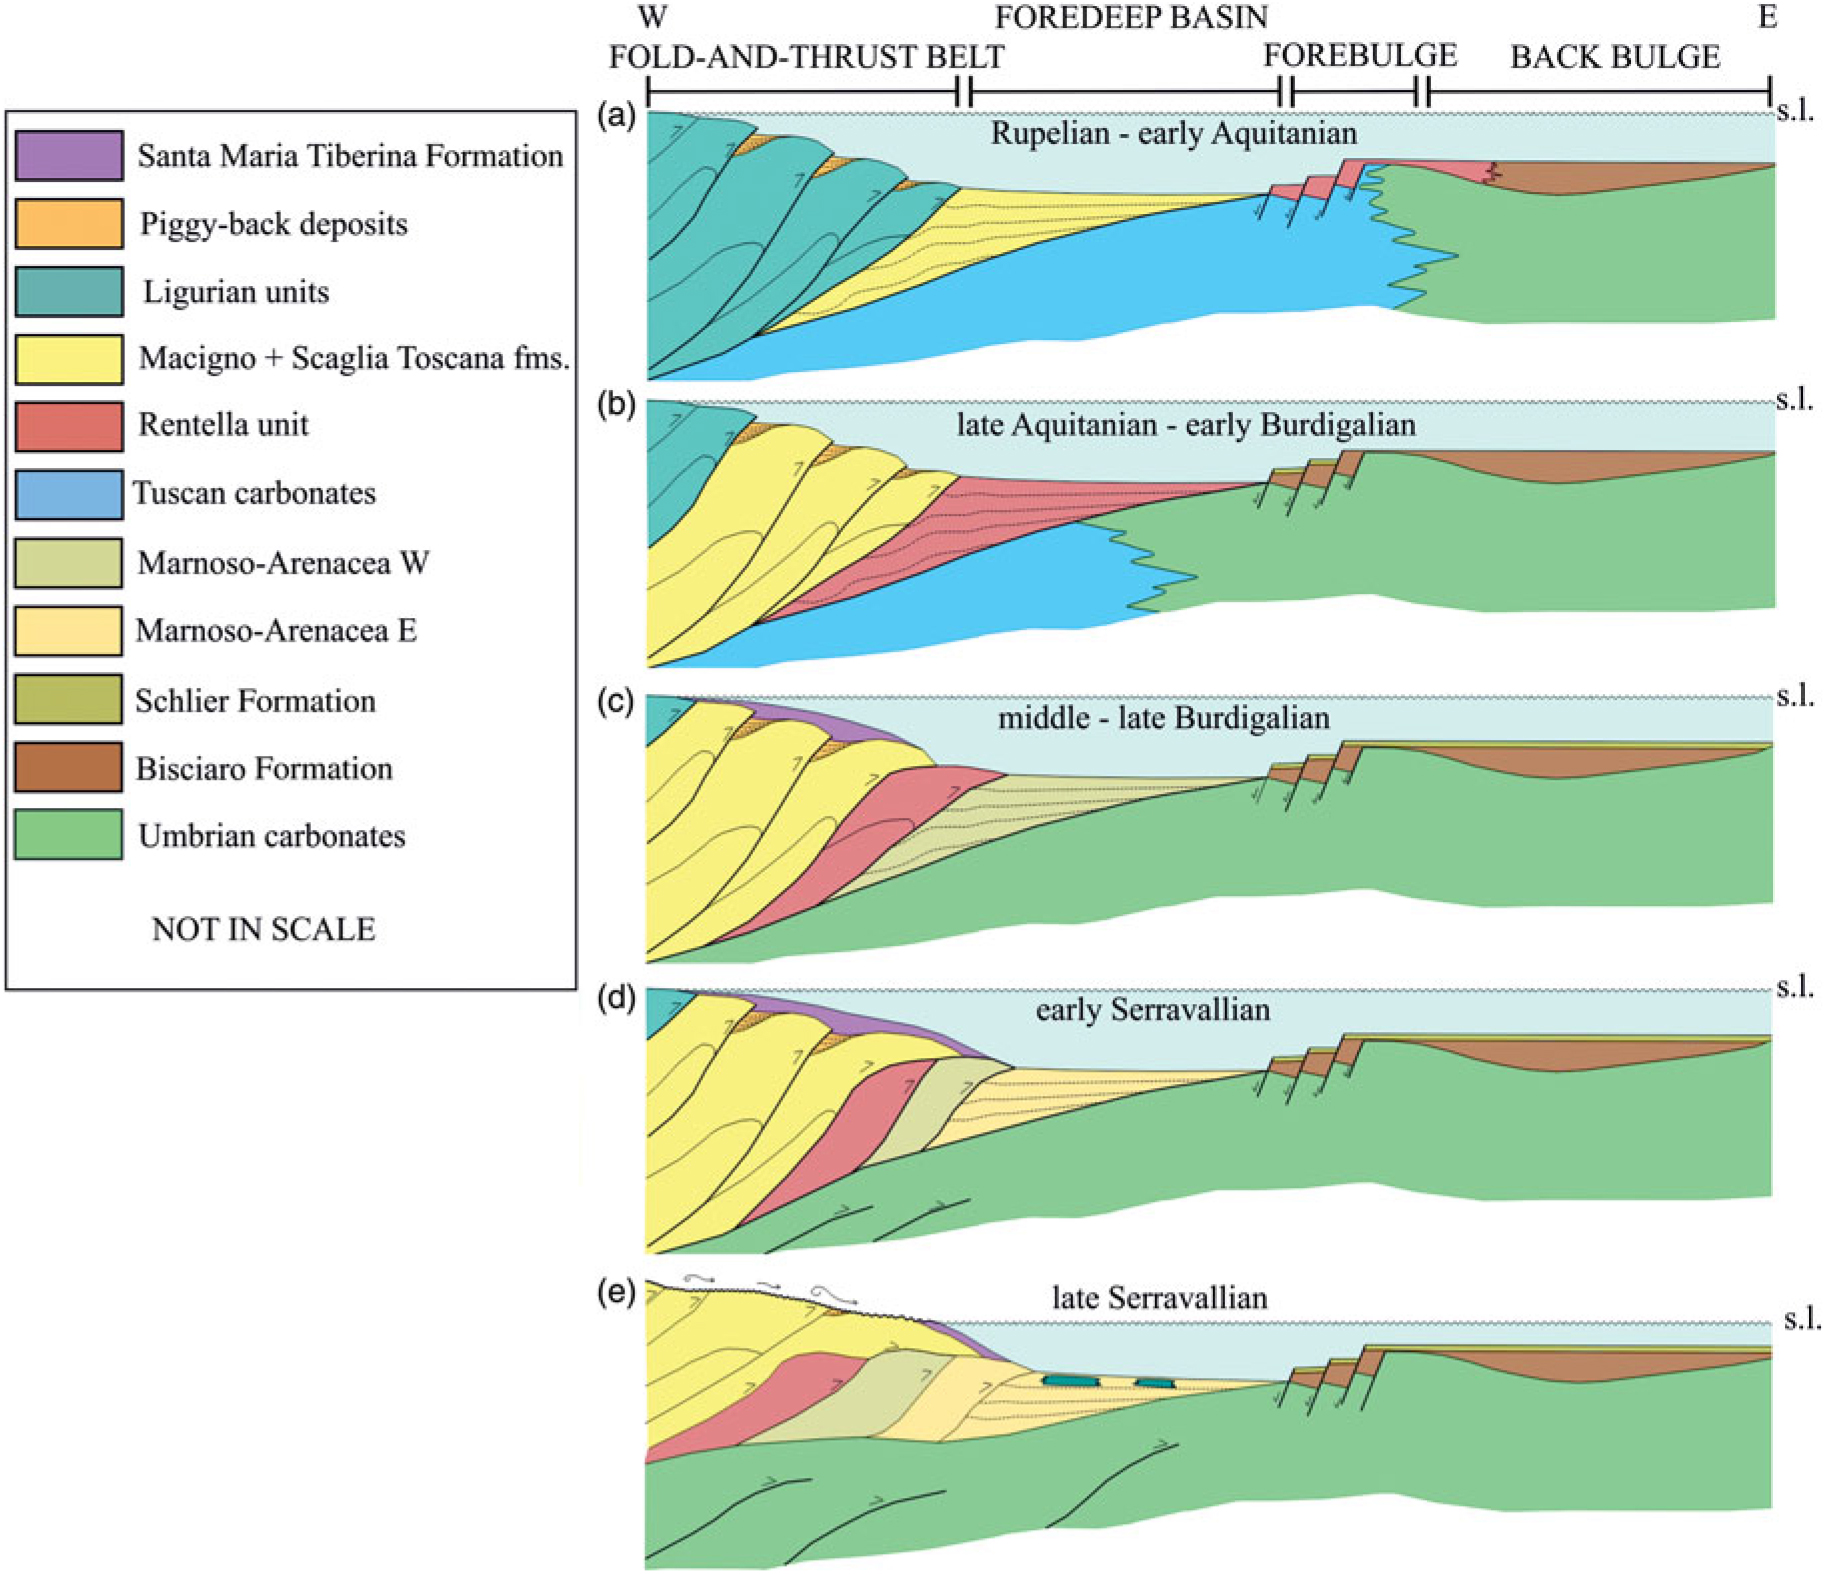
The tectonic history of the study area can be subdivided by structural restoration into six key time intervals. In the first interval (Fig. 10a), Rupelian – early Aquitanian in age, initial foredeep formation occurred in response to the emplacement and imbrication of the Ligurian tectonic units. During this interval, the deposition of the Macigno Formation (Chattian–Aquitanian) was coeval with the deposition of the pelagic marls of the Rentella intermediate domain (Rupelian–Aquitanian) in the easternmost foreland ramp (Meneghini et al. Reference Meneghini, Botti, Aldega, Boschi, Corrado, Marroni and Pandolfi2012). In the second interval (Fig. 10b), late Aquitanian – early Burdigalian in age, the TTW internal imbrication drove the onset and evolution of the foredeep basin in which the siliciclastic turbidites of the upper Rentella intermediate domain were deposited. In the third interval (Fig. 10c), middle–late Burdigalian in age, the eastwards migration and emplacement of the TTW and the deformation of the Rentella tectonic unit occurred during the deposition of the inner Marnoso–Arenacea Formation. In the fourth interval (Fig. 10d), early Serravallian in age, the deep-seated deformation of the Umbrian carbonates and evaporites unit caused an eastwards shift of the Umbria foredeep depocentre (Brozzetti, Reference Brozzetti2007). The thrust faults deforming the Umbria carbonates and evaporites detached at the top basement, and produced further shortening by folding and passively transporting the TTW eastwards. Subsequently, during late Serravallian time (Fig. 10e), progressive uplift and erosion of the TTW occurred as suggested by the lack of sediments of this age in the study area and by the occurrence of olistostromes consisting of deformed Ligurian units further to the east (Ricci Lucchi & Pialli, Reference Ricci Lucchi and Pialli1973). During the Tortonian, the compressional front of the FTB migrated further eastwards and the Umbria foredeep reduced to a narrow trough (Monte Vicino piggyback basin; e.g. Centamore et al. Reference Centamore, Chiocchini and Micarelli1977; Lena et al. Reference Lena, Barchi, Alvarez, Felici, Minelli, Faulkner, Mariani and Mecklenburgh2014). In the Pliocene and Quaternary, extensional tectonics finally disrupted the compressional belt and drove the evolution of the Val Di Chiana and High Tiber basins (e.g. Barchi, Reference Barchi2010; Gasperini et al. Reference Gasperini, Barchi, Bellucci, Bortoluzzi, Ligi and Pauselli2010).
Model proposed for the evolution of the study area displaying the tectonic units in their structural position. (a) Inner belt made up by the Ligurian units and end of the Macigno Formation deposition. (b) Tuscan units involved in the tectonic wedge and end of deposition of the Rentella tectonic unit in foredeep basin. (c) Deposition of the Monte Santa Maria Tiberina Formation on the top of the tectonic wedge, end of active deformation of the TTW and deposition of the inner Marnoso–Arenacea Formation. (d) Eastwards migration of the wedge, deep deformation of the Umbrian carbonates and evaporites and deposition of the outer Marnoso–Arenacea Formation. (e) Main erosional phase characterized by olistostromes of eroded Ligurian units within the Marnoso–Arenacea Formation.

6. Discussion
Many geological concepts for the early contractional deepwater evolution of FTBs are derived from marine seismic reflection imaging and interpretation of modern deepwater systems (e.g. Krueger & Gilbert, Reference Krueger and Gilbert2009; Morley et al. Reference Morley, King, Hillis, Tingay and Backe2011). In contrast to fossil FTBs, modern deepwater FTBs have the advantage of not yet being affected by a later-stage orogenic structural overprint, and are covered in many cases by an extensive, high-quality, potentially 3D seismic database (locally supported by well data). The limits of dominantly or exclusively seismic-based deepwater FTB studies include: (1) problems in the seismic-reflection display of steep or overturned bedding; (2) the loss of seismic energy with depth and therefore a downwards decrease in seismic resolution and the signal-to-noise ratio; and (3) general resolution limits that hamper the analysis of subseismic deformation (e.g. minor folds and thrusts at mesoscopic scale; layer-parallel shortening due to tectonic compaction; sedimentary compaction; sub-grain deformation), which can account for additional (up to 50%) shortening in contractional systems (e.g. Cooper et al. Reference Cooper, Garton and Hossack1983; Morley, Reference Morley1986; Mitra, Reference Mitra1994; Koyi, Reference Koyi1995; McNaught & Mitra, Reference McNaught and Mitra1996; Koyi et al. Reference Koyi, Sans, Teixell, Cotton, Zeyen and McClay2003; Ghisetti et al. Reference Ghisetti, Barnes, Ellis, Plaza-Faverola and Barker2016). In contrast, combined surface–subsurface studies of fossil onshore FTBs can integrate field mapping results and structural outcrop analysis, allowing (1) fold and anticline geometries at any scale; (2) true shortening accommodated by thrusting and folding at any scale; (3) shortening distribution; and (4) physical properties of both thrusted stratigraphy and individual tectonic structures to be better constrained. The inherent disadvantage of a younger structural overprint within fossil, exposed FTBs can be overcome by consequent tectonic reconstruction.
6.a. Geometric reconstruction of the Trasimeno Tectonic Wedge
In the integrated section of Figure 9, the basal thrust of the TTW has a flat-ramp-flat geometry and becomes progressively shallower from west to east. The westernmost flat part of the décollement is located below the carbonates of the Tuscan domain and its depth varies, from west to east, from 4.6 to 3.2 km. The stratigraphy of the Tuscan domain varies accordingly in thickness, from 4 km in the west to c. 1 km in the east. The décollement is warped above the Rentella tectonic unit, and becomes flat in the easternmost part; here, the wedge is detached above the Scaglia Toscana Formation and the décollement shallows towards the east from a depth of c. 3.2 km to c. 1 km. Consequently, the TTW wedge is up to 5 km thick and tapers progressively eastwards.
The TTW geometry and thickness, as reconstructed in the geological cross-section of Figure 9, has been compared with recent thermal burial data (Caricchi et al. Reference Caricchi, Aldega and Corrado2015a) by using a combination of different techniques (x-ray diffraction, vitrinite reflectance, clay minerals crystallinity degrees, and carbon and oxygen stable isotopes analyses). These authors estimate a maximum burial depth decreasing eastwards from 3.7 km for the most internal thrust to 2.3 km, values which are slightly higher than those reconstructed in this study (Fig. 9c, d).
In agreement with Caricchi et al. (Reference Caricchi, Aldega and Corrado2015a), we can hypothesize that a sheet of Ligurian tectonic units originally covered the TTW, tapering towards the east. At present however, in the area crossed by the geological section the Ligurian tectonic units are only exposed in limited outcrops, scattered on the southwestern side of Lake Trasimeno (Fig. 2; Barchi et al. Reference Barchi, Marroni, Barsella, Bizzari, Botti, Meneghini, Pandolfi, Passeri, Pazzaglia, Argenti, Baldanza, Checconi, Ciarapica, Palandri, Venturi, Barsella, Botti, Boscherini, Cenci, Felicioni, Mencaroni, Motti, Natale, Natali, Ponziani, Sorrentino, Simone, Bellucci, Bortoluzzi, Gasperini and Pauselli2010). Much larger outcrops of Ligurian tectonic units are exposed north of the High Tiber Basin (Fig. 2), where emplacement is thought to be due to large-scale gravity sliding in the late stages of the Northern Apennines history (e.g. De Feyter, Reference De Feyter1991). This distribution can be explained either by intrinsic uncertainties in the thermal burial estimations or by the occurrence of syn-tectonic piggyback deposits, once placed upon the Macigno wedge which are today eroded.
After its emplacement, the TTW underwent uplift and erosion, possibly related to both later phases of the orogenic process and to subsequent post-orogenic extension (e.g. Jolivet et al. Reference Jolivet, Faccenna, Goffé, Mattei, Rossetti, Brunet, Fabrizio, Funiciello, Cadet, D’Agostino and Parra1998; D’Agostino et al. Reference D’Agostino, Jackson, Dramis and Funiciello2001). By comparing the geometry of the integrated section with the present-day topography (Fig. 9c), and coherently with the thermal burial data, we can conclude that up to 3 km of rocks have been eroded, mostly consisting of turbidites of the Tuscan domain and possibly an outermost sheet of the Ligurian tectonic unit.
In the attempt to establish the timing of this uplift/erosional stage, it has to be kept in mind that: (1) uplift certainly started after the final TTW emplacement (late Burdigalian); (2) no other sediments of Miocene age are exposed in the study area covering the eroded Macigno turbidites; (3) some sediment stemmed from syn-sedimentary reworking of strata cropping out in the study area, which can be recognized in turbiditic successions exposed between the High Tiber Basin and the main mountain ridge of the Northern Apennines (Umbria pre-Apennines, sensu Bally et al. Reference Bally, Burbi, Cooper and Ghelardoni1986), for example; transversal supply of arcosic or hybrid arenite, as well as olistostromes of Ligurian–Epiligurian provenance, are frequent within the Langhian–Serravallian Marnoso–Arenacea Formation, while the Tortonian and Messinian piggyback basins of the region are constantly filled by turbidites fed from the west (e.g. Alvarez, Reference Alvarez1999); and (4) in the Val di Chiana Basin (e.g. Aruta et al. Reference Aruta, Borgia, Bruni, Cecchi, Cipriani, Tredici, Morini and Bruni2004), as well as in the Lake Trasimeno area (e.g. Gasperini et al. Reference Gasperini, Barchi, Bellucci, Bortoluzzi, Ligi and Pauselli2010), Macigno Formation sandstones are unconformably covered by lower Pliocene marine sediments, whose deposition mark the end of the main uplift/erosion phase. After this time, the region experienced only limited uplift, as indicated by the present-day elevation of both lower Pliocene and lower Pleistocene palaeo-coasts not higher than 400 m above sea level (Ambrosetti et al. Reference Ambrosetti, Carboni, Conti, Constantini, Esu, Gandin, Girotti, Lazzarotto, Mazzanti, Nicosia, Parisi and Sandrelli1978).
The above observations indicate that most of the uplift and erosion of the TTW occurred during late Burdigalian – Messinian time. It is particularly noteworthy that a major erosional phase of the emerged lands of the Palaeo-Apennines was associated with the Messinian salinity crisis that culminated at c. 5.7 Ma (Hsü et al. Reference Hsü, Cita and Ryan1972; Ryan & Cita, Reference Ryan and Cita1978) and led to a dramatic drop of the river base level (e.g. Scarselli et al. Reference Scarselli, Simpson, Allen, Minelli and Gaudenzi2007).
Considering a period of 10 Ma between late Burdigalian and late Messinian time, as well as a thickness of the removed material of c. 3 km, the estimated long-term, averaged erosion rate should be c. 0.3 mm a–1. Bartolini et al. (Reference Bartolini, D’Agostino and Dramis2003) suggested a long-term average exhumation rate for the Northern Apennines of c. 0.7 mm a–1 since 11 Ma. At shorter timescales, Picotti & Pazzaglia (Reference Picotti and Pazzaglia2008) and Wegmann & Pazzaglia (Reference Wegmann and Pazzaglia2009) provided uplift rates of c. 0.2 and 0.5 mm a–1 during 190–140 ka. Using speleological data, Mariani et al. (Reference Mariani, Mainiero, Barchi, Van Der Borg, Vonhof and Montanari2007) estimated an uplift rate of the Apennine ridge of c. 0.6 mm a–1 during Holocene time. Based on an extensive regional apatite (U–Th)/He thermochronometric database augmented by pre-existing apatite fission-track (AFT) data, Thomson et al. (Reference Thomson, Brandon, Reiners, Zattin, Isaacson and Balestrieri2010) measured an exhumation rate for the extending internal, retro-flank of the Apennine orogen of c. 0.3–0.5 mm a–1 over a period of c. 3–5 Ma. These values are in the order of present-day erosion rates (0.2–0.6 mm a–1) determined by means of 10Be concentrations on modern and middle Pleistocene sediments in the Romagna Apennines, NW of the study area (Cyr & Granger, Reference Cyr and Granger2008).
6.b. Two-dimensional restoration and kinematic evolution
The 2D restoration process (Fig. 11) was performed by using the dedicated Move software, following three main working hypotheses: (1) the considered integrated section is parallel to the tectonic transport direction; (2) deformation generally propagated in-sequence, migrating from west to east and acting from the shallowest to the deepest décollement levels (located at the base of the turbidites and of the carbonates/evaporites, respectively); and (3) limited, out-of-sequence reactivation of the shallow structures occurred during deep-seated thrusting, involving the Tuscan carbonates.
2D sequential restoration: (a) present-day; (b) normal faults restoration; (c) restoration of the deep thrusting involving UCE; (d) backwards translation of the TTW, restoration of thrusting affecting TC and the outermost thrust faults; (e) restoration of REN; (f) final backwards translation of the TTW; and (g) restoration and unfolding of the internal imbrication within the TTW.

During the 2D restoration process, we tried to adopt the most appropriate algorithms for the different tectonic structures. Firstly, the most recent extensional faults were retro-deformed by using the ‘Simple Shear’ algorithm (e.g. Verrall, Reference Verrall1981; Gibbs, Reference Gibbs1983; Withjack & Peterson, Reference Withjack and Peterson1993); subsequently, the older compressional faults and the related folds were restored by using the ‘Fault Parallel Flow’ algorithm for the thrust faults (e.g. Egan et al. Reference Egan, Buddin, Kane and Williams1997) and the ‘Flexural-slip Unfolding’ algorithm (e.g. Gratier et al. Reference Gratier, Guillier, Delorme and Odonne1991; Thibert et al. Reference Thibert, Gratier and Morvan2005) to eliminate slight, residual undulations after the thrust restoration.
The shortening of the TTW was measured by focusing on two distinct processes: the internal imbrication of the allochthonous Tuscan tectonic units (i.e. Macigno and Scaglia Toscana formations) and their eastwards emplacement over the Rentella intermediate domain and the Umbria–Marche domain above the basal décollement. In the geometric reconstruction, c. 20 km (40%) of shortening, measured along the Scaglia Toscana Formation, was achieved by internal imbrication of the wedge, taking into account a final length (l) of 30 km and an initial length (l 0) of 50 km (Fig. 11c–g). Across the wedge, shortening associated with the single thrust units decreases towards the frontal thrust fault (i.e. eastwards) from values of c. 7 km in the western part of the wedge to values of c. 1 km in the eastern part (Table 2). Note that the basal décollement deepens westwards so that the lower carbonate unit of the Tuscan domain is involved in the westernmost thrusts (e.g. T2 and T3).
Components of the total bulk shortening (60 km) measured along the integrated section. BD – basal décollement; REN – Rentella tectonic unit; UCE – Umbrian carbonates and evaporites.

Simultaneously, or soon after its internal imbrication (Fig. 11f), the TTW was transported eastwards a further 23 km along its basal décollement, overthrusting the turbidites of the Rentella intermediate tectonic unit (REN) (Fig. 11e) and the innermost Umbrian turbidites (Fig. 11d). Combining these two contributions, the total shortening of the TTW is c. 43 km.
After the final emplacement of the TTW, the tectonic units in its footwall experienced further shortening: the REN was transported over the Umbrian turbidites (Marnoso–Arenacea Formation) for c. 14 km, and the lowermost Umbrian units (carbonates and evaporites) were in turn folded and faulted, with a shortening of c. 3 km (Fig. 11c). Considering this further deformation, the measured total bulk shortening of the integrated geological section is c. 60 km.
In our reconstruction, the intermediate tectonic unit of REN is represented as consisting exclusively of the Rentella Tertiary succession, detached from its original pre-orogenic bedrock. This hypothesis is in agreement with the structural setting observed at the surface by different authors in the area east of the Trasimeno Lake (e.g. Brozzetti et al. Reference Brozzetti, Lucchetti and Pialli2000; Barsella et al. Reference Barsella, Boscherini, Botti, Meneghini, Motti, Palandri, Marroni and Pandolfi2009; Meneghini et al. Reference Meneghini, Botti, Aldega, Boschi, Corrado, Marroni and Pandolfi2012). An analogous structural style is commonly observed in the Northern Apennines, where the syn-orogenic turbidite successions are usually detached from their pre-orogenic substrate through the presence of a major marly décollement, which typically includes the distal clastic succession originally deposited in the forebulge/backbulge (sensu DeCelles & Giles, Reference DeCelles and Giles1996). Examples of such a structural style can be found to the east of the study area where the Serravallian–Tortonian turbidites of the Marnoso–Arenacea Formation overthrust the calcareous units of the Umbria–Marche Apennines Ridge (e.g. Barchi et al. Reference Barchi, Alvarez and Shimabukuro2012), or in the Laga Mountains where the Messinian – lower Pliocene Laga turbidites, detached from their bedrock, overthrust the outermost Acquasanta Anticline (Laga Detachment Zone in Koopman, Reference Koopman1983).
The Monte Santa Maria Tiberina Formation provides an important kinematic constraint because it is recognized to seal the TTW leading edge (see Fig. 4b), postdating the Marne di Vicchio Formation (Lucchetti et al. Reference Lucchetti, Brozzetti, Nini, Nocchi and Rettori2002; Brozzetti, Reference Brozzetti2007). According to this reconstruction, the internal imbrication of the TTW and its emplacement over the Umbrian turbidites occurred between two major sedimentary events, that is, the end of the deposition of the Macigno Formation (late Aquitanian) and the start of the deposition of the Monte Santa Maria Tiberina Formation (late Burdigalian). The emplacement of the TTW therefore occurred during the late Aquitanian – late Burdigalian time interval, corresponding to a duration of c. 5 Ma. This timing is in agreement with the tectonic evolution proposed by Caricchi et al. (Reference Caricchi, Cifelli, Sagnotti, Sani, Speranza and Mattei2014), mainly based on palaeomagnetic data. Considering the total amount of shortening (20 + 23 km = 43 km) and the corresponding timing of deformation (5 Ma), the estimated average deformation rate was c. 8.6 mm a–1. However, it is worth noting that, considering the internal imbrication only, the resulting shortening rate is in the order of 4 mm a–1.
The emplacement of the Rentella intermediate tectonic unit over the turbidites of the Umbria–Marche domain and the internal deformation of carbonates of the Umbria–Marche domain both post-date the emplacement of the TTW. In particular, the deformation of the deep-seated carbonates of the Umbria–Marche domain could be coeval to that of the analogous anticline, responsible for folding the TTW external thrust in the Monte Santa Maria Tiberina area (Brozzetti, Reference Brozzetti2007), which occurred during middle–late Serravallian time, synchronous with the deposition of the Marnoso–Arenacea Formation east of the Tiber Basin (Fig. 2).
A similar structural setting can be observed in the Agri Valley sector of the Southern Apennines, where allochthonous units of Triassic–Palaeogene shallow-water carbonate platform and pelagic basin successions deposited in the Apenninic Platform and Lagonegro Basin, respectively, are completely detached from their original substratum and transported towards the east onto the foreland carbonates of the Apulian Platform, accommodating c. 35% of internal shortening (Mazzoli et al. Reference Mazzoli, Barkham, Cello, Gambini, Mattioni, Shiner and Tondi2001).
6.c. Mechanics
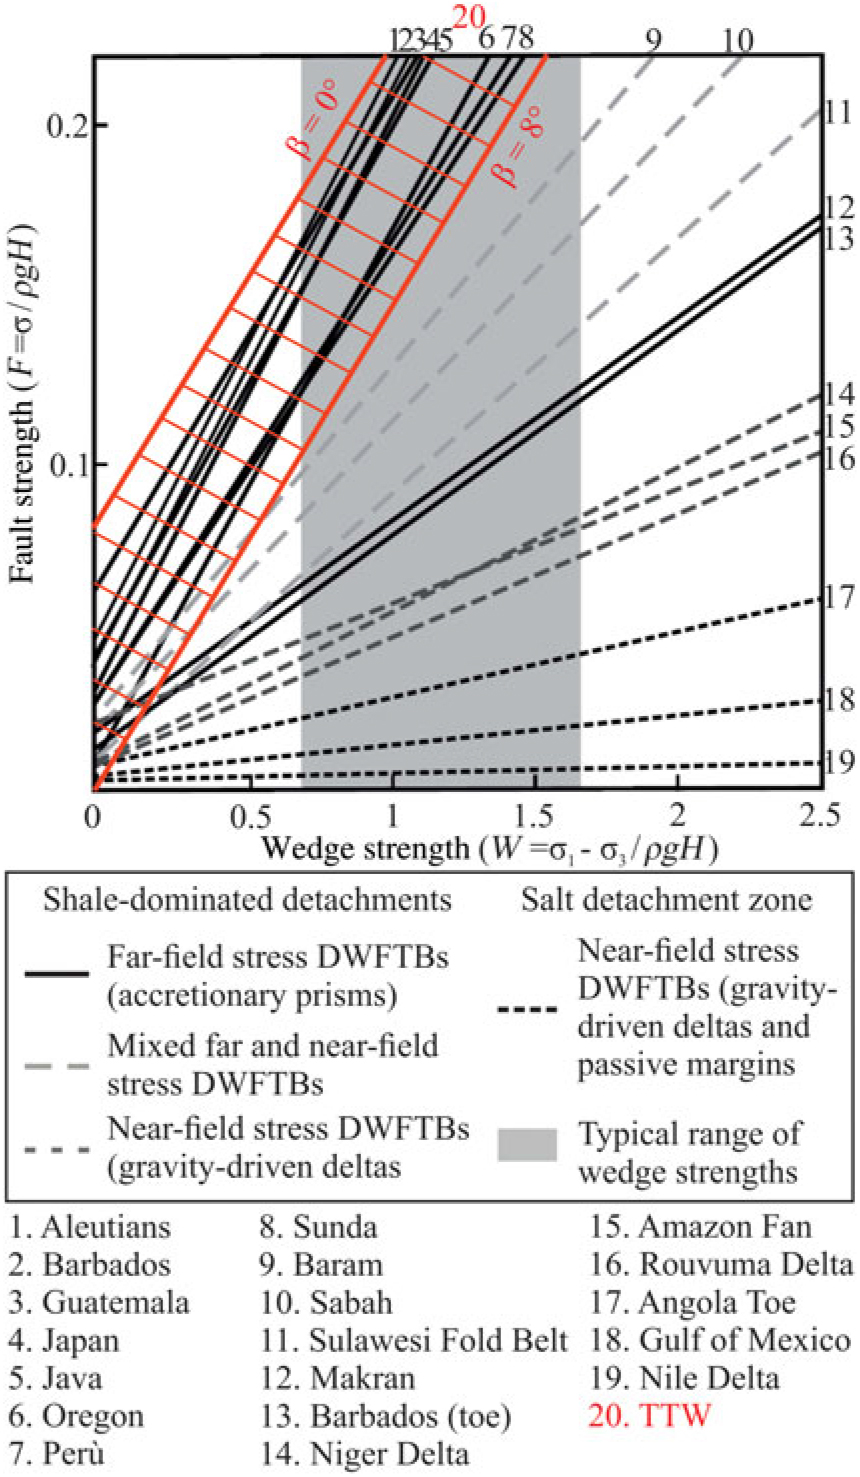
In order to estimate the possible values of fault (F) and wedge (W) strength of the TTW, the values of critical-wedge taper were plotted in an F v. W diagram firstly proposed by Suppe (Reference Suppe2007) and subsequently modified by King & Morley (Reference King and Morley2017), who rearranged the original critical-taper equations (Davis et al. Reference Davis, Suppe and Dahlen1983; Dahlen, Reference Dahlen1990). The F v. W diagram (Fig. 12) constrains all possible values of the two parameters F and W, solely based on the wedge-taper angle measurement, excluding the values of pore pressure and the coefficient of friction. F and W represent the basal detachment strength and the overburden strength (the crust surrounding the faults), respectively.
Plotted values of the TTW critical wedge. The range of values of α and β are 0–8°; considering a critical-taper angle of 8°, this falls within the far-field stress deepwater FTBs field of the plot of fault strength (F) v. wedge strength (W). Modified after King & Morley (Reference King and Morley2017).

Along the regional cross-section (Fig. 9), the measured value of the wedge-taper has an average value of c. 8° with some uncertainties due to its not-planar geometry. In the present-day setting, the dip of the basal décollement (β) is c. 2°, while the top of the wedge slope (α) is c. 6°. However, the geometry of the TTW could have been modified during the uplift, or locally affected and/or tilted by recent extensional tectonics. Mariotti & Doglioni (Reference Mariotti and Doglioni2000) measured the dip angle of the regional monocline all along the present-day frontal part of the Apennines from published seismic data, unpublished industrial seismic data and regional geological balanced cross-sections, suggesting an average β angle of 8° and an almost flat (or even locally hinterland-sloping) top surface. Following these uncertainties, plotting the TTW case study in the diagram of King & Morley (Reference King and Morley2017), all the possible values of α and β ranging from 0 to 8° were considered (Fig. 12). The range of W and F values for the TTW, as expected, falls within the plot field for far-field-stress deepwater FTBs. The same range of values includes several examples of accretionary prisms; this suggests that early-stage foreland FTBs (i.e. the TTW) and accretionary prisms have similar mechanical characteristics concerning, for example, lithological composition or overpressure at the detachment level. The result of the F v. W plot can be compared with the west Nankai, Java, Costa Rica accretionary prisms, for example (see Tesei et al. Reference Tesei, Lacroix and Collettini2015 and King & Morley, Reference King and Morley2017 for reviews), or with foreland FTBs including the Rocky Mountains of Southern Canada and the Mexican FTB of Central Mexico, which show wedge taper angles of 6–8.3° and 5–6.3°, respectively (Fitz-Diaz et al. Reference Fitz-Diaz, Hudleston, Tolson, Poblet and Lisle2011).
7. Conclusions
This study provides new insights into the geometry and kinematics of the TTW, and also into its mechanical behaviour. The seismic interpretation of the TTW shows that (1) its structural style is characterized by a series of thrust faults splaying out from a basal décollement identified as the Scaglia Toscana Formation; (2) its basal décollement shallows eastwards, from a depth of c. 3.2 km to less than 1 km; (3) it was transported over the outermost Rentella and Umbria domains for a distance of more than 20 km; and (4) the Rentella tectonic unit was later superposed onto the autochthonous Umbria–Marche domain, which experienced later folding and thrusting.
The construction of an integrated surface–subsurface section allowed the reconstruction of the original TTW geometry, showing that: (1) the spacing between the imbricated thrust faults, the width, the thickness and the displacement of the tectonic units, as well as the dip angle of each thrust fault, tend to decrease eastwards, which are characteristics of in-sequence deformation; (2) the tectonic wedge was up to 5 km thick in its central-western part and tapers progressively eastwards, thinning to c. 1 km; and (3) the reconstructed wedge-taper angle was c. 8°.
Structural restoration showed that the TTW experienced a total shortening of 43 km, comprising 20 km (40%) of internal imbrication and 23 km of eastward translation above its basal décollement. The shortening, accommodated by each thrust fault, decreases towards the frontal thrust. The emplacement of the TTW is constrained to the late Aquitanian – late Burdigalian time interval, and the calculated average shortening rate is c. 8.6 mm a–1. However, taking into account the internal imbrication only, the calculated average shortening rate is in the order of 4 mm a–1, a value comparable with modern cases of early collisional FTBs (e.g. NW Borneo FTB; Carboni et al. Reference Carboni, Back and Barchi2019). In this context it is important to keep in mind that in modern deepwater FTBs the overall tectonic transport along the basal décollement is often difficult to estimate, producing a likely underestimation of the total bulk shortening of the wedge.
The deeper units at the footwall of the TTW were deformed during Langhian–Serravallian time, with a further shortening of c. 17 km resulting from 14 km eastwards translation of the Rentella tectonic unit and 3 km of internal folding and thrusting within the Umbrian carbonates and evaporites.
If interpreted on the basis of the classification of modern deepwater FTBs (Morley et al. Reference Morley, King, Hillis, Tingay and Backe2011), the TTW is in class 2bi (deepwater contractional wedges formed in response to far-field lithospheric stresses). This interpretation is in line with previous studies of the sedimentary facies and ichnofacies of the TTW turbidites (e.g. Delle Rose et al. Reference Delle Rose, Guerra, Renzulli, Ravasz-Baranyai and Serrano1994; Mutti et al. Reference Mutti, Tinterri, Remacha, Mavilla, Angella and Fava1999; Monaco & Trecci, Reference Monaco and Trecci2014; Amendola et al. Reference Amendola, Perri, Critelli, Monaco, Cirilli, Trecci and Rettori2016) that indicate that the TTW was emplaced in a deepwater environment. Further, the restoration results of this study show high values of internal shortening (40%), an along-dip shortening distribution decreasing towards the frontal thrust (an opposite trend with respect to gravity-driven deepwater FTBs; see Cruciani et al. Reference Cruciani, Barchi, Koyi and Porreca2017) and a high critical wedge-taper (α + β = 8°,) supporting the interpretation of the TTW as a paradigmatic fossil field analogue for modern deepwater FTBs driven by lithospheric stresses.
Author ORCIDs
Filippo Carboni 0000-0002-1868-2447
Acknowledgements
We thank the two anonymous reviewers for their constructive suggestions and comments that improved the manuscript. We are grateful to ENI for allowing the use and partial reproduction of the seismic data this paper is based on. We thank Gianluca Cornamusini and Paolo Conti for the useful discussion about the timing of emplacement of the Trasimeno Tectonic Wedge. Alba Brobia Ansoleaga is kindly acknowledged for her support with the seismic database. We thank Midland Valley for granting the use of the MOVE software under an academic license. The geological and structural maps were drawn with QGIS software using the DEM90 from Earth Env and the bathymetry from NOAA. This research received no specific grant from any funding agency, commercial or not-for-profit sectors.
Declaration of interest
None.