Background
Water has extensive uses in healthcare settings, and if not properly managed, can pose risks to patient safety. Reference Perkins, Reddy, Fagan, Arduino and Perz1 Plumbing systems in healthcare facilities can be complex and susceptible to biofilm formation and growth of Legionella, nontuberculous mycobacteria, and other opportunistic premise plumbing pathogens (OPPPs). 2 All patients are vulnerable to OPPPs; immunocompromised individuals may be more vulnerable to water-related healthcare-associated infections (HAIs). 3 While the exact burden of water-related HAIs is unknown, investigations of outbreaks of water-related HAIs have frequently identified plausible water-exposure pathways linked to infection control lapses. Reference Perkins, Reddy, Fagan, Arduino and Perz1 Between 2015 and 2020, public health officials voluntarily reported 113 waterborne disease outbreaks associated with drinking water in healthcare settings to the Centers for Disease Control and Prevention’s (CDC) National Outbreak Reporting System. However, these reports likely underestimate the burden of water-related HAIs, as many infections may appear to be sporadic and not recognized or reported as outbreaks. Reference Kunz, Lawinger and Miko4
Water management programs (WMPs) can reduce the risk of Legionella and other OPPPs from plumbing systems and have been required since 2017 by the Centers for Medicare & Medicaid Services (CMS) for Medicare-certified hospitals, critical access hospitals (CAHs), and long-term care facilities. 5 Key components include establishing a multidisciplinary team, describing water systems, conducting environmental assessments, implementing monitoring and control measures, and developing protocols for verification, validation, communication, and documentation. 3,6 Healthcare facilities can further strengthen their programs by conducting water infection control risk assessments (WICRAs). 2 Limited data exist to describe how hospitals in the United States have adopted these regulations. Reference Rizzo, Rosenberg and Kim7 This analysis examines the adoption of WMPs, related risk assessment practices, and hospital characteristics associated with conducting these assessments among U.S. hospitals from 2017 through 2022.
Methods
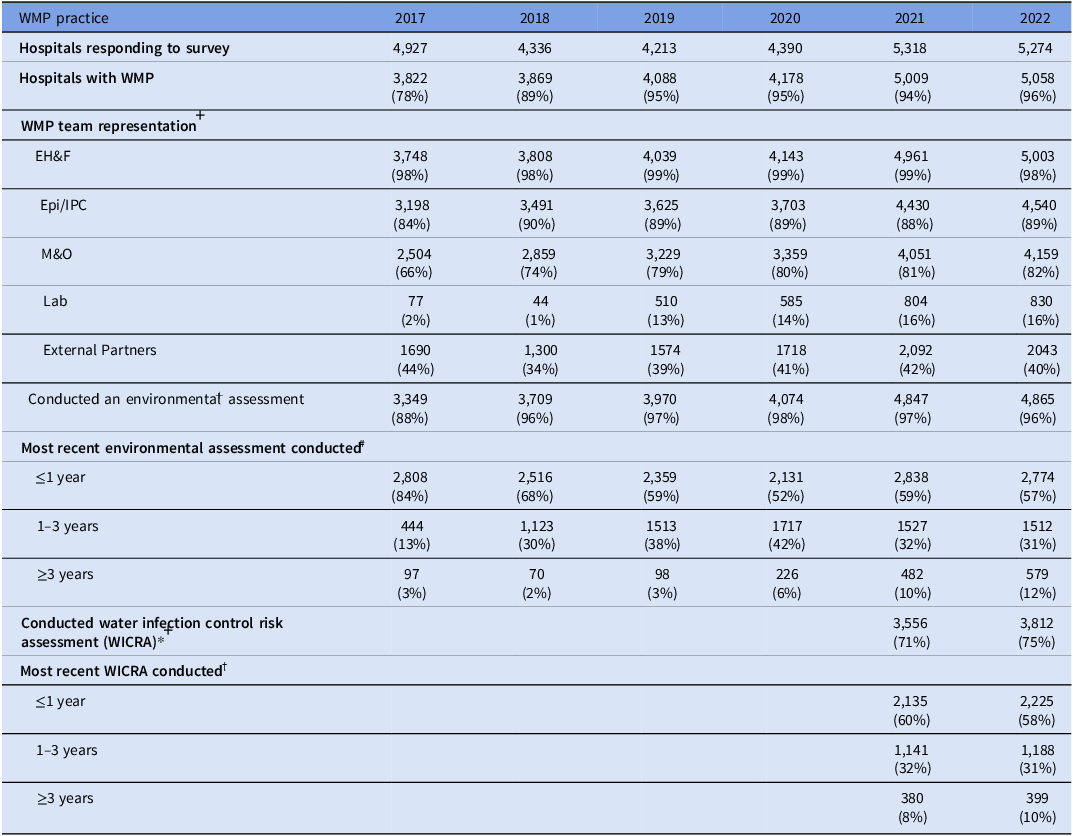
Nearly all acute care hospitals voluntarily report facility characteristics and practices from the previous calendar year to the National Healthcare Safety Network (NHSN) Patient Safety Component (PSC) Annual Hospital Survey. 8 In 2017, three optional WMP-related questions were added. A ‘laboratory personnel’ option was added for WMP team composition in 2019, and questions related to WICRA were added in 2021. Responses categorized under ‘other’ provided additional insights into team composition. WMP-related questions became mandatory in 2021 (see 2022 WMP questions in Supplemental Table 1). Survey responses from 2017 through 2022 were analyzed to describe WMP presence, team composition, completion of environmental assessments, and WICRA practices among hospitals with a WMP (Table 1). WMP team personnel identified in the survey were categorized into five groups: epidemiologist/infection prevention (IPC), management and operation (M&O), environmental health and facility (EH&F), laboratorians, and external partners (Supplemental Table 2).
For hospitals that reported having a WMP in 2022, a multivariable logistic regression model was used to identify facility characteristics associated with conducting WICRAs. Characteristics included bed size, hospital type, Department of Health and Human Services (HHS) region, number of infection preventionists, number of epidemiologists, completion of environmental assessments, and WMP team composition. These were selected based on their relevance to hospital capacity to perform WICRAs. Univariate analyses generated crude risk ratios; variables with statistically significant crude risk ratios (P < .05) were included in the multivariable logistic regression model. The model was validated using bootstrap sampling techniques and backward selection logistic regression. Risk ratios were derived from predicted probabilities from the logistic model; Poisson and log-binomial models were explored but did not converge. Adjusted risk ratios (aRRs) and 95% confidence intervals (CIs) were calculated using SAS software, Version 9.4 for Windows (Copyright © 2002–2012 by SAS Institute Inc.).
Results
In 2022, 96% (5,058) of hospitals reported having a WMP, compared to 78% (3,822) of hospitals in 2017. Respondents represented nearly all U.S. acute care hospitals across all HHS regions. Among the 216 hospitals without WMPs in 2022, 56% were CAHs. Among hospitals with a WMP, EH&F representation remained consistently high (98%) from 2017 through 2022. IPC representation increased from 84% to 89%, and M&O participation rose from 66% to 82%. Laboratorian involvement increased from 2% to 16%. External partner involvement declined from 44% in 2017 to 34% in 2018, then rose to 40% in 2022. Additionally, in 2022, 96% of hospitals with a WMP reported having conducted an environmental assessment (57% within the past year), and 75% had completed WICRAs (58% within the past year) (Table 1).
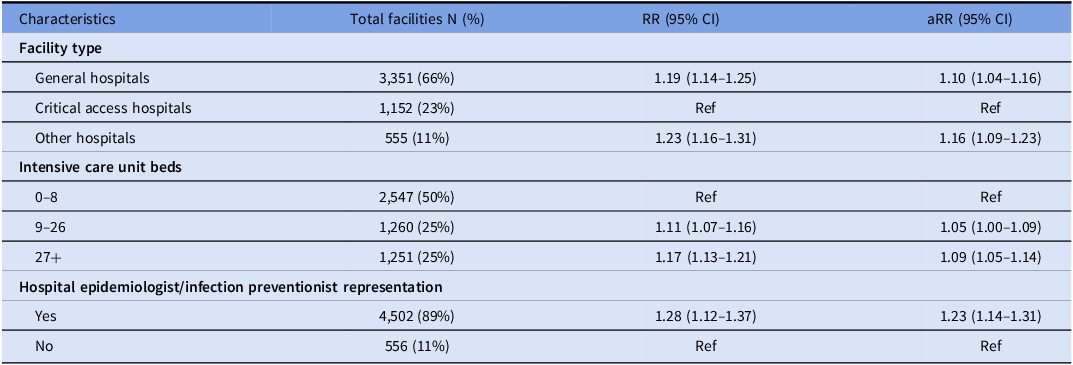
Among hospitals with WMPs in 2022, general hospitals (RR: 1.19; 95% CI: 1.14–1.25) and other hospital types (eg, surgical, children’s, and oncology) (RR: 1.23; 95% CI: 1.16–1.31), were more likely to conduct WICRAs compared to CAHs. Hospitals with 9 to 26 ICU beds (RR: 1.11; 95% CI: 1.07–1.16) and those with 27 or more ICU beds (RR: 1.17; 95% CI: 1.13–1.21) were more likely to conduct WICRAs than hospitals with 0 to 8 ICU beds. The presence of infection preventionist or epidemiologist (IPC) representation on WMP teams was also associated with a higher likelihood of WICRA completion (RR: 1.28; 95% CI: 1.12–1.37). The direction and magnitude of associations remained stable in the multivariable model, indicating no substantial confounding (Table 2).
Discussion
The 2022 NHSN PSC Annual Hospital Survey revealed that most U.S. hospitals reported having a WMP, reflecting substantial adoption following the 2017 CMS requirement. This finding suggests that smaller, rural hospitals may face staffing shortages or lack the resources required for implementing a WMP. Reference Soma, Scebold and Vasa9 Only 75% of hospitals with WMPs reported conducting WICRAs by 2022, with 58% conducting one within the past year. These hospitals tend to have more ICU beds and infection control expertise, suggesting that resource availability and infection prevention capacity may influence WICRA adoption.
Effective implementation of a WMP depends on adequate staffing, monitoring and control strategies, and risk assessments. 6,3 WMPs often include multidisciplinary teams supported by hospital leadership. Increased M&O representation on WMP teams from 2017 through 2022 may reflect greater commitment to water quality and patient safety. WMP validation is crucial, yet only 16% of hospitals reported laboratory staff involvement in 2022. Laboratory staff may support WMP validation by identifying OPPP in clinical specimens or coordinating with external laboratories for environmental testing. At minimum, a WMP team should include management, engineering, infection prevention, environmental services, and department heads. 2,3
The presence of OPPPs in water systems alone is insufficient to cause disease. 3 Other factors, such as transmission modes and patient susceptibility, contribute to infection risk. Reference Perkins, Reddy, Fagan, Arduino and Perz1 CDC’s WICRA tool can help hospitals identify exposure pathways and prioritize infection control strategies (eg, avoiding placement of patient care items near sinks).
Hospitals with limited resources may need to prioritize WMP activities or develop creative strategies to strengthen their WMPs. Increasing awareness of tools such as the WICRA, along with training and technical support, may help improve uptake of risk assessment practices, particularly in resource-limited hospitals. Routine auditing and verification of WMPs can support implementation and quality improvement.
Several limitations should be considered in interpreting this analysis. Self-reported data may introduce bias (eg, recall, reporting, misclassification). Additionally, WMP questions were not mandatory until 2021, which complicates comparisons across earlier years. Extrapolation of laboratory personnel involvement from free-text responses prior to 2019 could have led to underreporting. Risk ratios derived from logistic regression may slightly overestimate associations, and preferred RR models did not converge.
While the increase in hospitals reporting WMP implementation is encouraging, further research is needed to understand barriers faced by different hospital types. This information could inform public health efforts to provide targeted tools, resources, and technical support. Improved understanding of barriers to WMP implementation could help hospitals implement evidence-based, tailored strategies to enhance patient safety and water system performance. A comprehensive approach that combines environmental and infection control strategies is important for preventing water-related HAIs.
Supplementary material
The supplementary material for this article can be found at https://doi.org/10.1017/ice.2026.10409.
Acknowledgments
The authors would like to thank all the hospitals and water management program teams that responded to the NHSN Annual Hospital Survey from 2017 through 2022. Financial support: none reported. All authors report no conflicts of interest relevant to this article.
CDC disclaimer
The findings and conclusions in this email are those of the author(s) and do not necessarily represent the official position of the Centers for Disease Control and Prevention/the Agency for Toxic Substances and Disease Registry.
Appendix
Water management program (WMP) practices by reporting year among U.S. hospitals responding to the National Healthcare Safety Network Annual Patient Safety Survey, 2017–2022

Table 1 Long description
The table presents data on water management program (WMP) practices among U.S. hospitals from 2017 to 2022. It includes information on the number of hospitals responding to the survey, hospitals with WMP, and WMP team representation across various categories. The categories include environmental health and facility (EHF), epidemiologist/infection prevention (Epi/IPC), management and operation (M&O), laboratory (Lab), and external partners. The table also shows the percentage of hospitals that conducted an environmental assessment and the most recent environmental assessment conducted within different time frames. Additionally, it includes data on the most recent water infection control risk assessment (WICRA) conducted. The table highlights trends and changes in WMP practices over the years, with notable increases in the number of hospitals with WMP and the representation of different team members. The data indicates a growing emphasis on environmental assessments and WICRA practices among hospitals.
Notes: Water Management Program
(WMP), Environmental Health and Facilities
(EH&F), Hospital Epidemiologist or Infection Preventionist
(Epi/IPC), Management & Operations
(M&O), laboratorians
(Lab), Water Infection Control Risk Assessment
(WICRA). The laboratory personnel option was added in the 2019 survey; 2017 and 2018 data were extrapolated from free text responses under “other”.
+Percent calculated based on hospitals that reported having a WMP.
#Percent calculated based on hospitals that have completed an environmental assessment. *WICRA questions were added in 2021.
†Percent calculated based on hospitals that have conducted a WICRA.
Water infection control risk assessment by hospital characteristics, 2022

Table 2 Long description
A table with four rows and three columns presents data on water infection control risk assessment by hospital characteristics in 2022. The table includes characteristics such as facility type, intensive care unit beds, and hospital epidemiologist/infection preventionist representation. For facility type, general hospitals and other hospitals show higher relative risk (RR) of conducting water infection control risk assessments (WICRAs) compared to critical access hospitals. Hospitals with 9 to 26 ICU beds and those with 27 or more ICU beds have a higher likelihood of conducting WICRAs than hospitals with 0 to 8 ICU beds. The presence of infection preventionist or epidemiologist representation is associated with a higher likelihood of WICRA completion. The table provides RR values and adjusted RR values with 95% confidence intervals for each characteristic.
Note: RR = crude risk ratio; aRR = adjusted risk ratio; Ref = reference group; other hospitals (ie, surgical, psychiatric, children’s, veterans affairs, military, orthopedic, oncology, women’s).