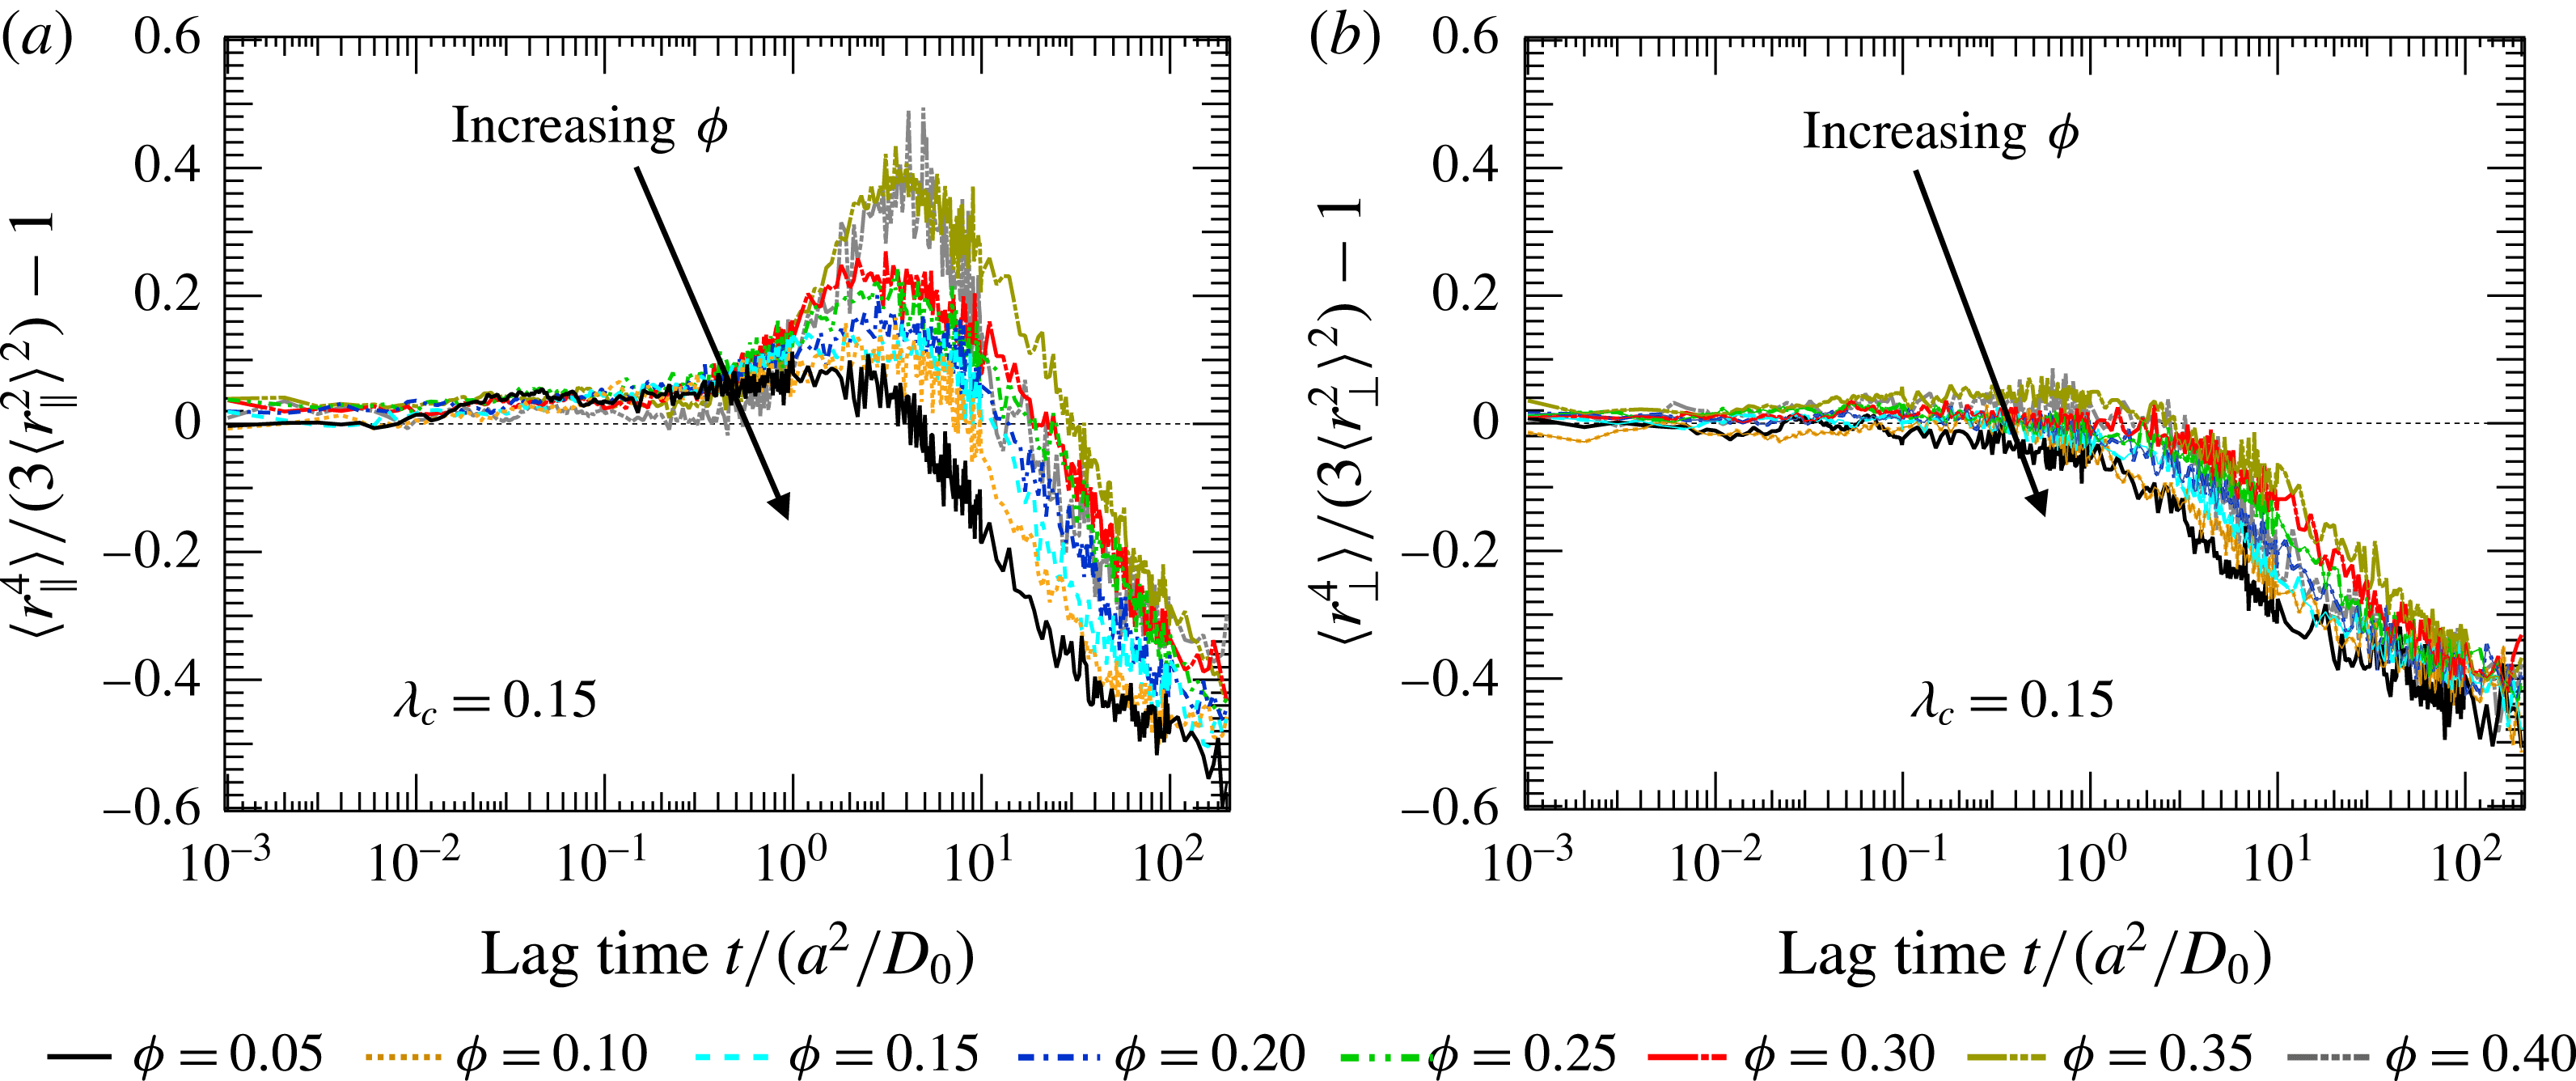
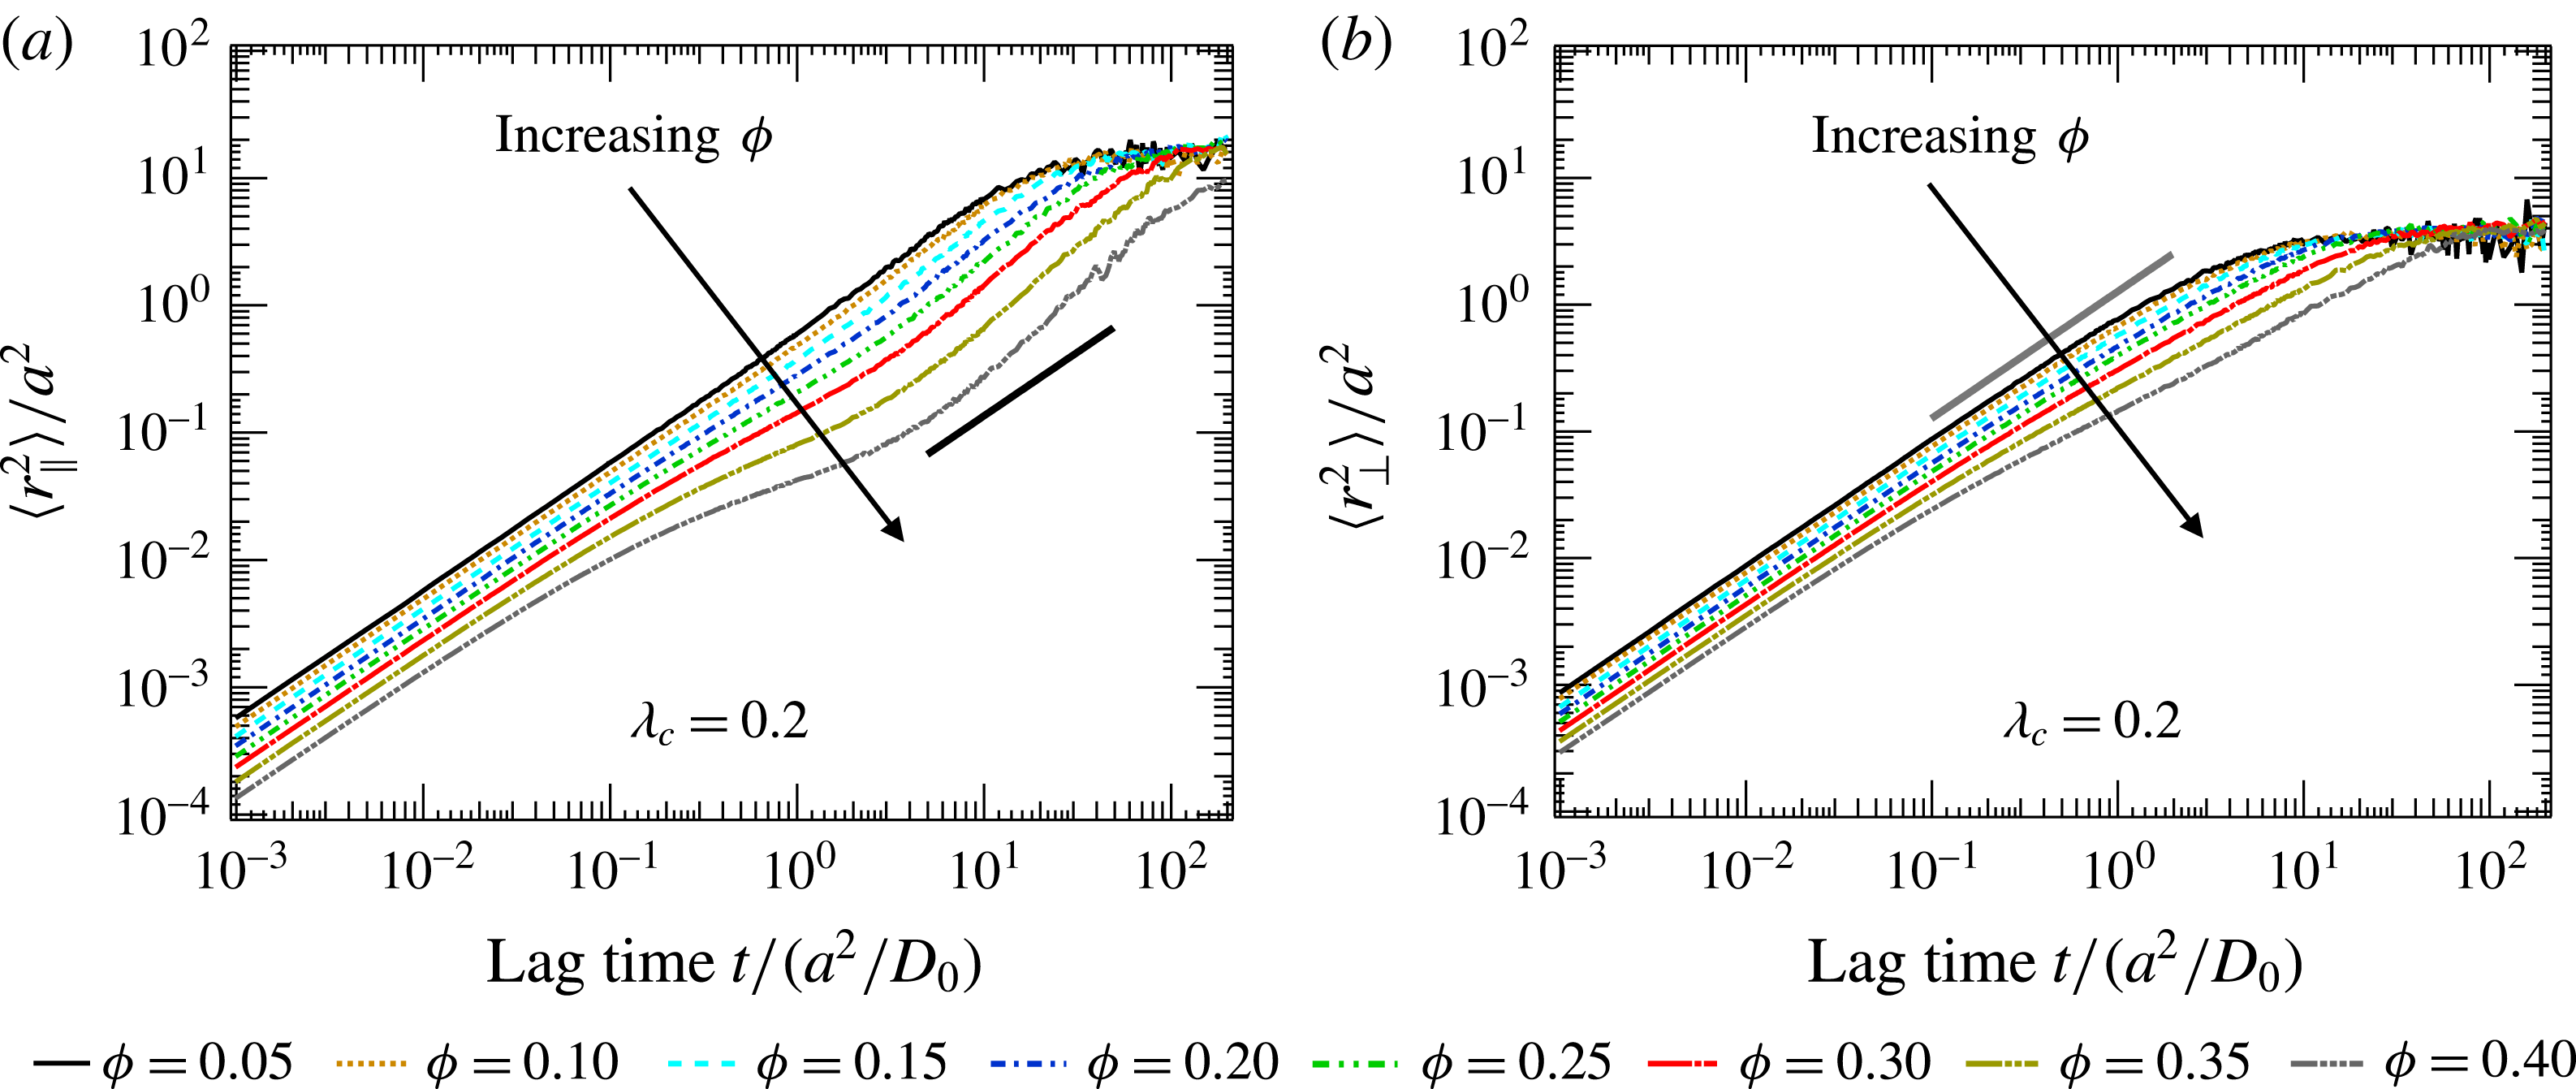
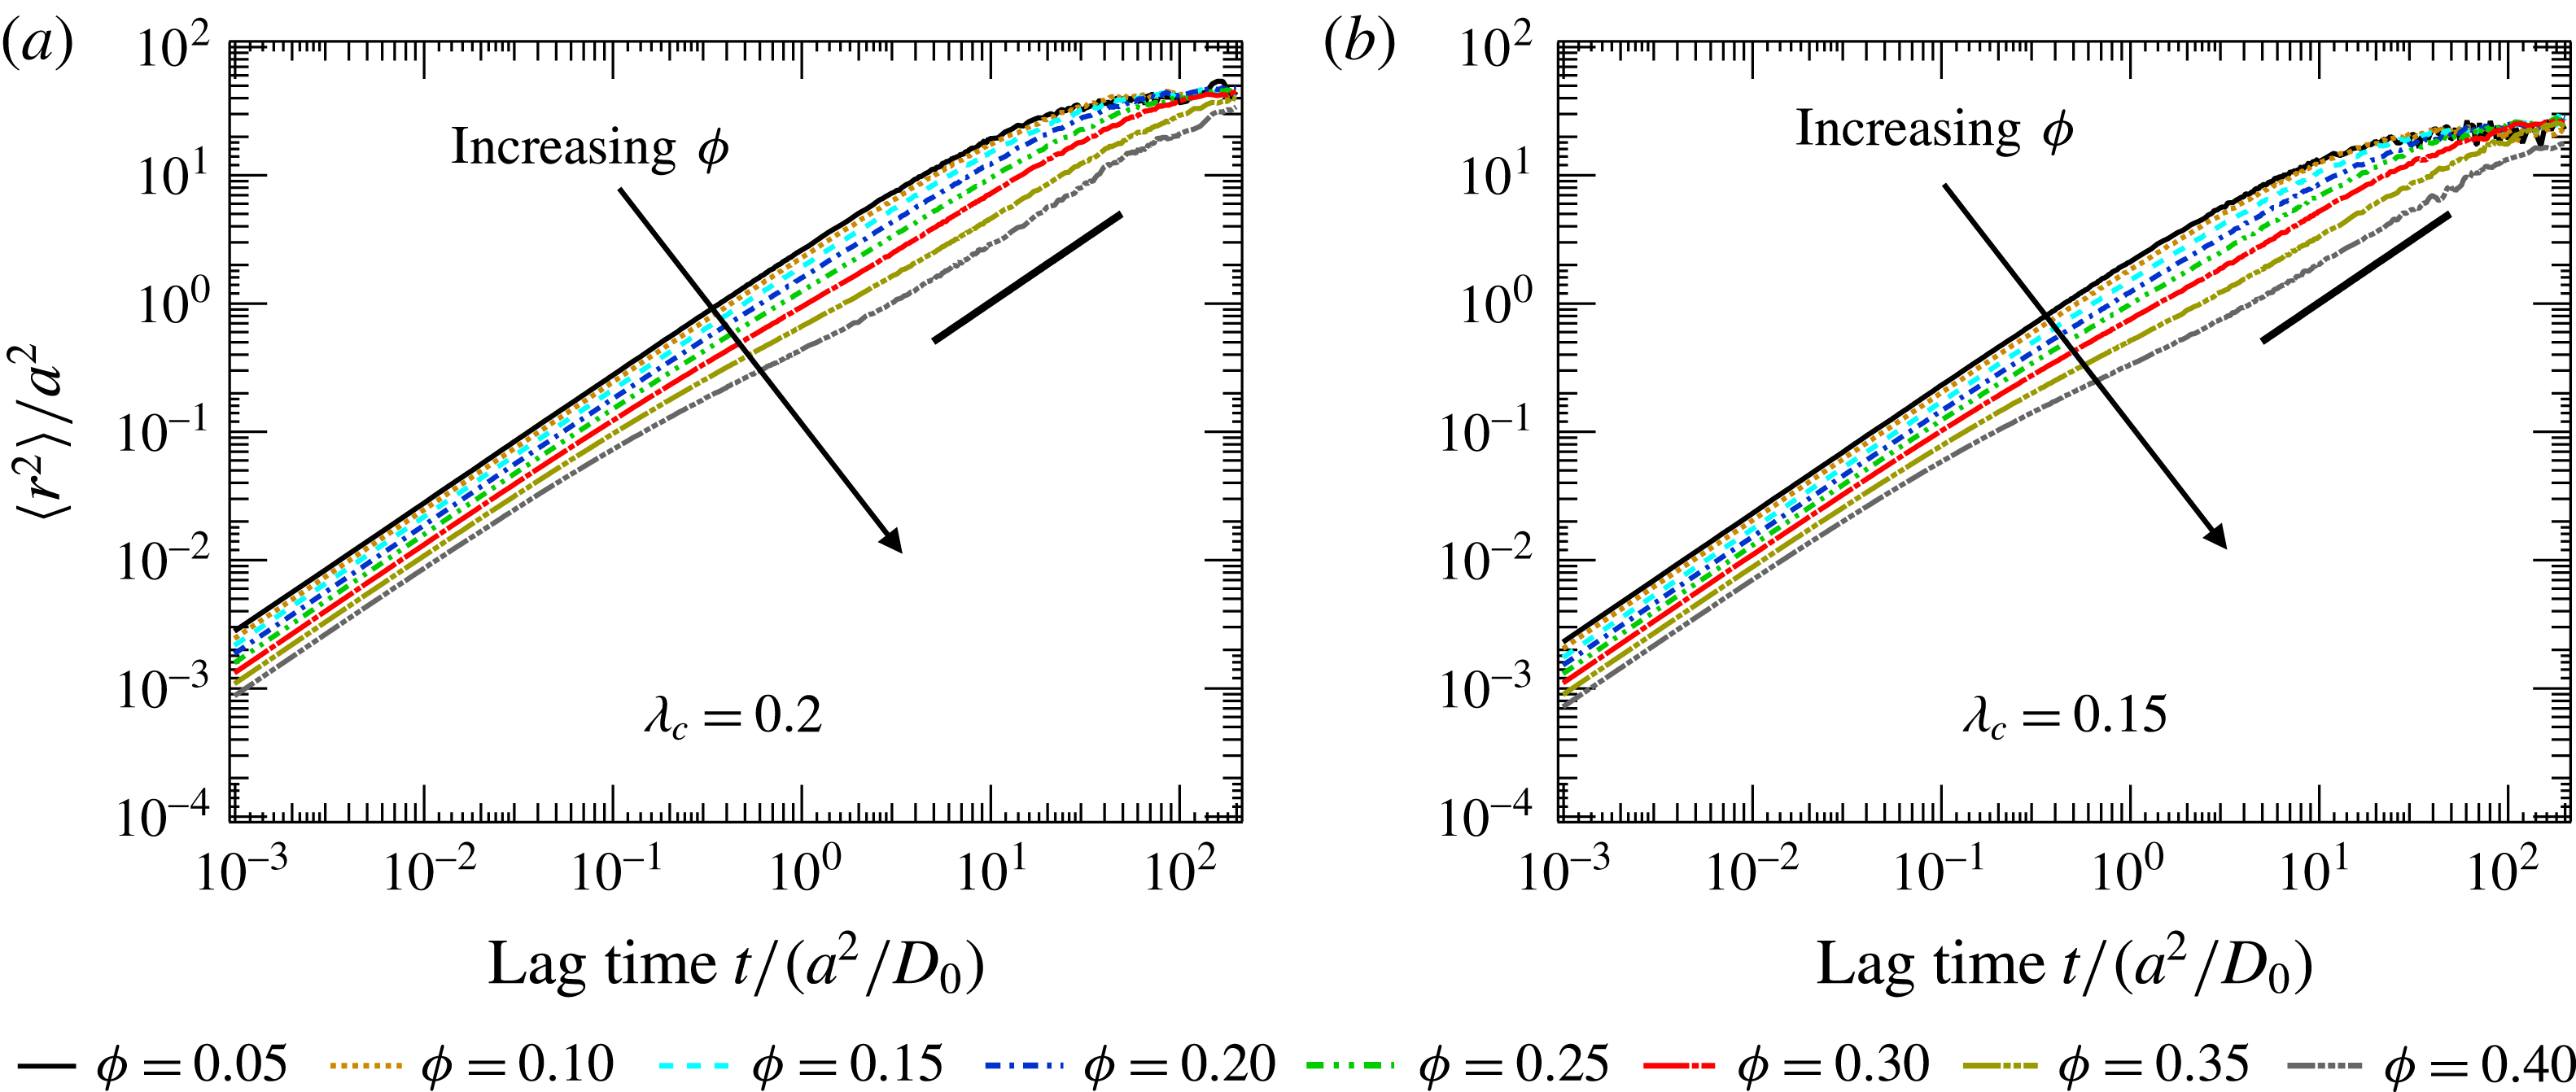
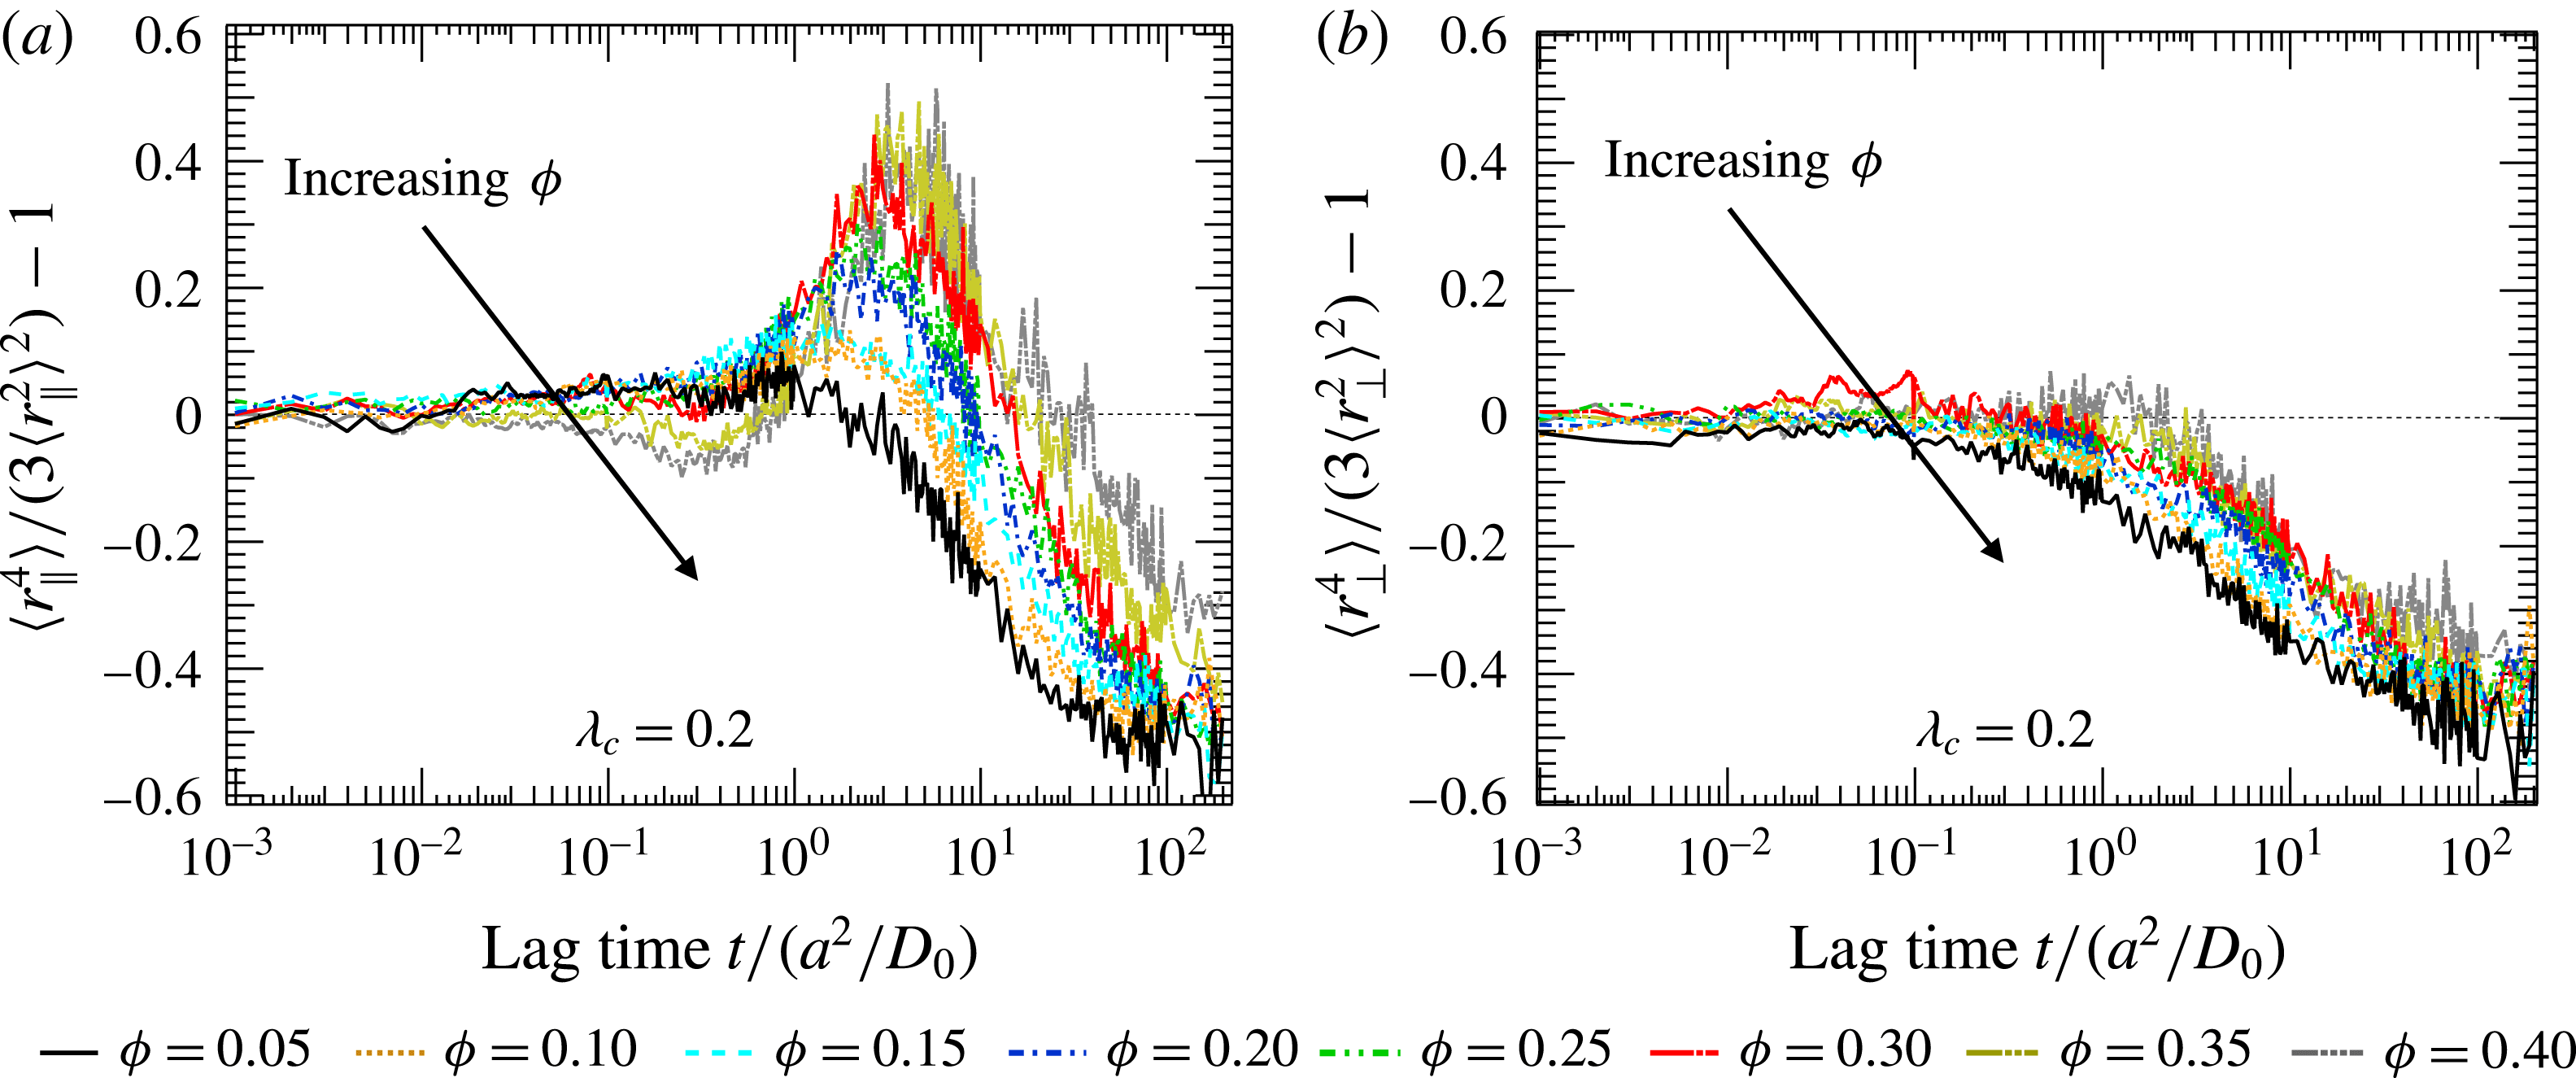
1 Introduction
The emergent interest in the development of predictive models for transport in and rheological properties of microconfined colloidal suspensions is motivated in part by the degree to which they represent such behaviour in confined biophysical suspensions. Eukaryotic cells are an important example for which mechanical transport has been shown to play a critical role in system function, where, e.g., reports of anomalous diffusion vary widely in measurement and explanation (Golden Reference Golden2000; Verkman Reference Verkman2002; Wodarz Reference Wodarz2002; Gönczy & Rose Reference Gönczy and Rose2005; Crocker & Hoffman Reference Crocker and Hoffman2007; Brangwynne et al. Reference Brangwynne, Koenderink, MacKintosh and Weitz2009). These confined biophysical systems are typically crowded watery suspensions of microscopic particles undergoing a variety of transport processes as they interact with one another and the confining wall. Thermal fluctuations are a primary source of particle motion in such systems, but the combined effects of crowding and 3D confinement on such Brownian motion have thus far not been extensively studied. The presence of a confining boundary introduces new length scales into a suspension, in contrast to unbound suspensions, where Brownian motion gives rises to three well-defined diffusive regimes set only by the particle length scale (Batchelor Reference Batchelor1976, Reference Batchelor1982; Rallison & Hinch Reference Rallison and Hinch1986; Brady Reference Brady1994). Short-time self-diffusion of a particle occurs over length scales not even a fraction of the particle size, without disturbing the positions of its neighbours. At intermediate times, its motion becomes correlated and subdiffusive as it exchanges places with its neighbours. At long times, it exchanges places with its neighbours many times, executing a random walk through the suspension as it undergoes long-time self-diffusion (Brady Reference Brady1994). Introduction of a confining boundary introduces a new length scale over which such interactions take place. This in turn influences the micro-structural configuration, particle dynamics and particle transport (Brenner Reference Brenner1961; Leighton & Acrivos Reference Leighton and Acrivos1987). Accurate modelling of transport processes spanning these different temporal regimes in confined crowded hydrodynamically interacting particulate systems must address many-body interactions between the particles, and interactions between the particles and the confining boundary, and account for the time scales over which such processes take place.
Prior attempts to model such transport in spherically confined suspensions (Tough & van den Broeck Reference Tough and van den Broeck1989; Bickel Reference Bickel2007) have focused on one or two of these features, but none have successfully modelled all three. While numerous methods of accounting for many-body hydrodynamic interactions in suspensions have been employed successfully in the study of monodisperse and polydisperse suspensions in unconfined domains (Brady & Bossis Reference Brady and Bossis1988; Hoogerbrugge & Koelman Reference Hoogerbrugge and Koelman1992; Ladd Reference Ladd1994; Sierou & Brady Reference Sierou and Brady2001), cylindrical confinement (Bhattacharya, Mishra & Bhattacharya Reference Bhattacharya, Mishra and Bhattacharya2010; Navardi & Bhattacharya Reference Navardi and Bhattacharya2010; Navardi, Bhattacharya & Wu Reference Navardi, Bhattacharya and Wu2015) and parallel wall confinement (Bhattacharya Reference Bhattacharya2008; Swan & Brady Reference Swan and Brady2010, Reference Swan and Brady2011a ,Reference Swan and Brady b ), recent attempts to apply such models to study intracellular transport have neglected many-body hydrodynamic interactions entirely, modelling only pairwise interactions. This choice is typically motivated by large computational expense and justified by the claim that such interactions can be included in a mean-field sense via an adjustable parameter or neglected entirely.
In a recent example, McGuffee & Elcock (Reference McGuffee and Elcock2010) modelled green fluorescent protein (GFP) motion in prokaryotic cells as a collection of spheres in an unbounded Newtonian solvent, restricting particle interactions to a pairwise electrostatic potential. While the model did recover the expected linear growth in time of the mean-square displacement, the long-time self-diffusion coefficients were four or five times larger than those observed in experimental measurements. The authors interpreted the discrepancy as a result of attractive hydrophobic interactions neglected in their electrostatic potential. To counteract this effect, they added a Lennard-Jones potential with a potential-well depth as an adjustable parameter to tune the long-time diffusion coefficient obtained in simulation until it matched the experimental results. Such ad hoc modification slows the diffusive motion, but limits the predictive value of the model and may mask the fundamental influence of hydrodynamic interactions. The simplification was justified based on a previous work that suggested a simple renormalization: that at biophysically relevant concentrations (volume fractions
 $10\,\%\,\sim \,\unicode[STIX]{x1D719}\,\sim \,40\,\%$
), hydrodynamic interactions reduce the long-time self-diffusivity measured in Brownian dynamics simulations of freely draining spheres by approximately
 $50\,\%$
(Sun & Weinstein Reference Sun and Weinstein2007), a small reduction compared with the four- to fivefold reduction required by McGuffee & Elcock (Reference McGuffee and Elcock2010). The discrepancy may arise from two key aspects of the Sun & Weinstein simulation study that were not considered by McGuffee & Elcock. First, Sun & Weinstein neglected confinement entirely. We will show in this work that this simplification leads to qualitative errors in the diffusive behaviour. Second, the hydrodynamically interacting suspension in the study by Sun & Weinstein was monodisperse, but it was polydisperse in the model of McGuffee & Elcock; the relative particle mobility is strongly dependent on the relative size (Jeffrey & Onishi Reference Jeffrey and Onishi1984), and the long-time self-diffusivity can exhibit qualitative changes when the size ratios are disparate (Batchelor Reference Batchelor1982; Hoh & Zia Reference Hoh and Zia2016b
). These two factors suggest that hydrodynamic interactions would exert a much stronger influence on the motion of GFP than originally hypothesized by the authors. While these studies advance the idea that crowding exerts an important influence on the dynamics of the cell interior, the neglect of hydrodynamic interactions limits their applicability.
In a more recent attempt to study the effect of polydispersity on GFP diffusion in a prokaryotic cell, Ando & Skolnick (Reference Ando and Skolnick2010) modelled many-body hydrodynamic interactions in a polydisperse suspension, neglecting confinement, utilizing Stokesian dynamics simulations. These authors calculated the long-time self-diffusivity, finding reasonable agreement with diffusion coefficients for GFP measured in vivo. Their incorporation of many-body hydrodynamic interactions resolved the fivefold error of McGuffee & Elcock (Reference McGuffee and Elcock2010), a finding that confirms the importance of hydrodynamic interactions in biophysical systems. It would be tempting to conclude that confinement exerts no influence, but it is important to recognize that the confining cavity of actual E. Coli. cells is
 $500$
–
 $2000$
times the size of the particles. That is, the in vivo behaviour was essentially studied in the limit of an unbound suspension. Perhaps the most appropriate interpretation is that many-body hydrodynamic interactions matter and that confinement can sometimes be neglected, but only when the boundary is very far away – e.g. very small particles away from the cell wall.
More recent studies have attempted to model the effects of boundaries. As with unbound systems, most models simply neglect many-body hydrodynamic interactions, which can be appropriate in limited circumstances. For example, Weber, Theriot & Spakowitz (Reference Weber, Theriot and Spakowitz2010) simulated a passively diffusing spherically confined polymer chain using a Rouse-like bead–spring model, where hydrodynamic interactions are neglected on the basis that they can be screened in concentrated polymer solutions (de Gennes Reference de Gennes1976). This is an excellent approximation when particles exert a net force on the fluid over, e.g., the chain length scale, due to their fixed position constraint by the chain, permitting the use of the Rouse model. However, the effect of hydrodynamic interactions can become important in systems with low to moderate polymer concentration (de Gennes Reference de Gennes1976). Indeed, the impact of hydrodynamic interactions on the behaviour of confined polymer solutions remains an open question, important for understanding their dynamics in the dilute and semidilute regime, where their motion is not expected to follow Rouse dynamics over all length and time scales (Ahlrichs, Everaers & Dünweg Reference Ahlrichs, Everaers and Dünweg2001; Colby Reference Colby2010). While these studies set a foundation for understanding the role of confinement and particle interactions in biophysical transport, the neglect of many-body hydrodynamic interactions limits their applicability to biophysical systems of non-freely diffusing particles or long particle chains that obey Rouse dynamics.
In an effort to include the combined effects of hydrodynamics and the presence of an enclosure, other studies have opted to neglect Brownian motion and crowding. Shinar et al. (Reference Shinar, Mana, Piano and Shelley2011) modelled pronuclear migration during fertilization of an eukaryotic cell via an immersed-boundary method, which permitted detailed modelling of a spheroidal cavity. The pronucleus was modelled as a spherical particle and was immersed in a Newtonian fluid (cytoplasm). These authors showed that the presence of an enclosure significantly increases the hydrodynamic drag force on the nucleus, and that the dynamic behaviour of microtubules produces complex cytoplasmic flows. These results highlight the importance of confinement on intracellular transport and particle-motion-induced flow. However, the interplay between Brownian motion and hydrodynamic forces is well known to lead to important deterministic forces and non-Newtonian effects that are relevant in such microtubule-driven flow. By neglecting Brownian motion in the model, these effects and their influence on, e.g., osmotic pressure and effective cell ‘temperature’ (Lau et al. Reference Lau, Hoffman, Davies, Crocker and Lubensky2003) are lost.
In a more recent approach to modelling crowding, many-body interactions and confinement, Chow & Skolnick (Reference Chow and Skolnick2015) circumvented detailed hydrodynamic modelling of the boundary by simply building a large spherical shell from small individual particles. The size of the spherical ‘bricks’ from which the cavity wall was constructed was the same as that of the particles placed inside the cavity. Unfortunately, such cavities are inherently leaky: as long as the ‘bricks’ have finite size, it is impossible to avoid gaps through which solvent can flow. For example, the highest possible packing density for the spheres, hexagonal packing, is less than
 $91\,\%$
, meaning that at a minimum 10 % of the surface permits leaks. This would lead to an underprediction of the hydrodynamic coupling between the particles and the wall. Beyond this inaccuracy, another disadvantage of approximating the boundary as a collection of spheres is the increased computational cost of having to model
 $N+N_{b}$
particles, where
 $N$
is the number of enclosed particles of interest and
 $N_{b}$
is the number of particles that make up the boundary – the latter of which cannot be used to calculate dynamical properties. This computational cost diverges as the cavity gets large because
 $N_{b}\sim (R/a_{b})^{2}$
, where
 $a_{b}$
is the radius of the boundary particles and
 $R$
is the radius of the approximate spherical cavity. While the study did report that the enclosure slowed the particle velocity, no diffusion coefficients were reported. The authors hypothesized that, if they could measure diffusion, it would be reduced by confinement, and claimed that the long-time behaviour of the suspension yields no useful information, given that at long enough times, the mean-square displacement of the particles will reach a plateau with a value related to the cavity size (Tough & van den Broeck Reference Tough and van den Broeck1989). In consequence, the simulations conducted were too short to observe the long-time behaviour. As will be shown in the present work, the mean-square displacement of concentrated spherically confined suspensions shows a rich set of behaviours at short and intermediate lag times, such as anisotropy, position dependence and anomalous transport. Such behaviours motivate the need for a more careful consideration of the diffusive temporal regimes in 3D-confined suspensions.
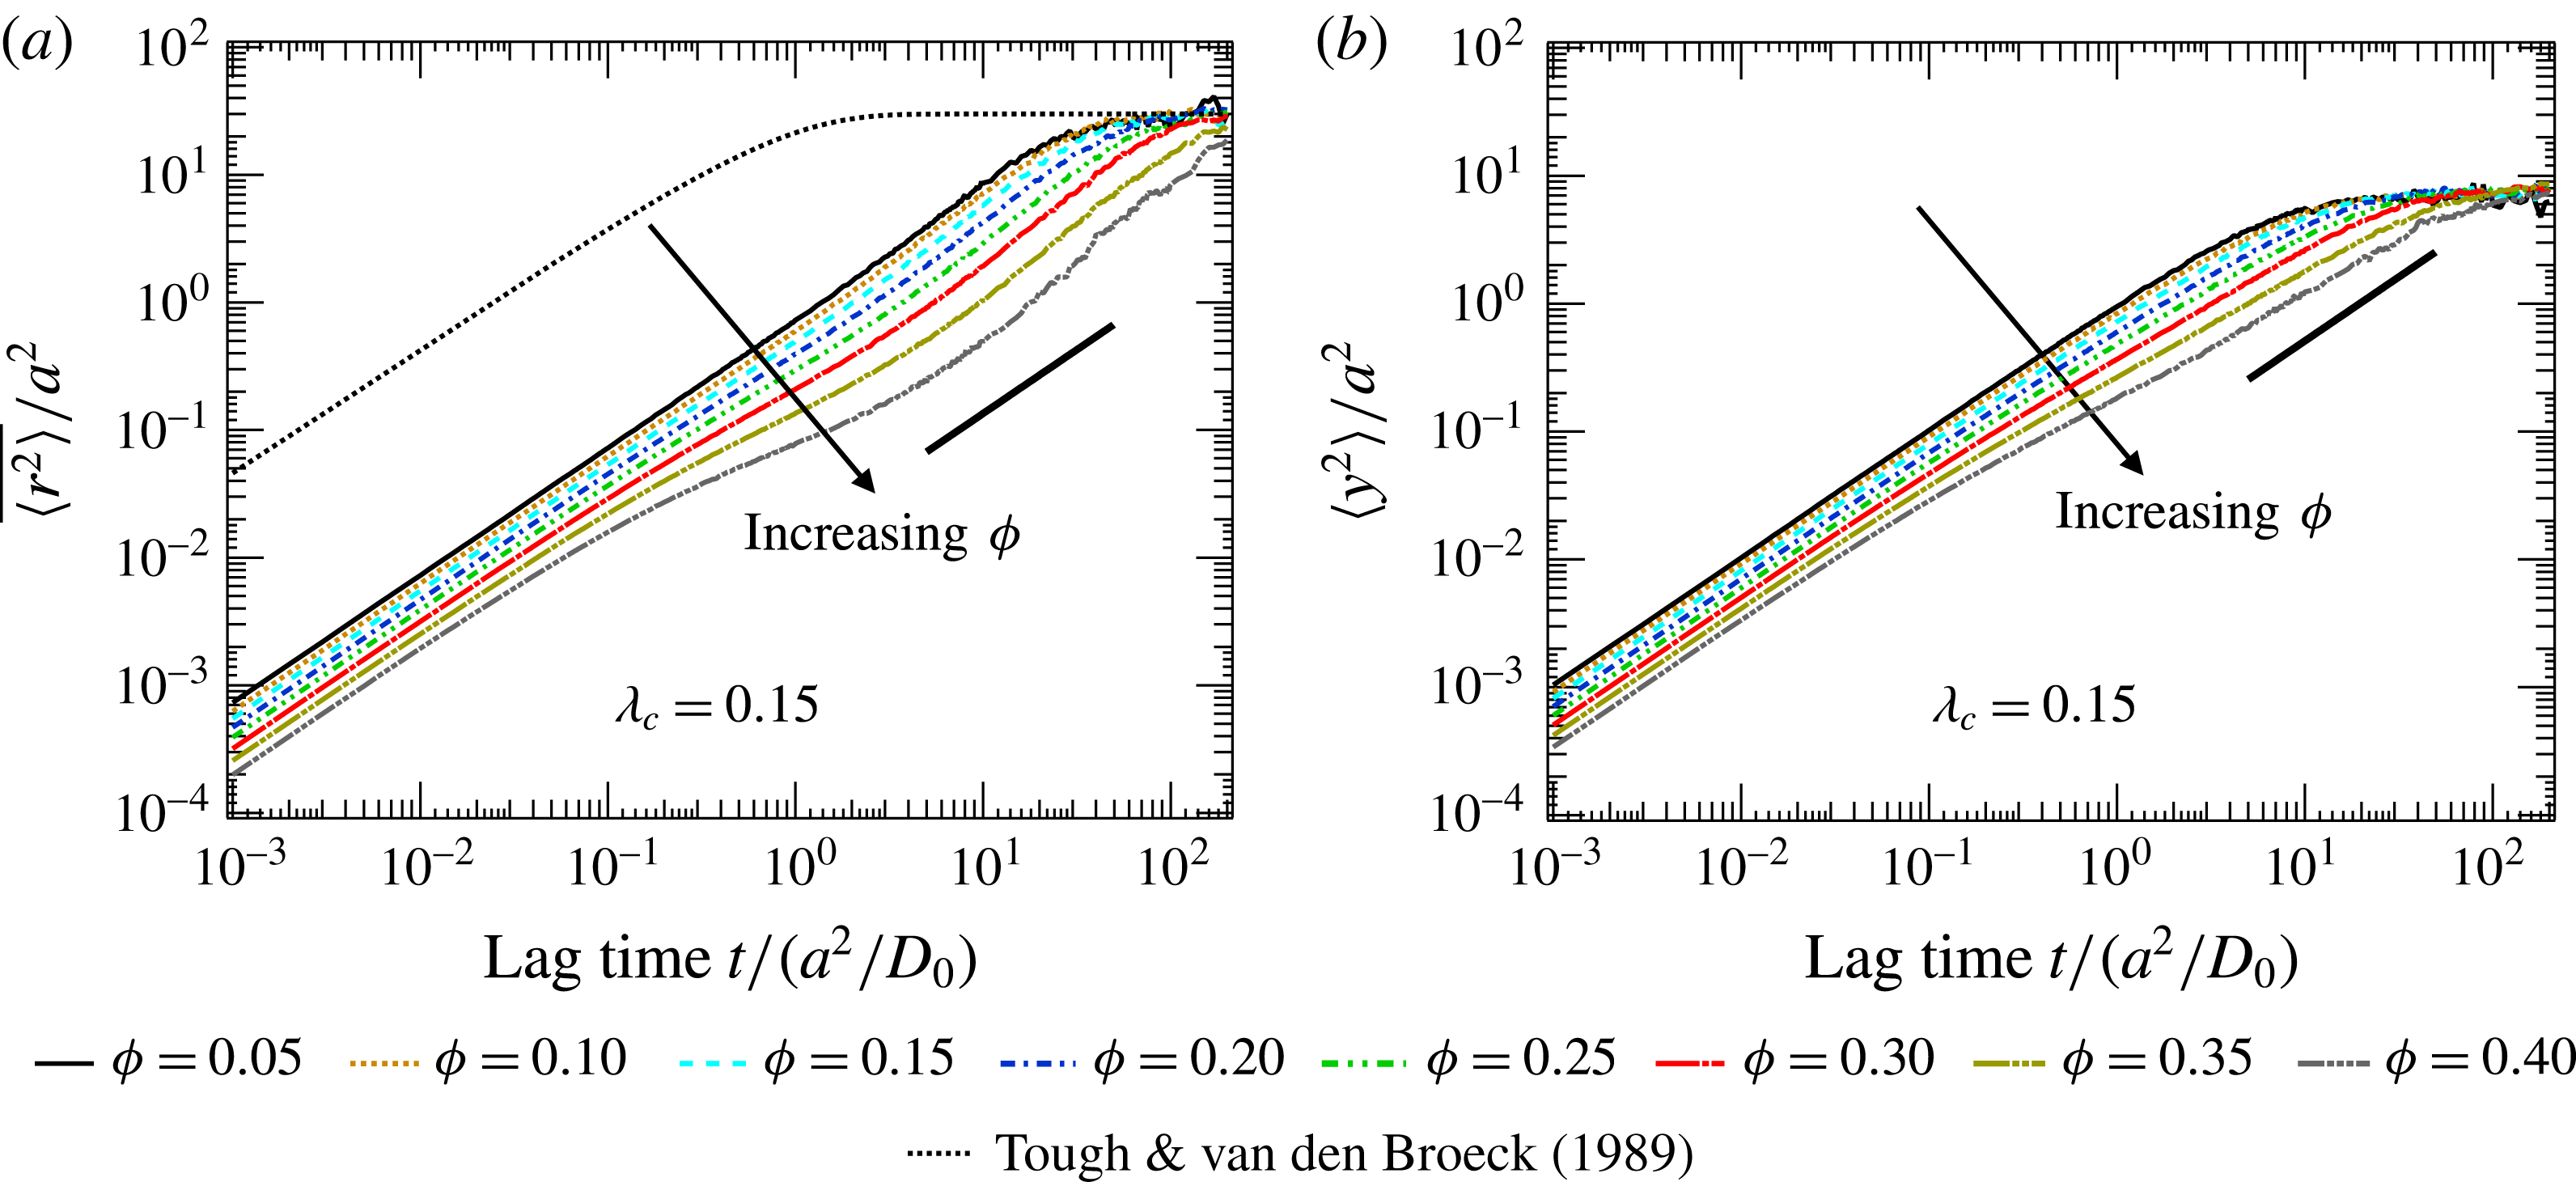
The ‘lag time’ over which the mean-square displacement is measured determines which relaxation and rate processes are sampled. Indeed, measurements of subdiffusive behaviour may indicate so-called anomalous diffusion (Wachsmuth, Waldeck & Langowski Reference Wachsmuth, Waldeck and Langowski2000; Golding & Cox Reference Golding and Cox2006; Brangwynne et al. Reference Brangwynne, Koenderink, MacKintosh and Weitz2008; Tabei et al. Reference Tabei, Burov, Kim, Kuznetsov, Huynh, Jureller, Philipson, Dinner and Scherer2013) or may simply indicate that the measurement lag time sampled the correlated motion inherent in the transition from short- to long-time self-diffusion. In an attempt to recover and explain anomalous diffusion in eukaryotic HeLa cancer cells, Weiss et al. (Reference Weiss, Elsner, Kartberg and Nilsson2004) conducted Brownian dynamics simulations of a freely draining dense suspension of polydisperse spheres. Measurements of mean-square displacements revealed a sublinear temporal growth that weakened as crowding increased, from which the authors inferred that crowding produces subdiffusion of mobile colloids. However, the power-law exponent in simulations did not agree with that found in experiments, a discrepancy attributed by the authors to their approximation of proteins as spheres. However, the simulation particles were also mobile and the fluid force-free; thus, an equally likely cause for the measured subdiffusion was that the selected lag time sampled correlated motion – during the transition from the short-time to the long-time regime. Although this study helped to advance the idea that crowding is an important feature of the cell interior, the connection between the subdiffusive motion observed in simulations and experiments remains unclear. A more careful interrogation of diffusive regimes would shed light on this question, as would inclusion of hydrodynamic interactions and the presence of boundaries.
In this work, we undertake to answer these questions by modelling spherically confined suspensions of volume fraction
 $0.05\leqslant \unicode[STIX]{x1D719}\leqslant 0.40$
using the method of Aponte-Rivera & Zia, where the presence of the boundary is accounted for through the use of appropriate hydrodynamic mobility functions (Aponte-Rivera & Zia Reference Aponte-Rivera and Zia2016). This method ensures that the correct boundary conditions are satisfied at the surface of the cavity, and also accounts for many-body and lubrication hydrodynamic interactions between the particles themselves and between the particles and the cavity. We determine both the short-time and the long-time transport behaviour of the confined suspension for a range of particle-to-cavity size ratios and volume fractions from concentrated to dilute.
The remainder of this article is organized as follows. In § 2, we give a description of the simulation methods used to calculate the short- and long-time transport properties. In § 3.1, the equilibrium structure of the spherically confined suspension is determined and discussed. Results for the short-time self-diffusivity of spherically confined suspensions are then presented in § 3.2, with an emphasis on their connection to the equilibrium structure. In § 3.3, we conduct numerical experiments and measure the short-time self-diffusion to guide particle-tracking experiments. In § 3.4, we discuss relative errors in the short-time self-diffusion that arise from the use of common approximations. In § 3.5, the long-time behaviour of the suspension is discussed utilizing the particle mean-square motion. In § 3.6, the dynamics of cage hopping in the confined domain is discussed. The study is concluded with a discussion in § 4.
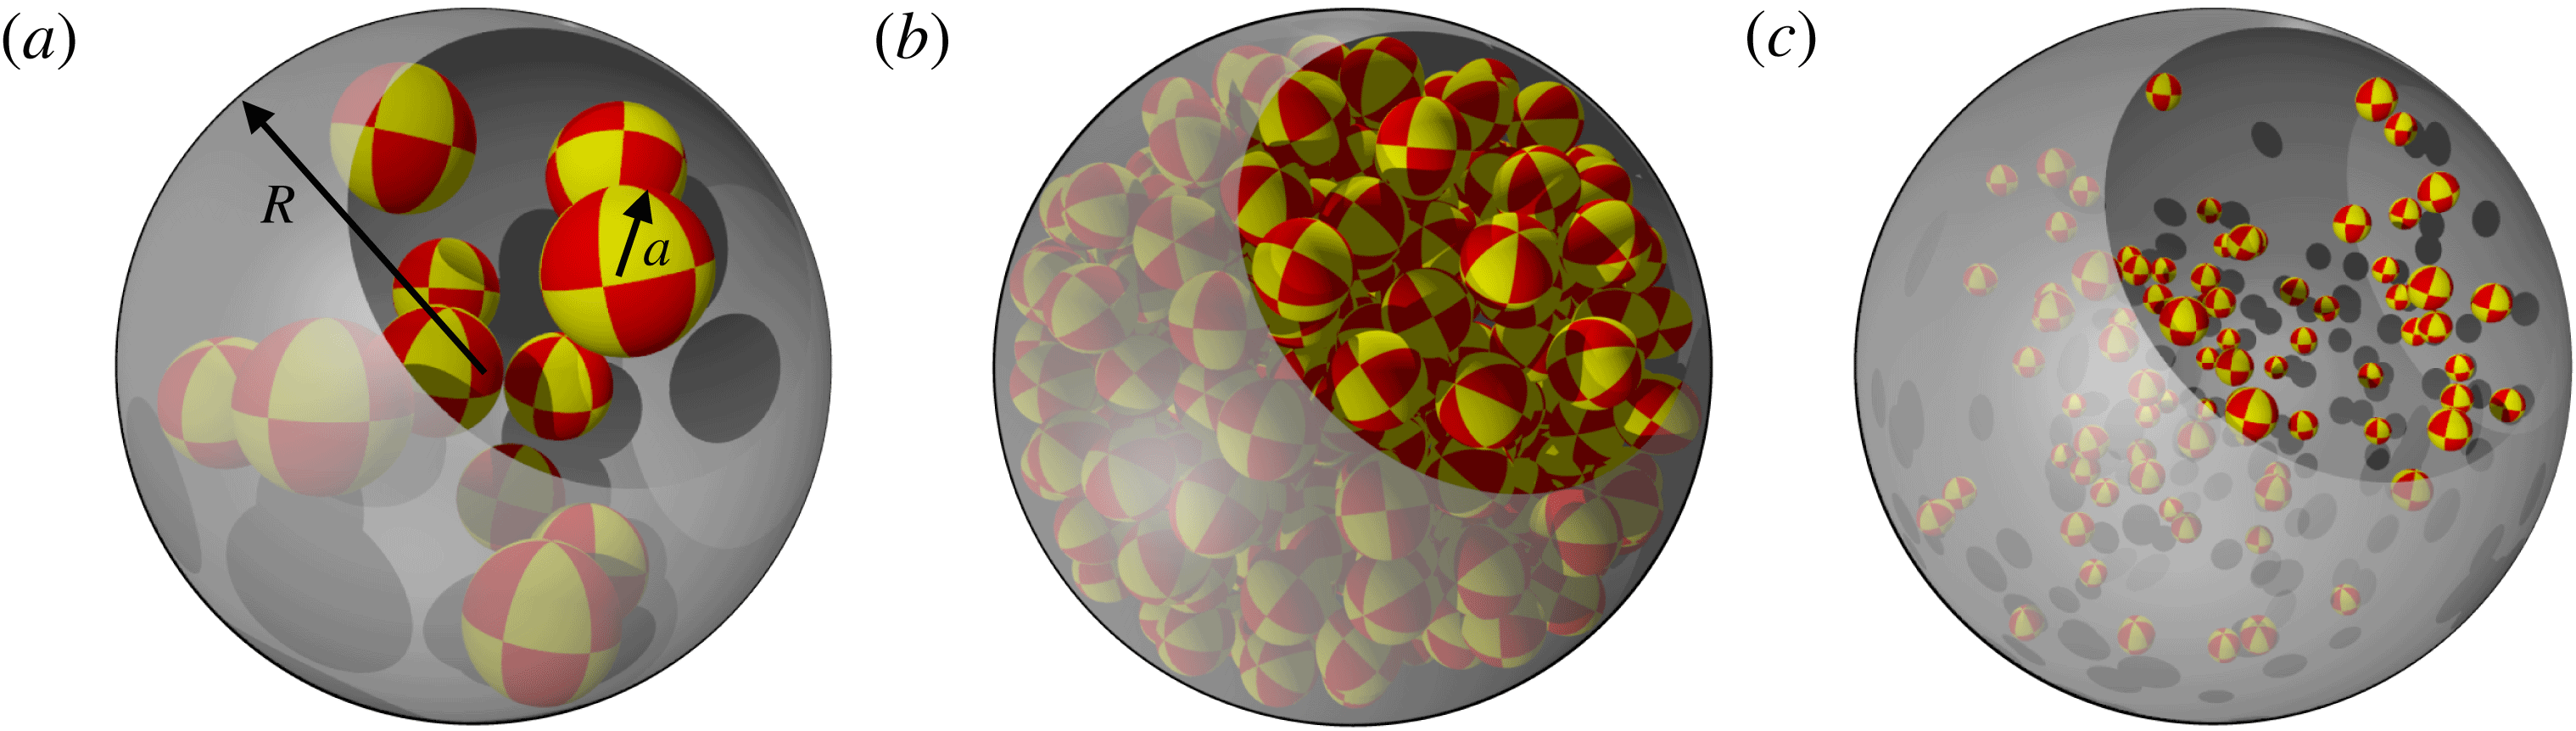
Simulation snapshots illustrating variation of particle-to-cavity size ratio
 $\unicode[STIX]{x1D706}_{c}$
and volume fraction
 $\unicode[STIX]{x1D719}$
: (a)
 $\unicode[STIX]{x1D706}_{c}=0.2$
,
 $\unicode[STIX]{x1D719}=0.1$
; (b)
 $\unicode[STIX]{x1D706}_{c}=0.1$
,
 $\unicode[STIX]{x1D719}=0.3$
; (c)
 $\unicode[STIX]{x1D706}_{c}=0.05$
,
 $\unicode[STIX]{x1D719}=0.05$
(see the supplementary movie).

2 Methods
In this section, we give an overview of our recently developed spherically confined Stokesian dynamics method (Aponte-Rivera & Zia Reference Aponte-Rivera and Zia2016) to model confined colloidal suspensions, expanding the original Stokesian dynamics algorithm of Brady and coworkers (Durlofsky, Brady & Bossis Reference Durlofsky, Brady and Bossis1987; Brady & Bossis Reference Brady and Bossis1988; Foss & Brady Reference Foss and Brady2000; Banchio & Brady Reference Banchio and Brady2003). The method accounts for hydrodynamic interactions both between the particles themselves and between the particles and the cavity. Two computational techniques are employed: dynamic simulations to study the long-time equilibrium behaviour of 3D-confined suspensions and a stochastic method (Zia, Swan & Su Reference Zia, Swan and Su2015) to efficiently determine the short-time transport properties of 3D-confined suspensions. Both techniques are described below.
2.1 Dynamic simulation
We consider a suspension of
 $N$
spherical colloidal particles of radius
 $a$
immersed in a Newtonian solvent confined inside a no-slip impermeable spherical boundary of radius
 $R$
. The size of the particles relative to the enclosure and the boundary is given by the particle-to-cavity size ratio
 $\unicode[STIX]{x1D706}_{c}=a/R$
. Figure 1(a–c) gives snapshots from three simulations with different volume fractions and particle-to-cavity size ratios, illustrating the system of interest. A movie from a sample simulation is available in the supplementary material at https://doi.org/10.1017/jfm.2017.801. In these microconfined suspensions, the particle motion is governed by the
 $N$
-body Langevin equation,
 $$\begin{eqnarray}\unicode[STIX]{x1D662}\boldsymbol{\cdot }\frac{\text{d}\boldsymbol{U}}{\text{d}t}=\boldsymbol{F}^{H}+\boldsymbol{F}^{B}+\boldsymbol{F}^{P}+\boldsymbol{F}^{ext},\end{eqnarray}$$
where
 $\unicode[STIX]{x1D662}$
is a generalized mass/moment of inertia tensor and
 $\boldsymbol{U}$
is a generalized velocity vector of the translational and rotational particle velocities relative to the fluid. The right-hand side of (2.1) represents the net force (and torque) acting on each particle. The total force and torque comprise four contributions:
 $\boldsymbol{F}^{B}$
is a Brownian (stochastic) force and torque satisfying Gaussian statistics and arising due to the numerous collisions of solvent molecules with the particle surface during time intervals much longer than the solvent time scale, and
 $\boldsymbol{F}^{P}$
gives the force and torque derivable from the interparticle interaction potential. An externally applied force and torque,
 $\boldsymbol{F}^{ext}$
, may also act on the particles. Finally,
 $\boldsymbol{F}^{H}$
is the hydrodynamic force and torque exerted by the fluid on the particle surface as a particle undergoes motion relative to the fluid. In Stokes flow, the moments of the hydrodynamic surface traction are linearly coupled to the particle motion via the inverse of the hydrodynamic resistance matrix. For the quiescent suspension considered here, this may be written using the generalized force and velocity matrices as
 $$\begin{eqnarray}\boldsymbol{F}^{H}=-\boldsymbol{{\mathcal{R}}}_{FU}\boldsymbol{\cdot }\boldsymbol{U}.\end{eqnarray}$$
Here,
 $\boldsymbol{{\mathcal{R}}}_{FU}$
is a generalized resistance matrix of the hydrodynamic couplings between translational/rotational motion and forces/torques, defined as
 $$\begin{eqnarray}\boldsymbol{{\mathcal{R}}}_{FU}\equiv \left(\begin{array}{@{}cc@{}}\boldsymbol{R}_{FU} & \boldsymbol{R}_{LU}\\ \boldsymbol{ R}_{F\unicode[STIX]{x1D6FA}} & \boldsymbol{R}_{L\unicode[STIX]{x1D6FA}}\end{array}\right),\end{eqnarray}$$
where
 $\boldsymbol{R}_{FU}$
,
 $\boldsymbol{R}_{LU}$
,
 $\boldsymbol{R}_{F\unicode[STIX]{x1D6FA}}$
and
 $\boldsymbol{R}_{L\unicode[STIX]{x1D6FA}}$
are the hydrodynamic functions coupling the force to the translational velocity, the torque to the translational velocity, the force to the rotational velocity and the torque to the rotational velocity, respectively. The hydrodynamic resistance depends only on the geometry, i.e. the configuration of the
 $N$
particles in the spherical cavity and their sizes relative to the cavity radius. In a 3D-confined domain,
 $\boldsymbol{{\mathcal{R}}}_{FU}$
must account for the hydrodynamic interactions between the particles themselves and between the particles and the cavity.
We utilize the framework we developed in a previous study (Aponte-Rivera & Zia Reference Aponte-Rivera and Zia2016) to model many-body hydrodynamic interactions between particles and with a spherical enclosing cavity, where the no-slip and no-flux cavity is rigorously accounted for via an image point that satisfies the boundary conditions. Utilizing that approach, we developed the grand mobility tensor that couples particle motion to velocity, rotation and straining flow for an arbitrary number of particles enclosed in a cavity of arbitrary relative size, with arbitrary particle concentration. A brief outline of the approach is given here. The Green’s function for Stokes flow in a spherical cavity (Oseen Reference Oseen1927) is inserted in the integral formulation for fluid velocity in Stokes flow (Ladyzhenskaya Reference Ladyzhenskaya1969). A Taylor expansion of this expression produces the mobility couplings required to construct a far-field interaction matrix (Aponte-Rivera & Zia Reference Aponte-Rivera and Zia2016) that, when inverted, couples an arbitrary number of particles to one another and to the confining cavity through an infinitude of reflected interactions (Durlofsky et al.
Reference Durlofsky, Brady and Bossis1987). The far-field coupling,
 $({\mathcal{M}}_{ff})^{-1}$
, is superimposed linearly with the near-field resistance matrix,
 ${\mathcal{R}}_{nf}$
, to give a complete grand resistance matrix valid for all concentrations and all permissible particle separations,
 $$\begin{eqnarray}{\mathcal{R}}=({\mathcal{M}}_{ff})^{-1}+{\mathcal{R}}_{nf}.\end{eqnarray}$$
This method provides a framework with which to account for both many-body and near-field hydrodynamic interactions of spherically confined particles. For a more detailed description and the required hydrodynamic functions we refer the reader to Aponte-Rivera & Zia (Reference Aponte-Rivera and Zia2016).
In the prior work, we reported the details of the couplings between force, torque and stresslet, and velocity, rotation and straining motion. In the present work, we employ these functions in a dynamic simulation where Brownian motion drives particle migration, and hydrodynamic and entropic interactions influence the strength of this coupling and set the diffusion rates and structure.
The displacement of particles over time is obtained by integrating (2.1) over a time long compared with the particle inertia relaxation time (the overdamped limit) but short compared with the time it takes for structural configurations to take place. This yields a displacement equation that gives the change in particle positions
 $\unicode[STIX]{x1D6AB}\boldsymbol{x}$
that takes place during a time interval
 $\unicode[STIX]{x0394}t$
,
 $$\begin{eqnarray}\unicode[STIX]{x1D6AB}\boldsymbol{x}(\unicode[STIX]{x0394}t)=(\boldsymbol{{\mathcal{R}}}_{FU}^{-1}\cdot \boldsymbol{F}^{P}+kT\unicode[STIX]{x1D735}\boldsymbol{\cdot }\boldsymbol{{\mathcal{R}}}_{FU}^{-1})\unicode[STIX]{x0394}t+\boldsymbol{X}(\unicode[STIX]{x0394}t)+O(\unicode[STIX]{x0394}t).\end{eqnarray}$$
In (2.5),
 $\unicode[STIX]{x1D6AB}\boldsymbol{x}$
is the particle displacement during a time interval
 $\unicode[STIX]{x0394}t$
. The three terms on the right-hand side correspond to displacements arising from interparticle forces, deterministic Brownian drift and stochastic Brownian motion with zero mean, and variance proportional to a configuration-dependent drag,
 $$\begin{eqnarray}\overline{\boldsymbol{X}}=0,\quad \overline{\boldsymbol{X}(t)\boldsymbol{X}(t)}=2kT\boldsymbol{{\mathcal{R}}}_{FU}^{-1}\unicode[STIX]{x0394}t.\end{eqnarray}$$
In (2.6), the overbar denotes a noise average over times much longer than individual solvent collisions and over times long compared with the particle momentum relaxation;
 $k$
is Boltzmann’s constant and
 $T$
is the absolute temperature.
Hydrodynamic interactions that set the configuration-dependent resistance tensor
 $\boldsymbol{{\mathcal{R}}}$
are modelled using the method of Aponte-Rivera & Zia (Reference Aponte-Rivera and Zia2016), which captures both many-body and lubrication hydrodynamic interactions in spherically confined colloidal suspensions. The approach makes use of an expansion in moments of the hydrodynamic surface traction to develop a far-field grand mobility matrix (Durlofsky et al.
Reference Durlofsky, Brady and Bossis1987) that accounts for the presence of the spherical cavity. Because the expansion is truncated at the level of the stresslet, the method requires the inversion of an
 $11N\times 11N$
matrix to capture an infinitude of reflections (Durlofsky et al.
Reference Durlofsky, Brady and Bossis1987). Although traditional methods for matrix inversion incur a computational cost that scales as
 $O(N^{3})$
, we avoid such computationally expensive methods through the use of iterative solvers, which reduce the computational cost of calculating the required particle displacements to a more favourable
 $O(N^{2})$
(Banchio & Brady Reference Banchio and Brady2003).
Further reduction of computational cost can be achieved by including the hydrodynamic force and torque in the calculations while neglecting the many-body stresslet, which reduces the
 $11N\times 11N$
matrix that must be inverted to
 $6N\times 6N$
(the pair-level stresslet is still included in the model). The accuracy of this simplification is restricted to equilibrium calculations, where the stresslet induced by reflected particle interactions produces disturbance flows that decay as
 $1/r^{4}$
(where
 $r$
is the distance from a point in the fluid), as compared with the
 $1/r$
and
 $1/r^{2}$
disturbance flows that form leading-order disturbances from the hydrodynamic force and torque. We demonstrate the validity of this approximation by comparing the results for short-time self-diffusivity for force/torque only with force/torque/stresslet computations in appendix F. Similar truncation methods have been employed in the study of unbound suspensions, and have been shown to produce accurate results with reduced computational cost at equilibrium (Durlofsky & Brady Reference Durlofsky and Brady1987; Durlofsky et al.
Reference Durlofsky, Brady and Bossis1987).
2.2 Short-time transport properties
A stochastic sampling technique permits rapid and efficient calculation of the short-time self-diffusivity. Similar stochastic techniques have been used to calculate the short-time self-diffusivity in unbound suspensions (Sierou & Brady Reference Sierou and Brady2001) and suspensions confined inside a channel (Swan & Brady Reference Swan and Brady2011b ), and for calculating concentrated pair mobility tensors (Zia et al. Reference Zia, Swan and Su2015; Su, Swan & Zia Reference Su, Swan and Zia2017) in unbound suspensions. The short-time self-diffusivity can be connected to the hydrodynamic mobility via the fluctuation-dissipation theorem, which dictates that the short-time self-diffusivity tensor must satisfy
 $$\begin{eqnarray}\boldsymbol{D}_{0}=\langle \boldsymbol{M}_{UF,\unicode[STIX]{x1D6FC}\unicode[STIX]{x1D6FC}}\rangle ,\end{eqnarray}$$
where the angle brackets denote an ensemble average over many particle configurations and the subscript
 $\unicode[STIX]{x1D6FC}\unicode[STIX]{x1D6FC}$
denotes the self-mobility of the particle. In (2.7), the mobility has been normalized by the mobility of an isolated particle,
 $1/6\unicode[STIX]{x03C0}\unicode[STIX]{x1D702}a$
, and the diffusivity by the Stokes–Einstein coefficient,
 $D_{0}=kT/(6\unicode[STIX]{x03C0}\unicode[STIX]{x1D702}a)$
, where
 $\unicode[STIX]{x1D702}$
is the viscosity of the solvent. The trace of (2.7) was previously measured for unbound suspensions via accelerated Stokesian dynamics by Sierou & Brady (Reference Sierou and Brady2001), a measurement that assumes diffusion to be isotropic a priori. As will be shown below, the ensemble-averaged mobility tensor in spherically confined suspensions is position-dependent and anisotropic. We show below a method to capture both of these features.
To efficiently determine the short-time self-diffusivity, the stochastic techniques of Sierou & Brady (Reference Sierou and Brady2001) and Zia et al. (Reference Zia, Swan and Su2015) are followed, where particles are assigned stochastic forces with zero mean and identity covariance; particle velocities are then calculated for a given configuration. The full mobility tensor for one realization is then given by the outer product of the forces and velocities, and averaging over many configurations then yields the short-time self-diffusivity. To capture the anisotropy of the mobility tensor, the outer product is projected onto an orthogonal basis corresponding to diffusion along and perpendicular to the cavity radius. The orthogonal projection yields the radial and perpendicular components of the short-time self-diffusivity,
 $D_{0}^{\Vert }$
and
 $D_{0}^{\bot }$
respectively,
 $$\begin{eqnarray}\displaystyle & \displaystyle D_{0}^{\Vert }=\langle \boldsymbol{U}_{\unicode[STIX]{x1D6FC}}\boldsymbol{F}_{\unicode[STIX]{x1D6FC}}\boldsymbol{ : }\hat{\boldsymbol{y}}_{\unicode[STIX]{x1D6FC}}\hat{\boldsymbol{y}}_{\unicode[STIX]{x1D6FC}}\rangle , & \displaystyle\end{eqnarray}$$
 $$\begin{eqnarray}\displaystyle & \displaystyle D_{0}^{\bot }=\langle \boldsymbol{U}_{\unicode[STIX]{x1D6FC}}\boldsymbol{F}_{\unicode[STIX]{x1D6FC}}\boldsymbol{ : }{\textstyle \frac{1}{2}}(\unicode[STIX]{x1D644}-\hat{\boldsymbol{y}}_{\unicode[STIX]{x1D6FC}}\hat{\boldsymbol{y}}_{\unicode[STIX]{x1D6FC}})\rangle , & \displaystyle\end{eqnarray}$$
where
 $\hat{\boldsymbol{y}}_{\unicode[STIX]{x1D6FC}}$
is a unit vector pointing from the cavity centre to the centre of the particle. To capture the position dependence of the short-time self-diffusivity, radial bins are constructed as annular shells of radius
 $y_{n}=(n-1/2)\unicode[STIX]{x0394}y$
from the centre of the cavity. All particles at a distance
 $y_{n}\pm \unicode[STIX]{x0394}y/2$
are assigned to the
 $n$
th bin. Averages are computed within each bin, thus averaging the statistics of particles within a bin and giving a radially dependent diffusion tensor. The total number of bins,
 $n_{tot}=100$
, provides spatial resolution sufficient to observe structural and dynamical variation in the suspension. The statistics at the centre of the cavity are most challenging to capture, due to the small bin volume. An alternative is to define bins of fixed volume, but this would smear out the radial dependence of particle motion. To counteract the small-volume statistics, we opt to simply conduct a large enough number of simulations to minimize statistical noise near the centre.
3 Results
While self-diffusion in an unbound suspension is independent of structure and position, any confinement leads to spatial variations in structure and to changes in the length scale over which ordered structure appears (Snook & Henderson Reference Snook and Henderson1978; González et al. Reference González, White, Román and Evans1998; Németh & Löwen Reference Németh and Löwen1999), which in turn influence particle motion and diffusion. We begin with structural results that reveal confinement-induced ordering, followed by our measurements of the short-time self-diffusivity in the spherically confined domain, and the impact of structural heterogeneity and common approximations on this quantity. The long-time transport behaviour is reported in §§ 3.5 and 3.6.
3.1 Equilibrium structure in spherically confined suspensions
In any dispersion, individual particle dynamics are intrinsically connected to entropic and hydrodynamic interactions with the surrounding suspension. In a quiescent unbound dispersion, any particle can sample any position in the suspension, giving a spatially homogeneous particle concentration over length scales longer than a particle size. One measure of such structure in unbound suspensions is the radial distribution function
 $g(r,\unicode[STIX]{x1D719})$
. In the dilute limit,
 $g(r,\unicode[STIX]{x1D719}\ll 1)\rightarrow 1$
for all
 $r$
. At finite concentration, familiar nearest-neighbour peaks appear, strongest at contact and decaying to unity as
 $r\rightarrow \infty$
. The Percus–Yevick closure provides a convenient approach for plotting this behaviour (Percus & Yevick Reference Percus and Yevick1958). However, the presence of an impenetrable boundary restricts accessible structural configurations; here, we investigate the extent to which such entropic restriction leads to spatial heterogeneities in particle concentration that ultimately affect relaxation length and time scales.
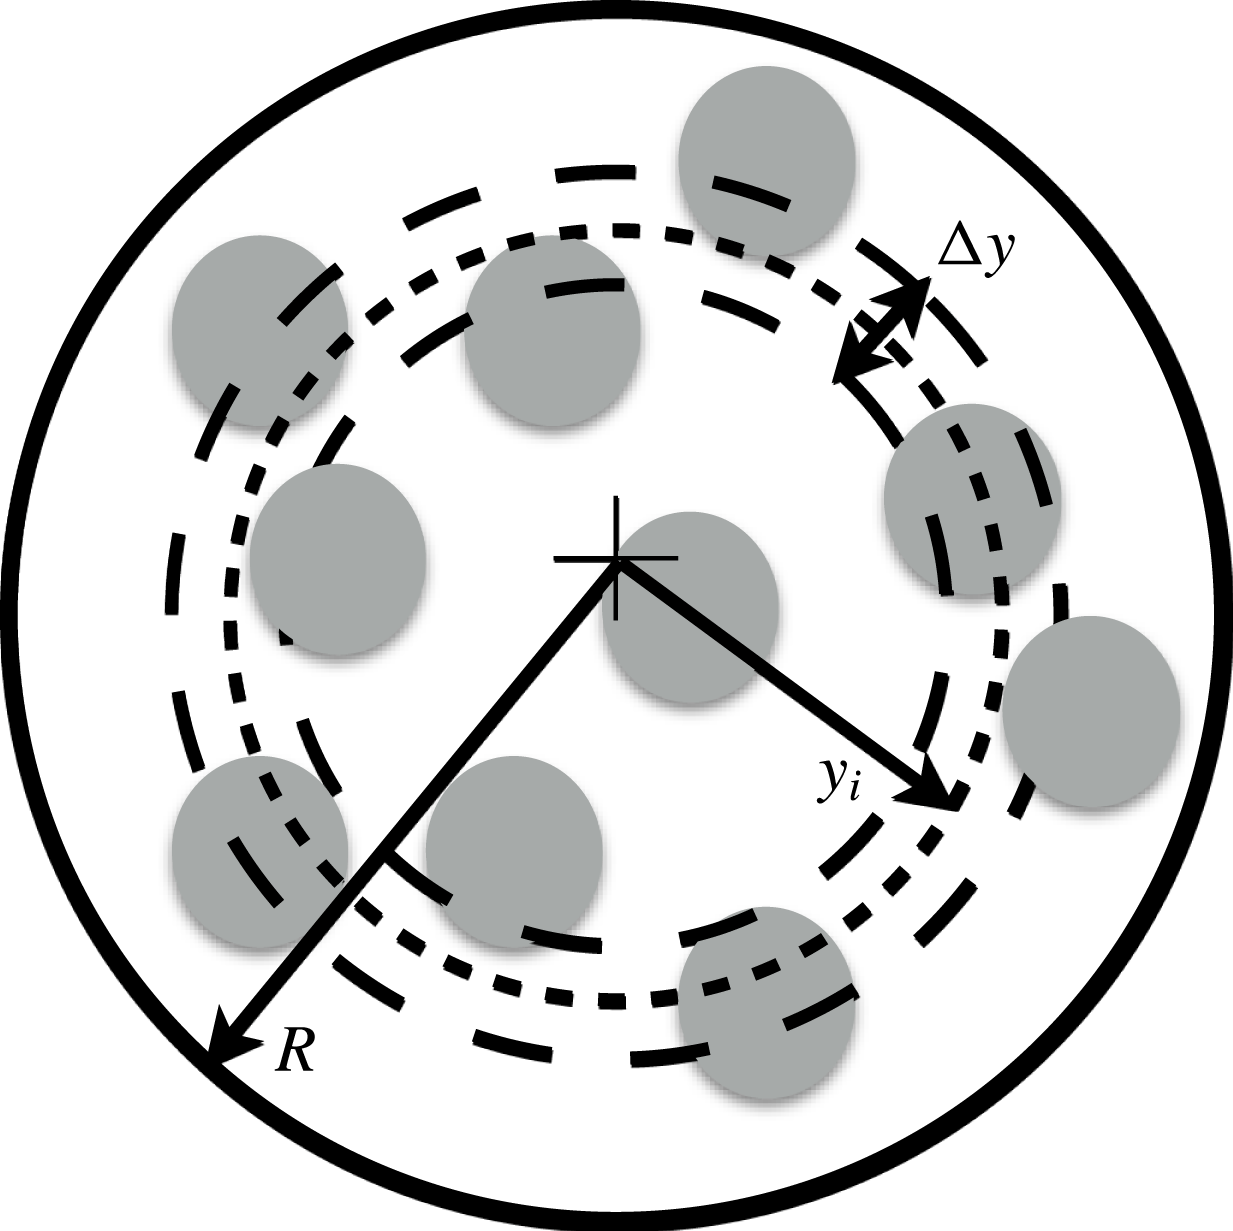
Illustration of the model system. Particles of radius
 $a$
are located at positions
 $y_{i}$
inside the cavity of radius
 $R$
. The dashed lines illustrate one bin, a spherical annulus of thickness
 $\unicode[STIX]{x0394}y$
with nominal radius
 $y_{i}$
.

The spatial dependence can be quantified by defining a cavity-centred radial distribution function, giving a measure of the likelihood of finding a particle at a given position inside the cavity; it can be interpreted as a measure of the local density at that position. In the context of dynamic simulations, it describes the probability of finding the centre of a particle in a thin annular shell, a ‘bin’, within the cavity. This discretization is sketched in figure 2 and illustrates the cavity-centred radial distribution function
 $$\begin{eqnarray}g(\,y_{i})=\frac{V_{T}}{N}\left\langle \frac{N_{i}}{V_{i}}\right\rangle ,\end{eqnarray}$$
where
 $N_{i}$
is the number of particles in bin
 $i$
,
 $N=\unicode[STIX]{x1D719}/\unicode[STIX]{x1D706}_{c}^{3}$
is the total number of confined particles,
 $V_{i}$
is the volume of bin
 $i$
and the angle brackets denote an ensemble average over many configurations within a bin. As described in § 2.2, the cavity was discretized into
 $i=100$
annular-shell bins. The bin volume
 $V_{i}$
changes with cavity size,
 $\unicode[STIX]{x1D706}_{c}$
, so that the discretization is the same for all
 $\unicode[STIX]{x1D706}_{c}$
. The cavity-centred radial distribution function
 $g(\,y_{i})$
is defined over the total volume
 $V_{T}$
accessible to particle centres. In consequence, the total volume is that contained by a sphere whose radius is equal to the maximum position of the particle inside the spherical cavity
 $y_{max}=(R-a)/R$
. Normalization of the cavity-centred radial distribution function by
 $N/V_{T}$
ensures that
 $g(\,y_{i})$
approaches unity only when the local volume fraction is equal to the bulk volume fraction, i.e.
 $\unicode[STIX]{x1D719}=N\unicode[STIX]{x1D706}_{c}^{3}$
. Deviations from unity thus correspond to depletion and accumulation of particles, and permit analysis of the degree to which concentration or the cavity induces order. When confined in a cavity, one expects the particles to crowd one another near the centre, and to be crowded by the wall far from the centre. To understand how these local environments influence the structure, we plot
 $g(\,y)$
as a function of radial position
 $y$
in figure 3.
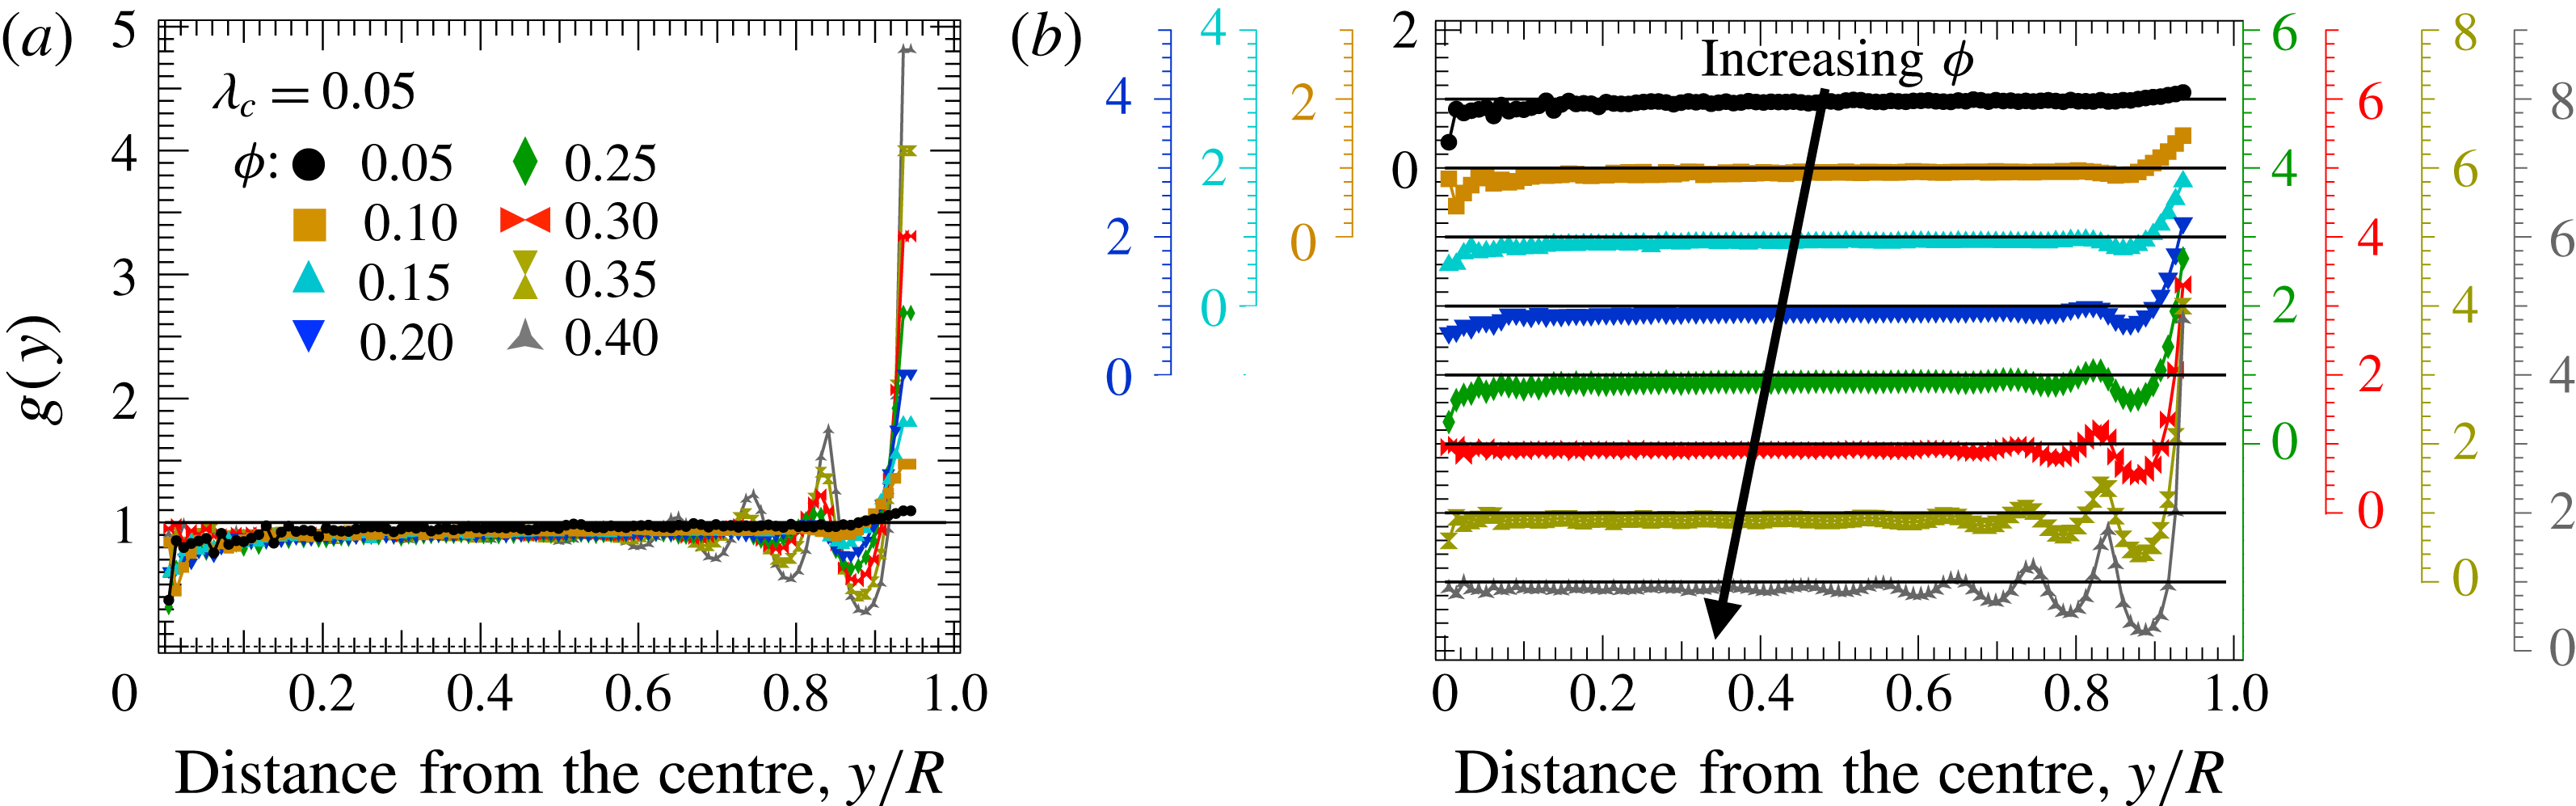
The cavity-centred radial distribution function
 $g$
of particles inside a spherical cavity for volume fractions
 $0.05\leqslant \unicode[STIX]{x1D719}\leqslant 0.40$
, with particle-to-cavity relative size
 $\unicode[STIX]{x1D706}_{c}=0.05$
. The cavity-centred radial distribution function is plotted as a function of the normalized radial position
 $y/R$
in plots with (a) a single axis and (b) multiple axes (one for each volume fraction).

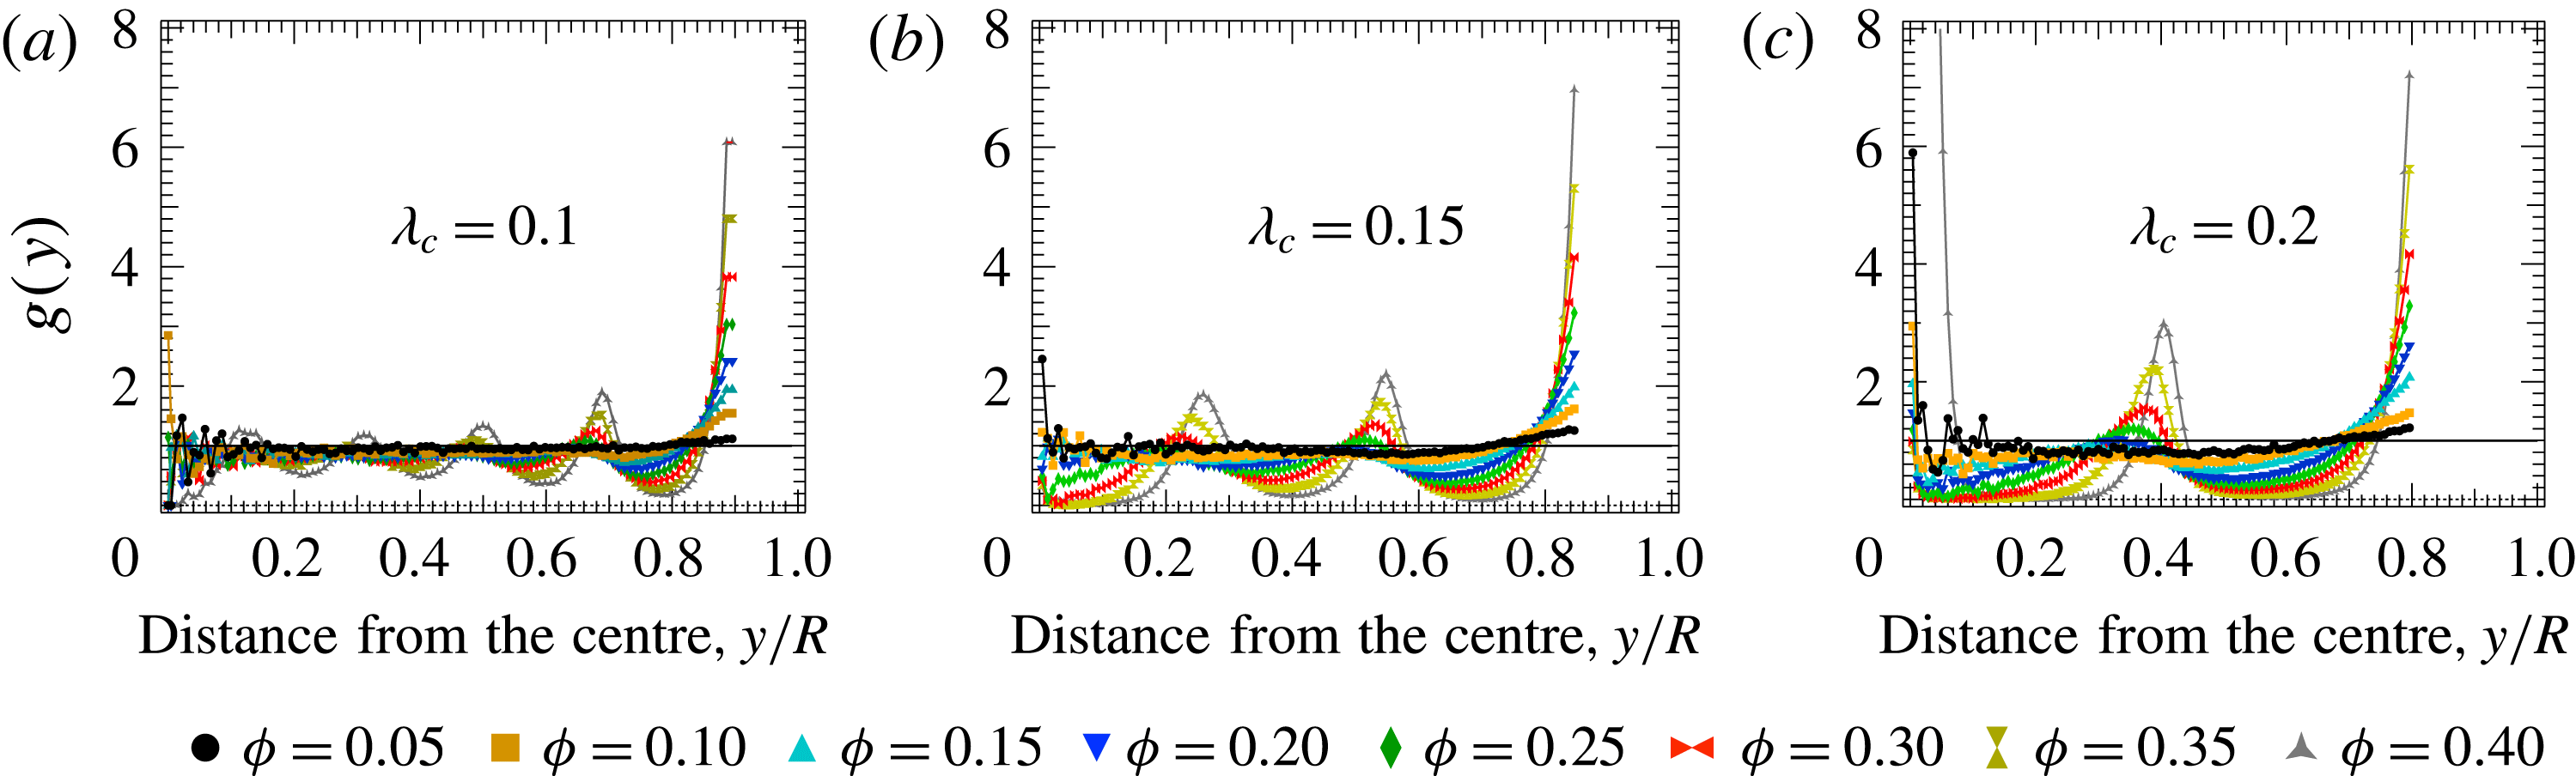
In figure 3(a), the cavity-centred radial distribution function is plotted as a function of radial position for particles that are
 $1/20$
the size of the cavity. Curves of different colour represent various volume fractions, and the straight black line denotes a (normalized) uniform structure. Unsurprisingly, for tiny particles, the structure is nearly homogeneous away from the wall. However, undulations appear near the wall and propagate inward as the volume fraction increases. It seems surprising that structure appears at such a low volume fraction; one might expect a uniform distribution. Simulations in the present study (not shown in the plot) for a single particle in the cavity do indeed recover a uniform distribution, but even a second additional particle produces structure. The appearance of structure at the wall can be independently recovered via methods such as event-driven molecular dynamics simulations (see the supplementary material). To highlight the density undulations, the data are replotted with separate vertical axes for each volume fraction in figure 3(b). For the lowest volume fraction (black symbols), a weak peak is seen near the wall. As the volume fraction increases, the peak near the wall narrows and grows taller, while depleting the concentration near the centre (
 $g(\,y)<1$
). The intermediate region of the cavity is structureless when
 $\unicode[STIX]{x1D719}\ll 1$
, but as the concentration grows, the peaks near the wall propagate inward, suggesting the emergence of liquid-like structure, a non-continuum effect induced by confinement and concentration. Prior molecular dynamics studies of the configuration of spheres inside a sphere by Németh & Löwen (Reference Németh and Löwen1999) produced the same peaks and valleys as well; a comparison (shown in the supplementary movie) for
 $a/R=0.15$
and
 $\unicode[STIX]{x1D719}=0.4$
shows excellent agreement. The peaks are reminiscent of nearest-neighbour peaks, where here we imagine that the ‘surrounding’ structure is now inside a test particle (the cavity). Confinement of these neighbours to a finite domain alters this structure – most obviously with the fact that no length scale exists where
 $g\rightarrow 1$
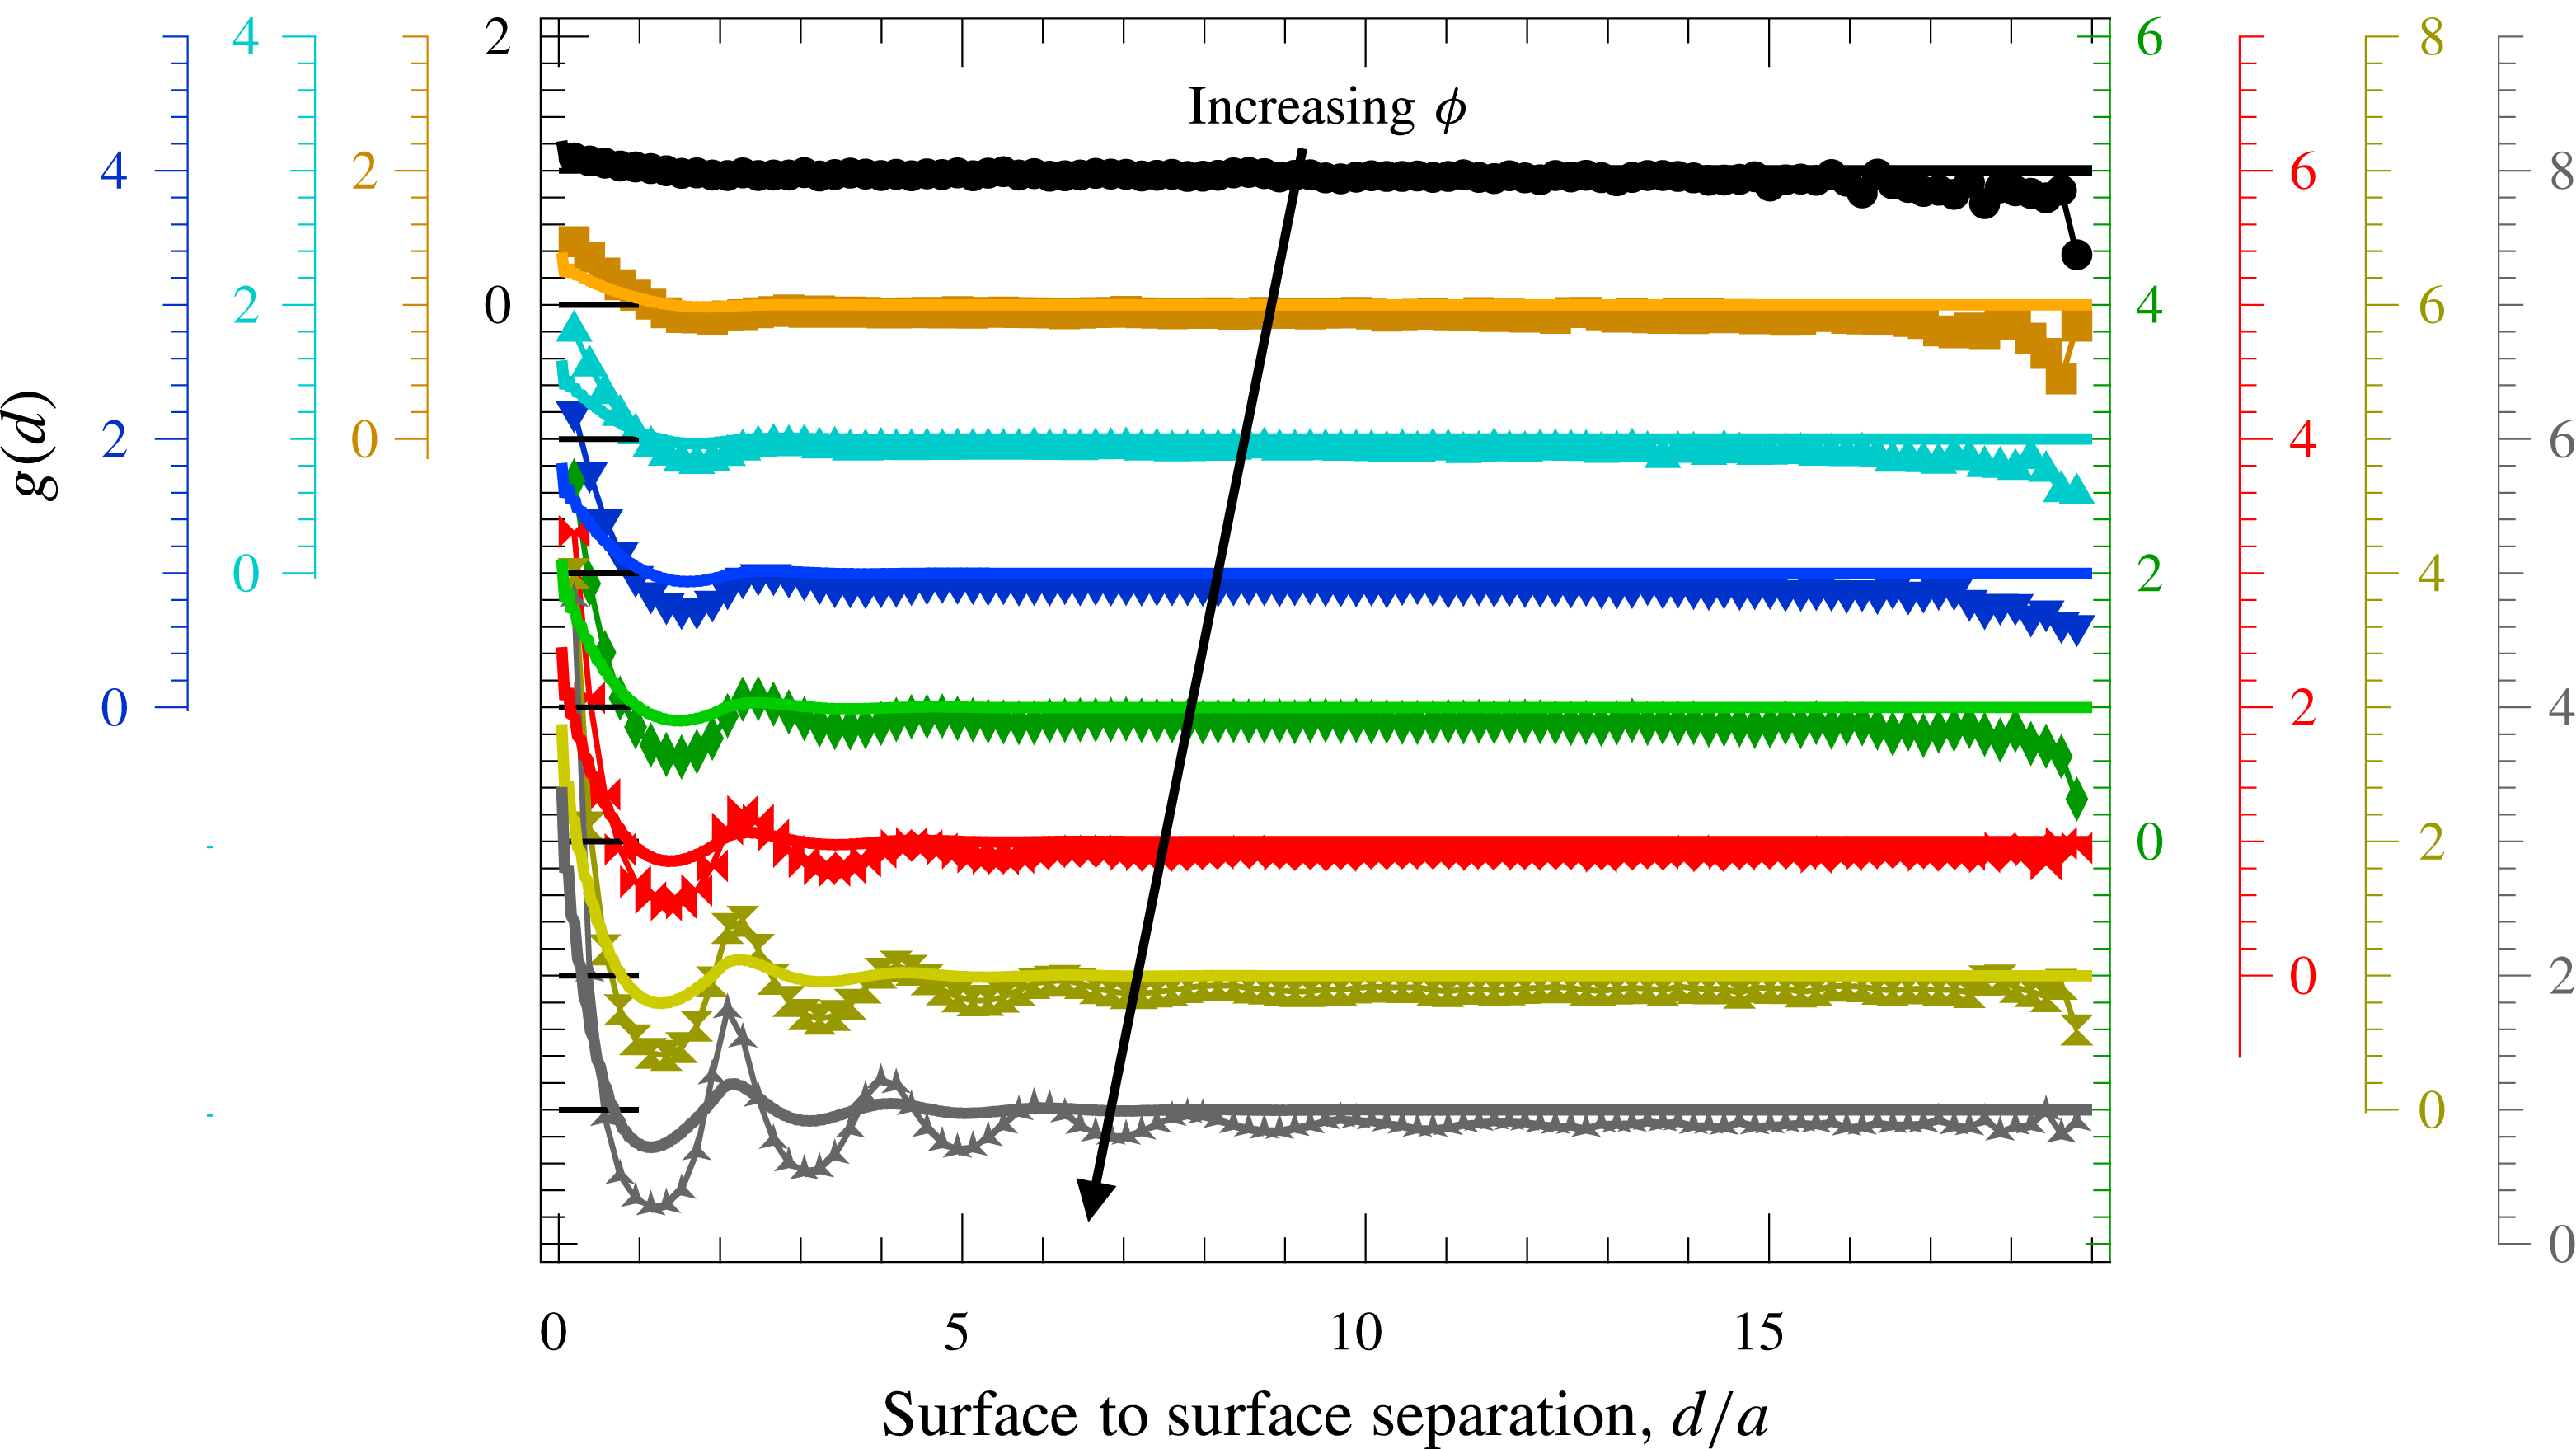
, once the volume fraction is sufficiently high, and that the onset of the liquid-like structure occurs at lower volume fractions than it does in the nearest-neighbour rings of unbound suspensions. To compare the structural heterogeneity in spherically confined suspensions with the nearest-neighbour rings of unbound suspensions, we plot the cavity-centred radial distribution function in the confined domain (symbols) alongside the pair distribution function of unbound suspensions (solid curves) in figure 4. Here, the pair distribution function for unbound suspensions has been obtained utilizing the Percus–Yevick closure relation (Percus & Yevick Reference Percus and Yevick1958). To appropriately compare these two quantities, we plot them as a function of the separation distance between the appropriate hard-sphere surfaces normalized by the particle radius. As the concentration increases, structural heterogeneity arises on length scales comparable to the particle size in both confined and unbound suspension, and propagates outward from the corresponding hard-sphere surface, i.e. the cavity surface in the confined domain and the test particle surface in the unbound domain. Two key differences arise. First, confinement induces stronger structural heterogeneity, with the amplitude of the structural undulations in the confined domain larger in magnitude for all volume fractions. Second, confinement propagates structural heterogeneity over longer length scales for all volume fractions. Thus, increase of the volume fraction in spherical confinement induces stronger and longer-ranged structural heterogeneity than that of unbound suspensions at matching volume fractions. We expect changes in cavity size to influence this behaviour, and that this structural heterogeneity will influence the short-time particle dynamics.
The cavity-centred radial distribution function of particles inside a spherical cavity (symbols) with particle-to-cavity relative size
 $\unicode[STIX]{x1D706}_{c}=0.05$
for
 $0.05\leqslant \unicode[STIX]{x1D719}\leqslant 0.40$
. Also shown is the pair distribution function for unbound suspension (solid curves), for the same volume fractions. All are plotted as a function of the separation between hard-sphere surfaces, i.e. particle–cavity and particle–particle surface separation for confined and unbound suspensions respectively. The pair distribution function for unbound suspension is obtained from the Percus–Yevick closure relation (Percus & Yevick Reference Percus and Yevick1958).

The emergence of confinement-induced liquid-like structure. The cavity-centred radial distribution function (density profile)
 $g(\,y)$
of particles inside a spherical cavity is plotted as a function of the normalized position
 $y/R$
for (a)
 $\unicode[STIX]{x1D706}_{c}=0.1$
, (b)
 $\unicode[STIX]{x1D706}_{c}=0.15$
and (c)
 $\unicode[STIX]{x1D706}_{c}=0.2$
.

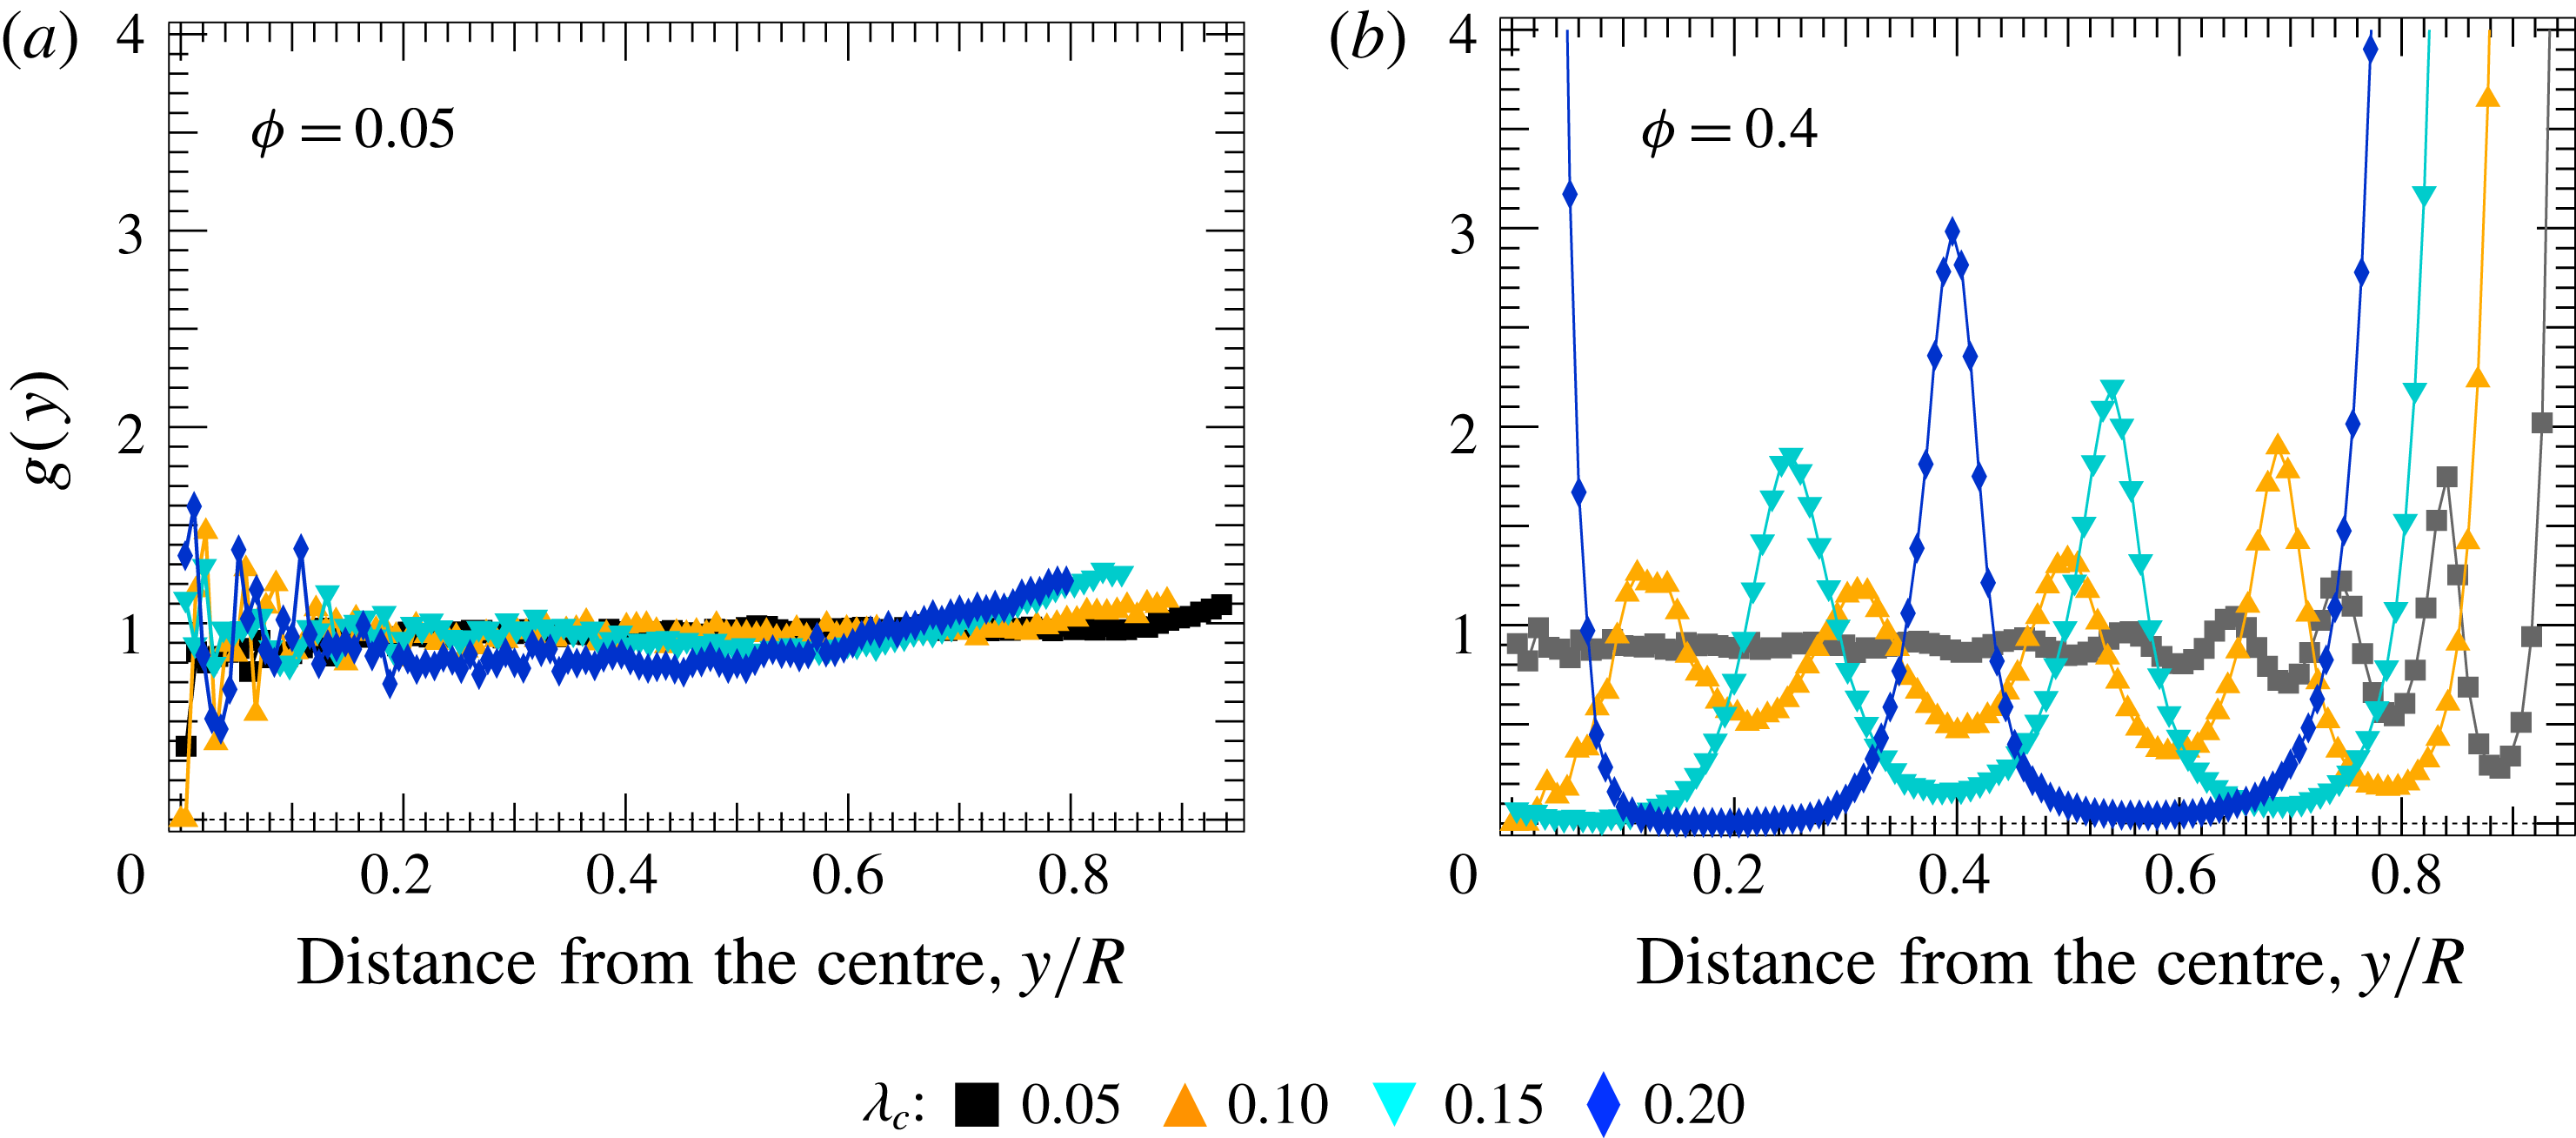
The cavity-centred radial distribution function (density profile)
 $g(\,y)$
of particles inside a spherical cavity plotted as a function of normalized position
 $y/R$
for (a)
 $\unicode[STIX]{x1D719}=0.05$
and (b)
 $\unicode[STIX]{x1D719}=0.4$
. The particle-to-cavity size ratios are shown in the legend.

The effect of cavity size on this behaviour is shown in figure 5, where the cavity-centred radial distribution function is plotted as a function of the radial position for several additional values of
 $\unicode[STIX]{x1D706}_{c}$
. In figure 5(a–c), the particles are
 $1/10$
,
 $1.5/10$
and
 $1/5$
of the cavity size respectively, with coloured symbols representing the same range of volume fraction studied for the large cavity of figure 3. The same qualitative trends appear – a peak near the cavity wall and density oscillations that increase in frequency and magnitude with increasing volume fraction. However, as the cavity shrinks, the undulations become more pronounced and occur at lower volume fractions, showing that confinement-induced ordering becomes more pronounced as entropic hindrance becomes more severe. The peaks of the undulation occur at multiples of the particle size
 $2a/R$
, confirming that the liquid-like layering induced by confinement and concentration persists to volume fractions as small as
 $\unicode[STIX]{x1D719}=0.1$
. For the largest particles,
 $\unicode[STIX]{x1D706}_{c}=0.2$
, sharp peaks emerge close to the centre of the cavity,
 $y/R\approx 0$
, at an intermediate distance from the cavity centre,
 $y/R\approx 0.4$
, and at the closest a particle can get to the wall,
 $y/R\approx (R-a)/R=0.8$
, while
 $\unicode[STIX]{x1D719}\approx 0$
elsewhere. Such a strongly layered structure suggests that a phase transition to crystal-like structure could occur; order parameters (Steinhardt, Nelson & Ronchetti Reference Steinhardt, Nelson and Ronchetti1983; Keys, Iacovella & Glotzer Reference Keys, Iacovella and Glotzer2011) to quantify crystal formation in spherically confined domains (Teich et al.
Reference Teich, van Anders, Klotsa, Dshemuchadse and Glotzer2016) could be utilized to further investigate this idea.
To more clearly illustrate the effects of particle-to-cavity relative size, the cavity-centred radial distribution function is evaluated at fixed volume fraction as the enclosure shrinks. In figure 6, the cavity-centred radial distribution function is plotted as a function of normalized position for two values of the fixed volume fraction. In figure 6(a), the suspension is dilute and the cavity-centred radial distribution function for small particles (
 $\unicode[STIX]{x1D706}_{c}=0.05$
) is nearly constant throughout the domain, save for a weak accumulation near the wall. As the cavity shrinks (
 $\unicode[STIX]{x1D706}_{c}=0.1,0.15,0.2$
), the effect of the boundary becomes more pronounced, until for
 $\unicode[STIX]{x1D706}_{c}=0.2$
accumulation near the wall is strong enough to deplete intermediate regions. Overall, dilute suspensions of small particles show little ordering near the centre of the cavity, but larger particles order easily at the same volume fractions when small particles remain structureless in distribution. At just
 $40\,\%$
volume fraction, even the smallest particles (
 $\unicode[STIX]{x1D706}_{c}=0.05$
) form layers, but structural relaxation still permits the exchange of particles between layers, i.e. we expect liquid-like particle dynamics. Even the strongly layered larger particles,
 $\unicode[STIX]{x1D706}_{c}=0.1,0.15$
, can still exchange places, as evidenced by the finite probability of finding particles in the interstices between the layers.
In summary, we have found that the spherical boundary induces structure that propagates radially inward from the wall over a length scale set by the volume fraction and particle-to-cavity relative size. In contrast to the near-neighbour rings observed in the pair distribution functions of concentrated unbound suspensions, the cavity-centred radial distribution function (or density profile) shows that confinement induces liquid-like structure that emerges at lower volume fractions, is of stronger magnitude and propagates over longer length scales. For the smallest particles, the combined effects of concentration and confinement produce liquid-like structure, but only near the wall. Such layering can be pushed by the boundary inward throughout the domain as the particles grow larger, but the packing is still loose enough to permit the free exchange of particles between layers.
The underlying origin of this behaviour is entropic exclusion from the space outside the impenetrable finite-size sphere. Just as entropic interactions hinder equilibrium diffusivity in unbound suspensions (Batchelor Reference Batchelor1976; Brady Reference Brady1994; Hoh & Zia Reference Hoh and Zia2016a ), we expect the exclusion of volume to play a role in particle dynamics and confined diffusion. A secondary effect is also expected, whereby the structural ordering induced by entropic restrictions plays a role; we study both of these topics next.
3.2 Short-time self-diffusivity in spherically confined suspensions
The rate at which a particle diffusively probes the surrounding medium is slowed by hydrodynamic entrainment of other particles; at short times, such diffusive motion is so small that it does not distort the surrounding structure (Batchelor Reference Batchelor1976; Rallison & Hinch Reference Rallison and Hinch1986), and thus is a purely hydrodynamic quantity. In an unbound suspension, this quantity depends only on the volume fraction of particles; the absolute positions of the particles do not matter. Only particle positions relative to one another influence transport, and particles can sample all relative separations with equal probability.
Hydrodynamically, an enclosure provides another no-slip surface that hinders particle diffusion. As with the familiar example of an unbound pair, entrainment in the cavity depends on the relative size, separation and orientation of hydrodynamic forces to centre-to-centre orientation (Aponte-Rivera & Zia Reference Aponte-Rivera and Zia2016). In the present case, the hydrodynamic mobility also depends on the particle distance from the cavity wall and the particle-to-cavity relative size
 $\unicode[STIX]{x1D706}_{c}$
. Because hydrodynamic forces can act in any direction relative to the particle-to-cavity centre-to-centre axis, the relative motion along the cavity radius differs from the relative motion tangential to the cavity wall, given the same strength of forcing. The hydrodynamic mobility functions that describe such couplings in spherically confined suspensions were derived in our recent work (Aponte-Rivera & Zia Reference Aponte-Rivera and Zia2016) and result in a configuration-dependent mobility tensor. The short-time self-diffusivity, however, is an average over many configurations around a test particle, typically in a homogeneous domain. Since the spherical cavity produces structural heterogeneity in the suspension, one way to envision the average configuration around a test particle is to recognize that annular shells form homogeneous subdomains. These permit examination of the variation of self-diffusion with radial position in the cavity. To examine this dependence, the
 $n$
th radial bin is defined at a location
 $y_{n}=\unicode[STIX]{x0394}y(n-1/2)$
, where
 $n$
denotes the
 $n$
th bin, as discussed in § 2.2. The averages within each bin give the diffusion as a function of particle position, volume fraction and size ratio. However, in contrast to isotropic structure that produces isotropic self-diffusion in unbound suspensions, spherical confinement permits isotropy only in the limiting case of a particle located at its centre (Cunningham Reference Cunningham1910). We thus expect structural anisotropy to lead to anisotropic diffusion.
To examine the elements of the self-diffusion tensor, we recognize that within an annular bin, the suspension surrounding a test particle is, on average, isotropic in the solid angle. The short-time self-diffusivity is thus fully specified via projection through the orthogonal basis
 $\hat{\boldsymbol{y}}\hat{\boldsymbol{y}}$
and
 $\unicode[STIX]{x1D644}-\hat{\boldsymbol{y}}\hat{\boldsymbol{y}}$
, where
 $\hat{\boldsymbol{y}}$
is a unit vector along the centre-to-centre axis between the particle and the cavity, and
 $\unicode[STIX]{x1D644}$
is the isotropic unit tensor. Projection through the former gives diffusion along the cavity radius, while diffusion along the cavity is projected by the latter. By expressing the short-time self-diffusivity as a projection onto these two orthogonal subspaces, one obtains
 $$\begin{eqnarray}\boldsymbol{D}_{0}=\{[D_{0}^{\Vert }(\,y/R,\unicode[STIX]{x1D706}_{c},\unicode[STIX]{x1D719})]\hat{\boldsymbol{y}}\hat{\boldsymbol{y}}+[D_{0}^{\bot }(\,y/R,\unicode[STIX]{x1D706}_{c},\unicode[STIX]{x1D719})](\unicode[STIX]{x1D644}-\hat{\boldsymbol{y}}\hat{\boldsymbol{y}})\},\end{eqnarray}$$
where
 $D_{0}^{\Vert }$
and
 $D_{0}^{\bot }$
are the diffusion coefficients for motion along and perpendicular to the cavity radius respectively.
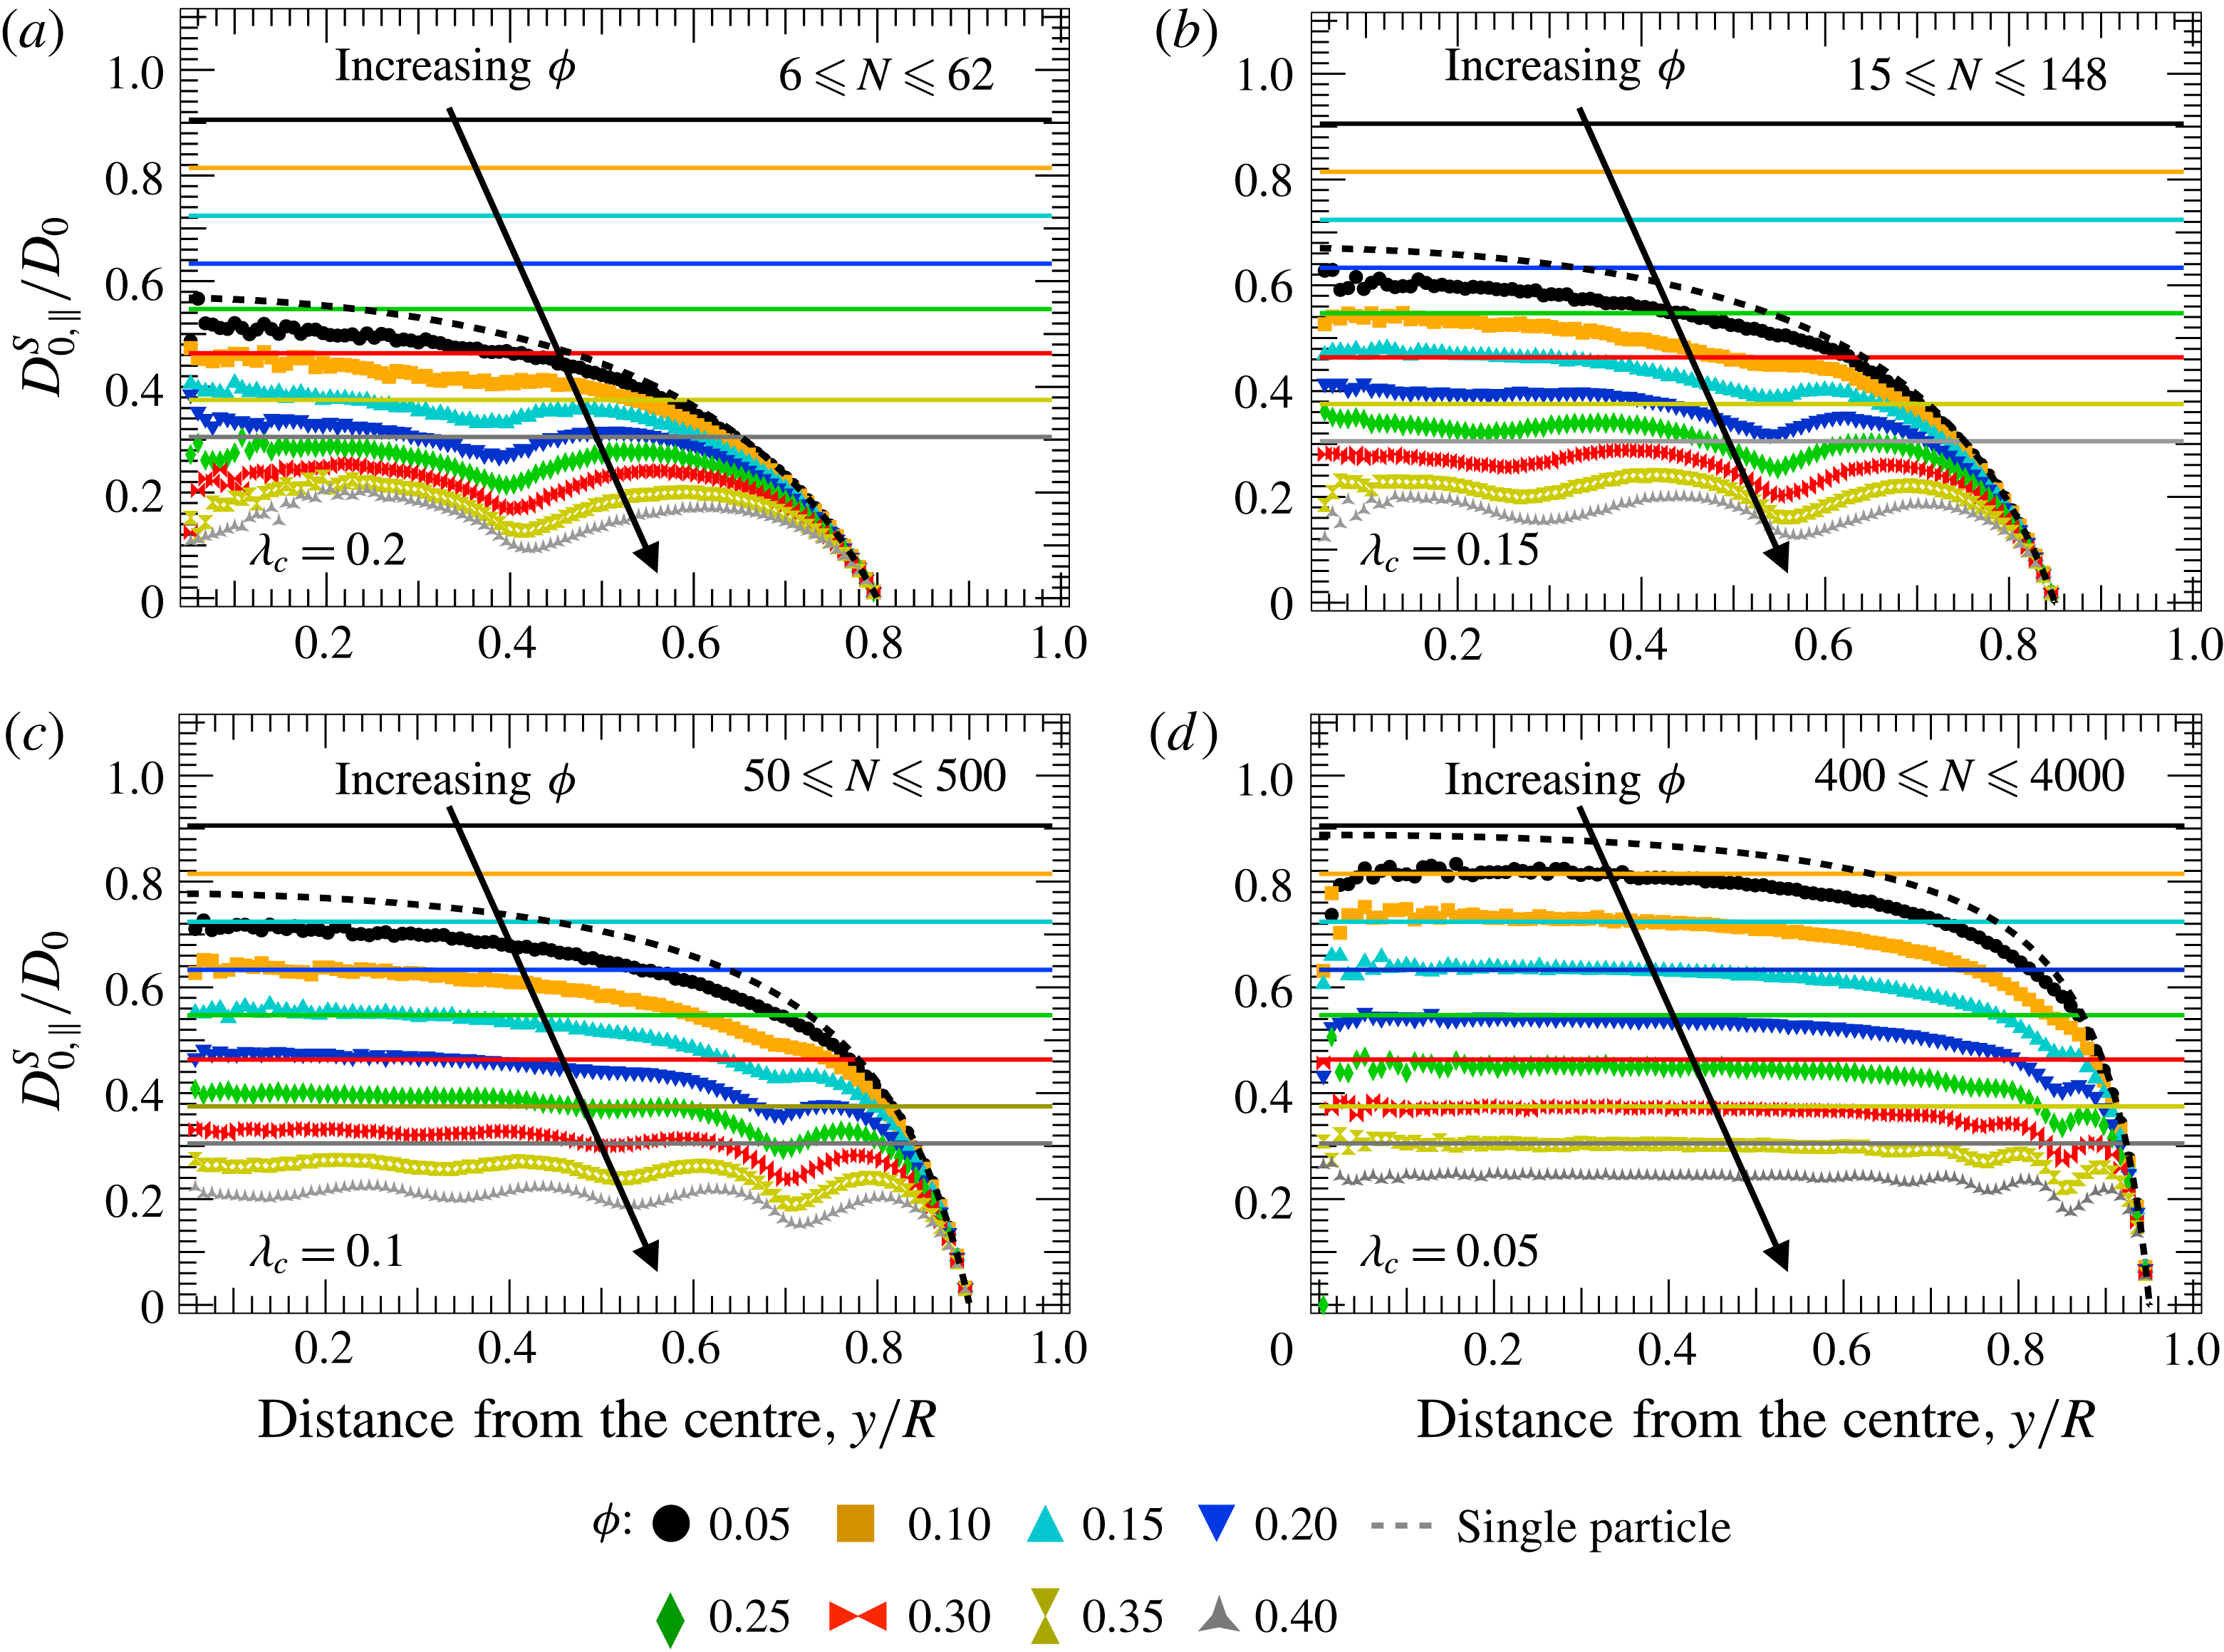
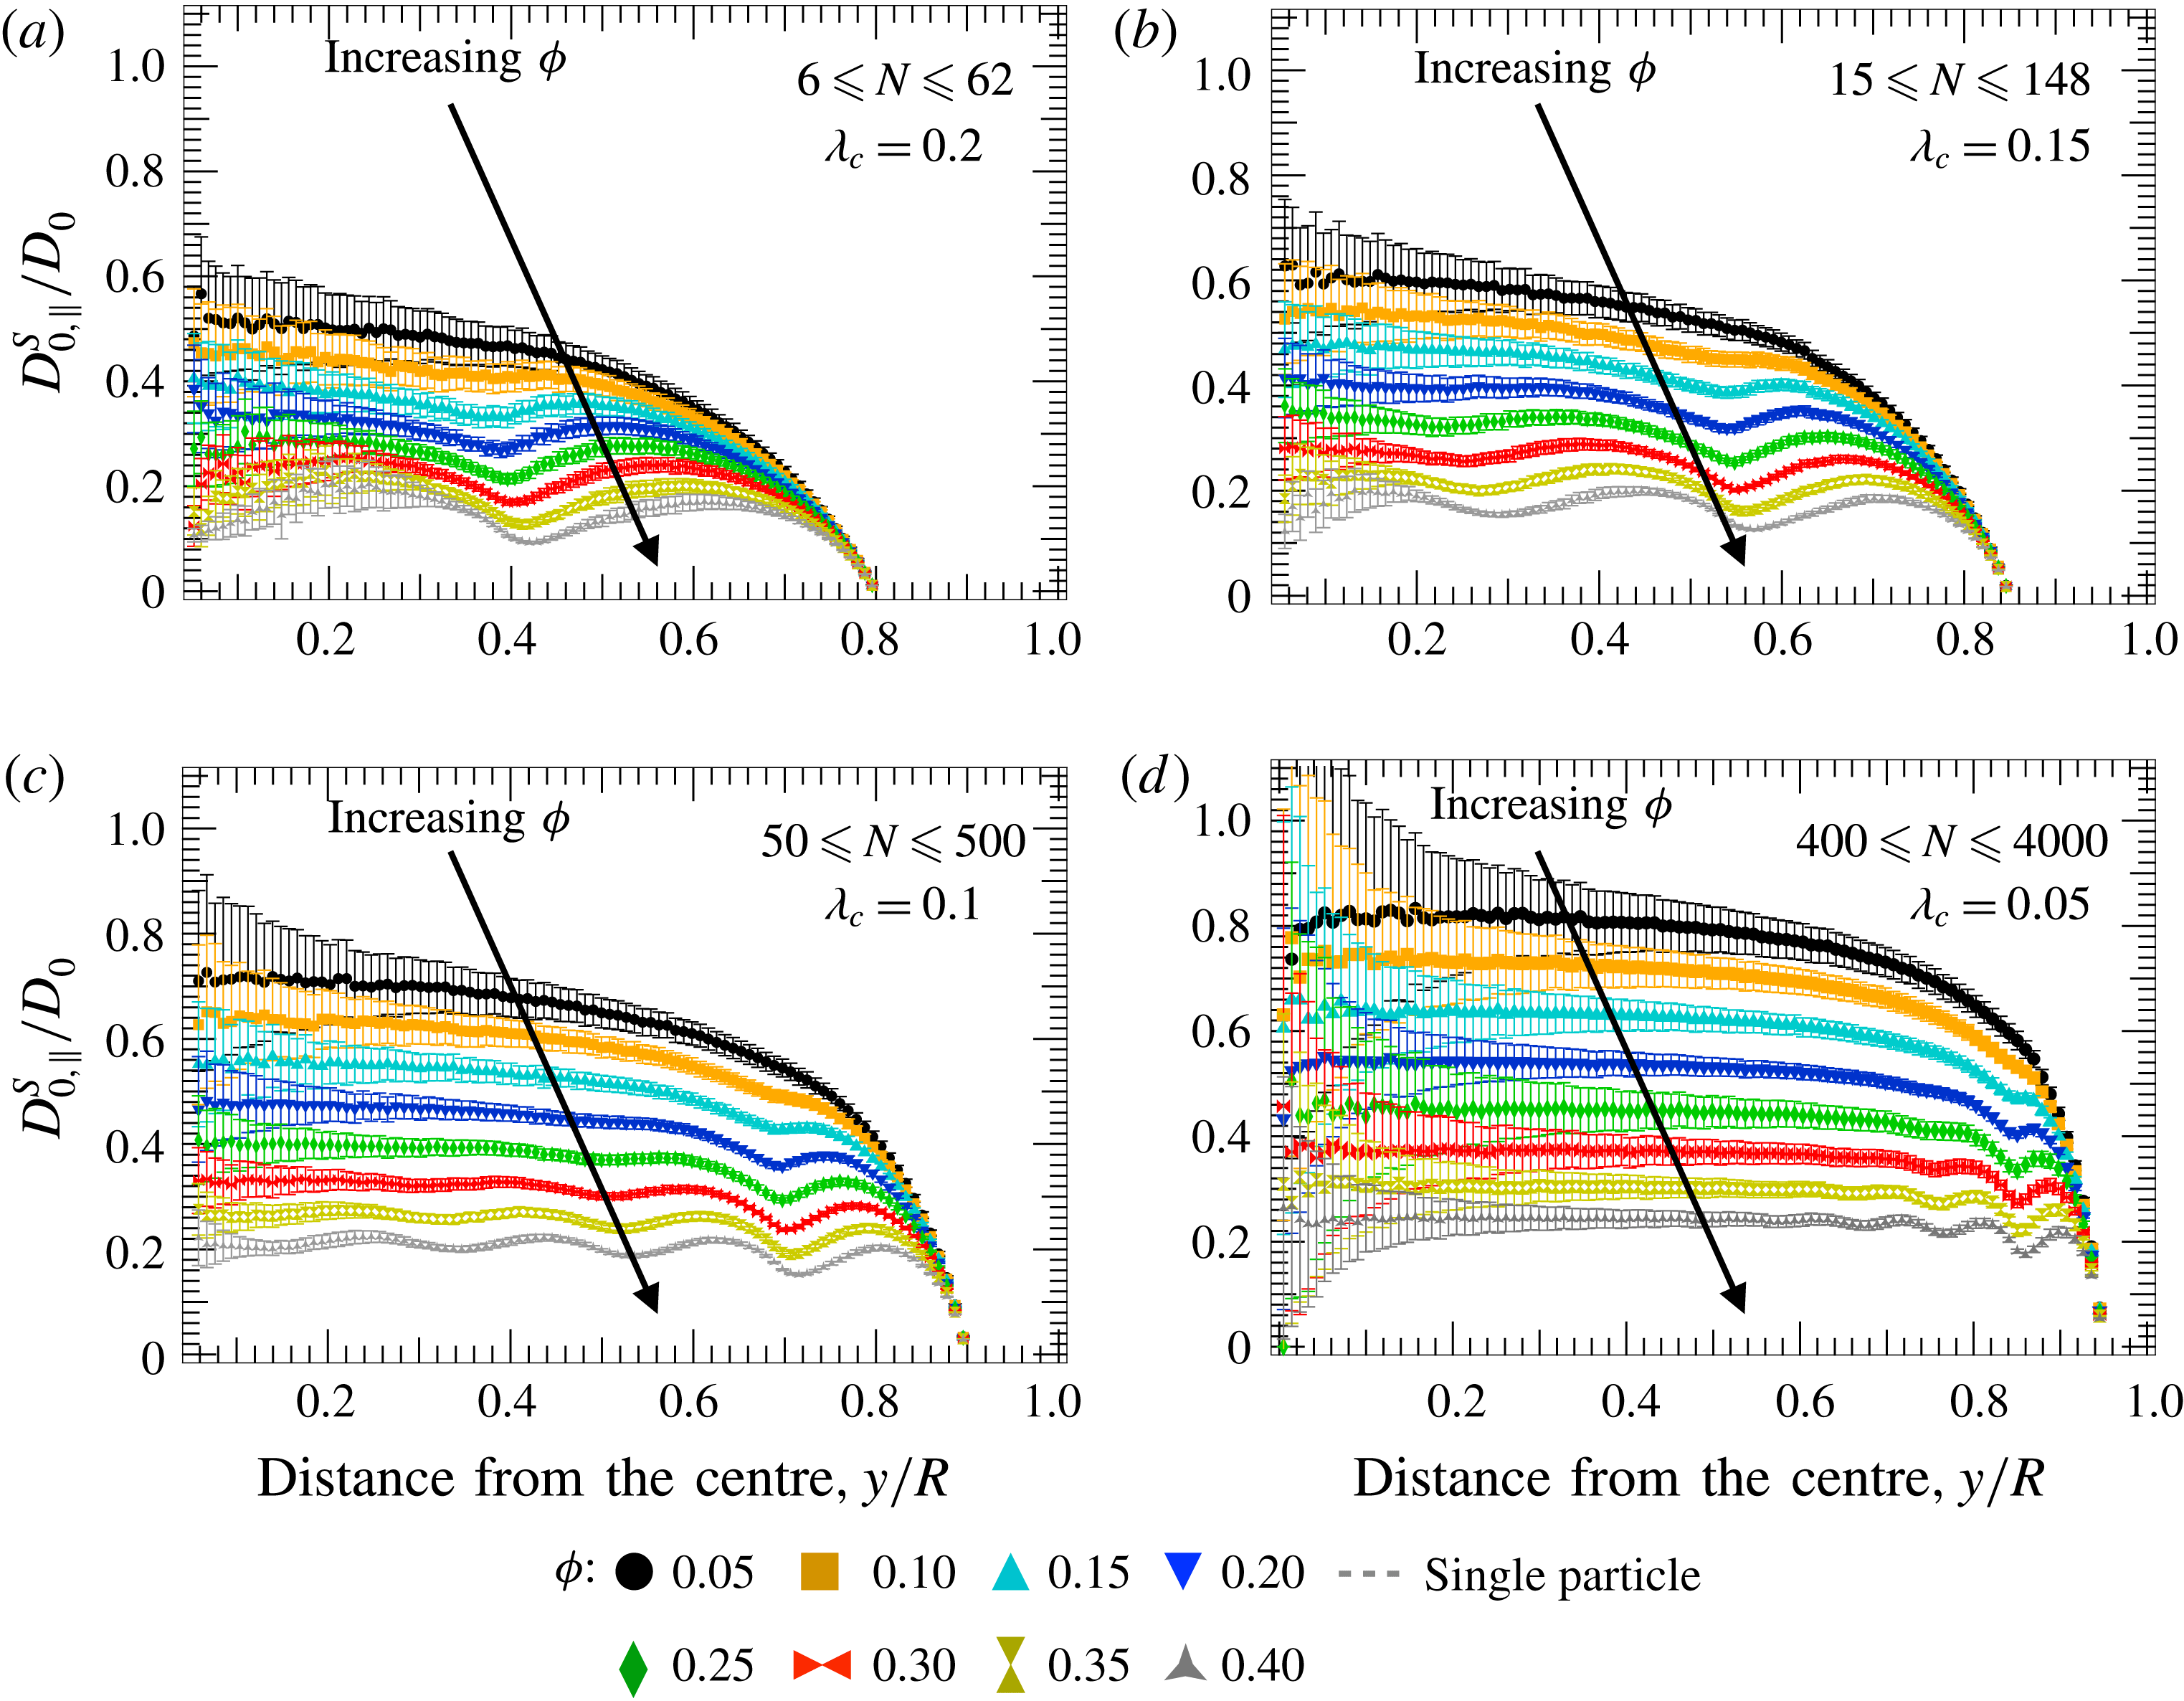
The radial component of the short-time self-diffusivity as a function of the normalized distance from the centre
 $y/R$
for particle-to-cavity size ratios of (a)
 $\unicode[STIX]{x1D706}_{c}=0.2$
, (b)
 $\unicode[STIX]{x1D706}_{c}=0.15$
, (c)
 $\unicode[STIX]{x1D706}_{c}=0.1$
and (d)
 $\unicode[STIX]{x1D706}_{c}=0.05$
. In each plot, the symbols represent the diffusivity of particles in confined suspensions at varying volume fractions and the straight solid lines represent the diffusivity in unbound suspensions at matching volume fractions obtained here utilizing accelerated Stokesian dynamics simulations. The dashed line represents the diffusivity for a single particle inside the spherical cavity. Error bars are omitted for clarity, but can be found in figure 18 in appendix E. The number of particles per simulation varies with the volume fraction, as shown in the plots.

We utilized our recently developed confined mobility functions (Aponte-Rivera & Zia Reference Aponte-Rivera and Zia2016) implemented in a Stokesian dynamics simulation model to measure the diffusion coefficients
 $D_{0}^{\Vert }$
and
 $D_{0}^{\bot }$
. The radial component,
 $D_{0}^{\Vert }$
, is plotted in figure 7 as a function of the particle distance from the cavity centre. Figure 7(a–d) gives
 $D_{0}^{\Vert }$
for particles of size
 $1/5$
,
 $1.5/10$
,
 $1/10$
and
 $1/20$
of the cavity size. The symbols correspond to simulations of spherically confined suspensions from the present study, accounting for many-body hydrodynamic interactions between all particles and the cavity; the solid straight lines correspond to our simulation results for the short-time diffusion in unbound suspensions at matching volume fractions. Finally, the dashed lines correspond to the short-time self-diffusivity of a single particle inside the spherical cavity (Jones Reference Jones, Feuillebois and Sellier2009; Aponte-Rivera & Zia Reference Aponte-Rivera and Zia2016). This provides a means by which to assess the effects of crowding in confinement, similar in ethos to comparison of concentrated unbound suspension data with dilute pair theory.
As a particle diffuses in a suspension, the presence of the no-slip surfaces of the other particles hinders its motion; spherical confinement introduces a distinct no-slip surface that provides additional viscous dissipation. Its effect can be seen in figure 7(a), where the data for confined diffusion fall everywhere below the corresponding volume-fraction data (straight lines). To isolate the contribution of particle–boundary interactions, we show the radial diffusivity of a single particle inside the cavity (dashed curve). A single enclosed particle diffuses fastest at the cavity centre; its diffusivity decreases monotonically as it approaches the wall, where lubrication forces drive its mobility to zero. The presence of additional particles introduces many-body couplings that change the structure and diffusion. These effects emerge for volume fractions as small as
 $\unicode[STIX]{x1D719}=0.1$
, with undulations in the diffusivity that become more pronounced as the concentration increases. The peaks and troughs appear at radial positions that correspond to regions of density accumulation or depletion shown in figure 5. When a pair of particles is separated just enough to fit a third particle (of size
 $2a/R$
), the mobility decreases due to strong hydrodynamic coupling, showing that structural heterogeneity produces dynamical heterogeneity.
However, the volume fraction cannot be specified independently of the particle-to-cavity size ratio; growth in cavity size at fixed volume fraction (plots 7
b–d) permits growth in self-diffusivity. As the cavity size increases, the position dependence of diffusivity becomes less pronounced (cf. figure 7
d). Eventually, in the limit
 $\unicode[STIX]{x1D706}_{c}\rightarrow 0$
(unbound suspension), confinement effects will vanish. However, figure 7(d) shows that confinement effects are qualitatively important even when the particles are only
 $1/20$
of the cavity size, illustrating that confinement can strongly impact the diffusivity of particles with biophysically relevant particle-to-cavity size ratios (Henderson, Gan & Jensen Reference Henderson, Gan and Jensen2007).
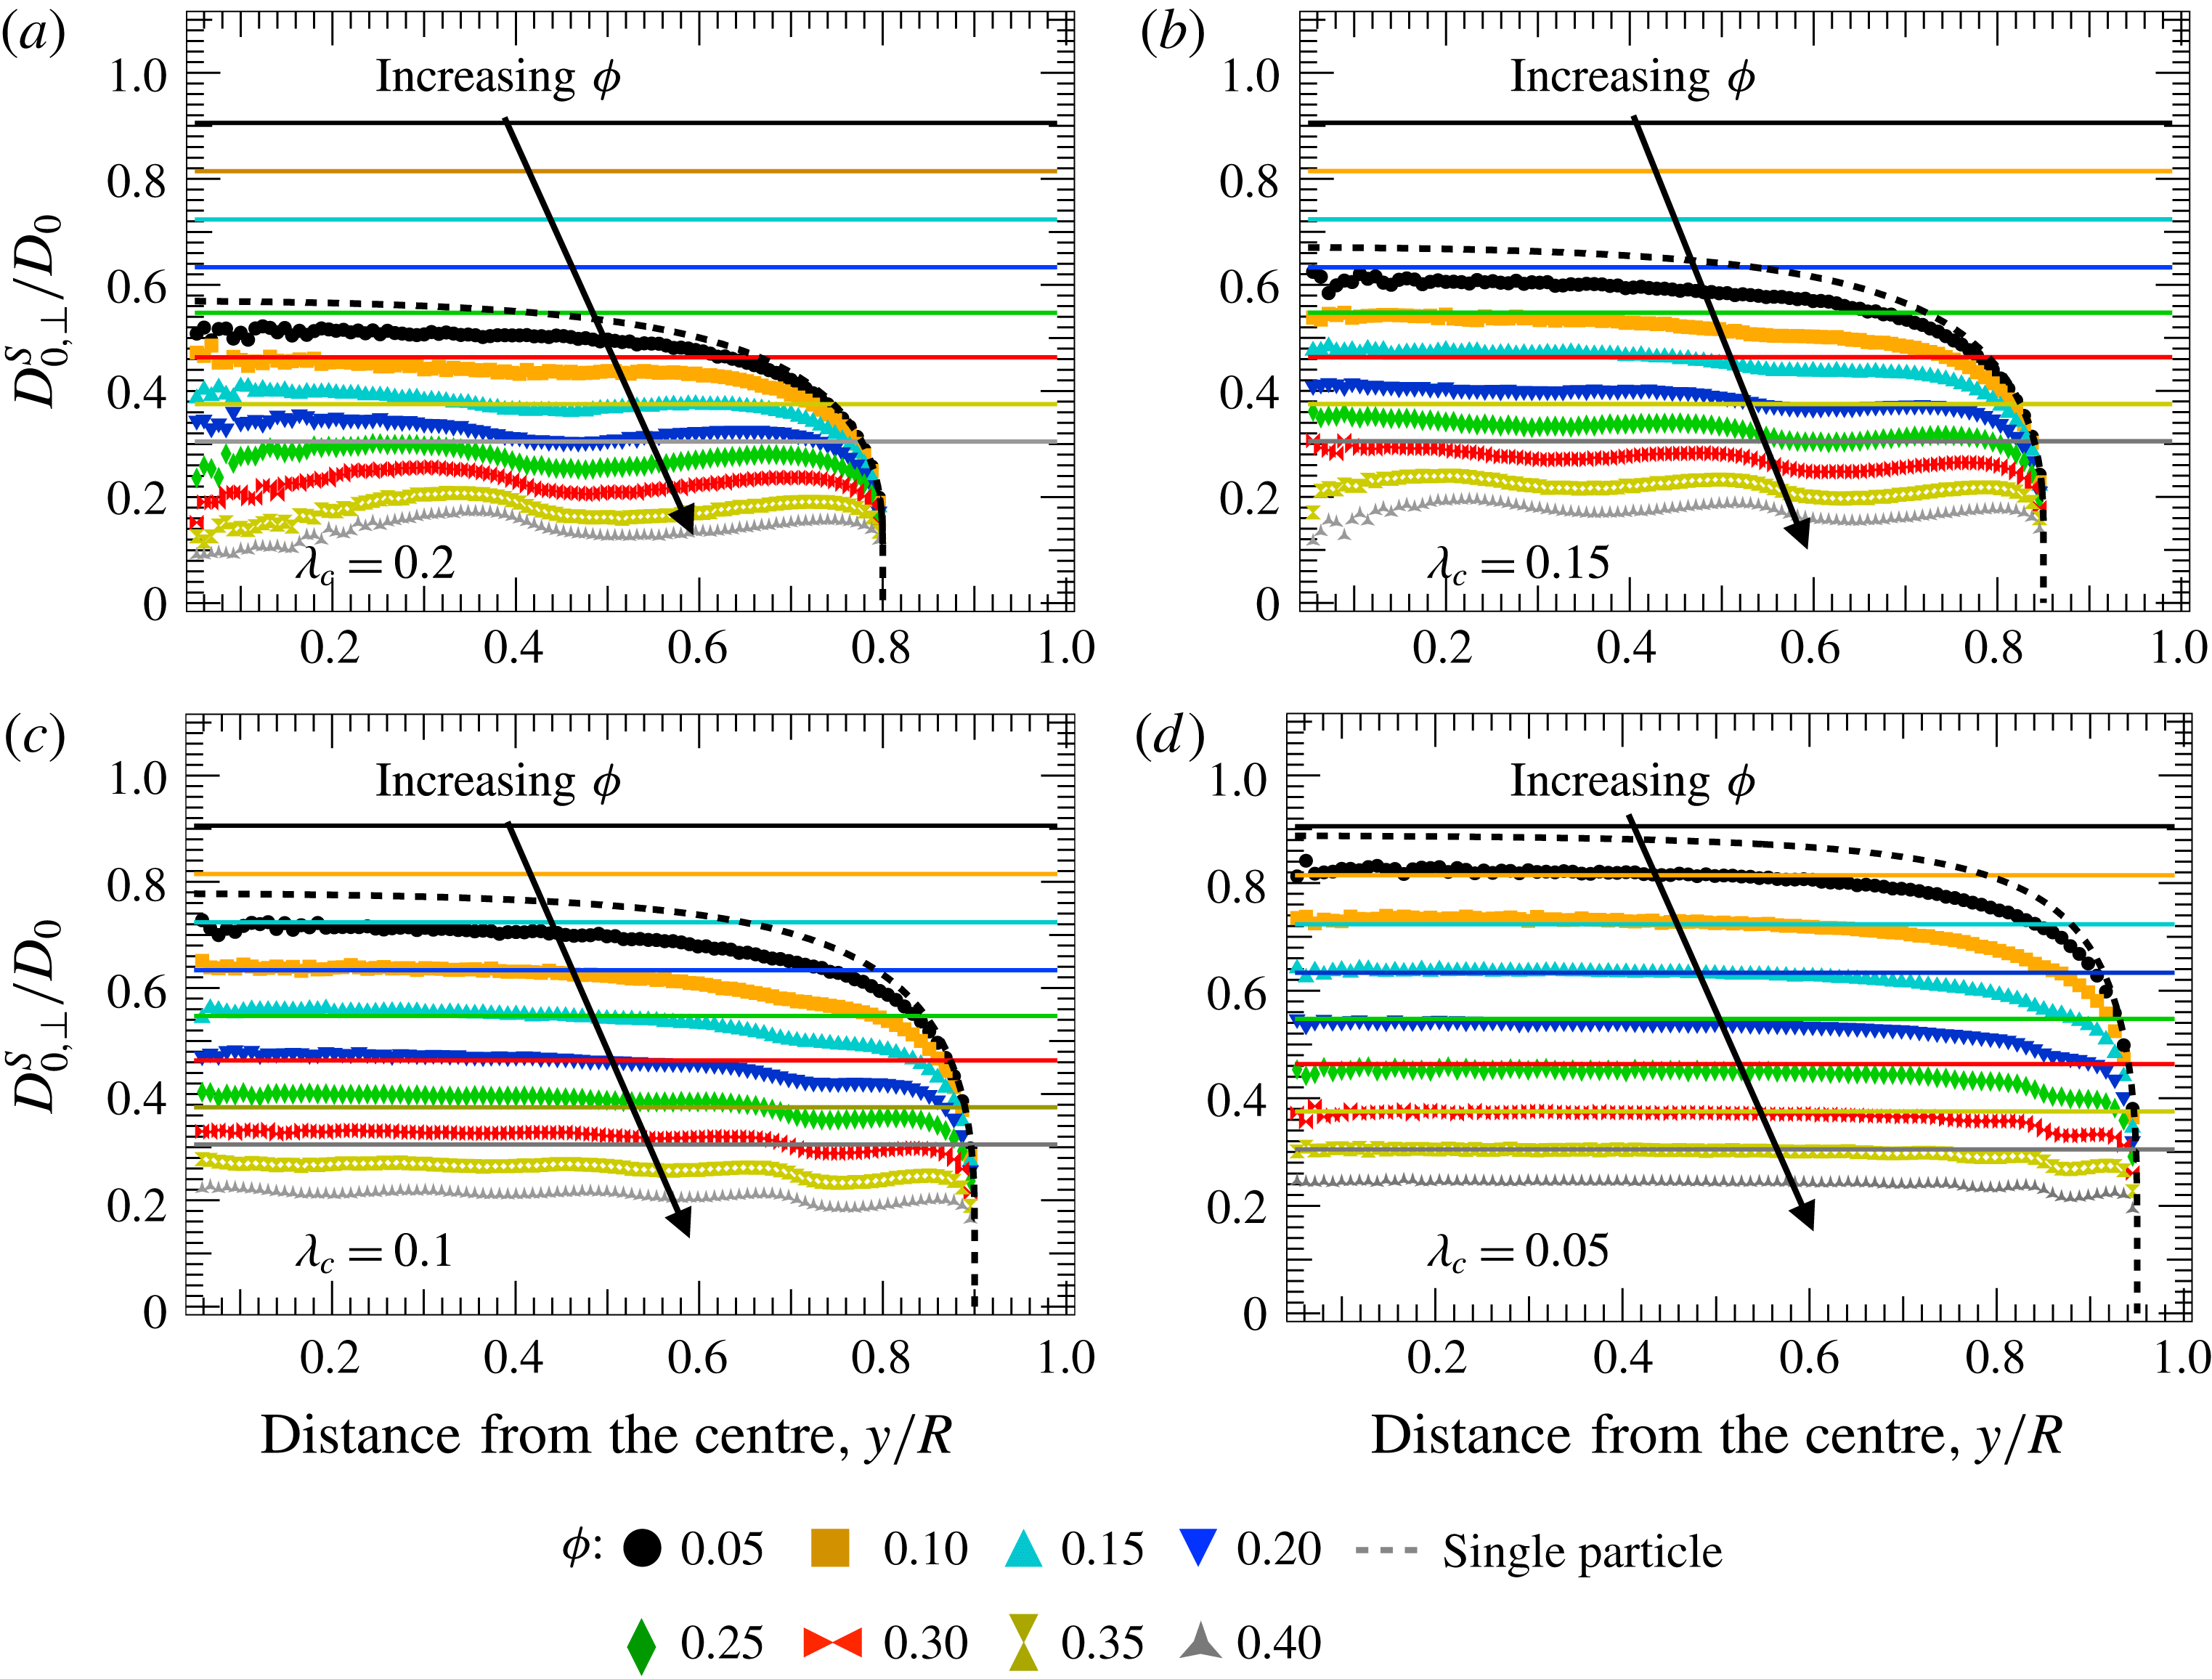
The perpendicular component of the short-time self-diffusivity as a function of the normalized distance from the centre
 $y/R$
for particle-to-cavity size ratios of (a)
 $\unicode[STIX]{x1D706}_{c}=0.2$
, (b)
 $\unicode[STIX]{x1D706}_{c}=0.15$
, (c)
 $\unicode[STIX]{x1D706}_{c}=0.1$
and (d)
 $\unicode[STIX]{x1D706}_{c}=0.05$
. In each plot, the symbols represent the diffusivity of particles in confined suspensions of varying volume fractions and the straight solid lines represent the diffusivity in an unbound suspension (obtained via accelerated Stokesian dynamics) at matching volume fraction. The dashed line represents the diffusivity for a single particle inside the spherical cavity.

Diffusivity transverse to the cavity radius is considered next. In figure 8, the perpendicular component of the short-time self-diffusivity is plotted as a function of the distance from the cavity centre for several volume fractions. Figure 8 illustrates the interplay between cavity size and particle volume fraction, with
 $\unicode[STIX]{x1D706}_{c}=0.2,0.15,0.1$
and
 $0.05$
in figure 8(a–d) respectively. As before, a dashed curve in each plot gives the diffusivity of a single confined particle, and the symbols and solid lines are simulation results from the present study for confined and unconfined domains respectively. As with radial diffusion, the diffusivity of confined particles (
 $\unicode[STIX]{x1D706}_{c}=0.2$
,
 $0.15$
,
 $0.1$
,
 $0.05$
) is hindered and position-dependent, with undulations arising from heterogeneous concentration. Overall, undulations of transverse self-diffusion are weaker than radial undulations, demonstrating that radial variations in volume fraction more strongly impact radial diffusion. Physically, when a particle in the confined suspension moves in the radial direction, the presence of other neighbouring particles has a strong effect, due to hindered entrainment. When a particle moves in the perpendicular direction, the presence of other neighbouring particles has a weaker effect, due to stronger entrainment. Thus, whether a particle is located in a region of accumulation or depletion will cause variations (or undulations) of larger magnitude in the radial diffusion coefficient. Unsurprisingly, perpendicular diffusion vanishes slower than radial diffusion for particles close to the wall, due to logarithmically weaker hydrodynamic coupling associated with perpendicular motion (sliding flow) compared with that resulting from radial motion (squeezing flow), an observation previously predicted for a single enclosed particle by O’Neill & Majumdar (Reference O’Neill and Majumdar1970).
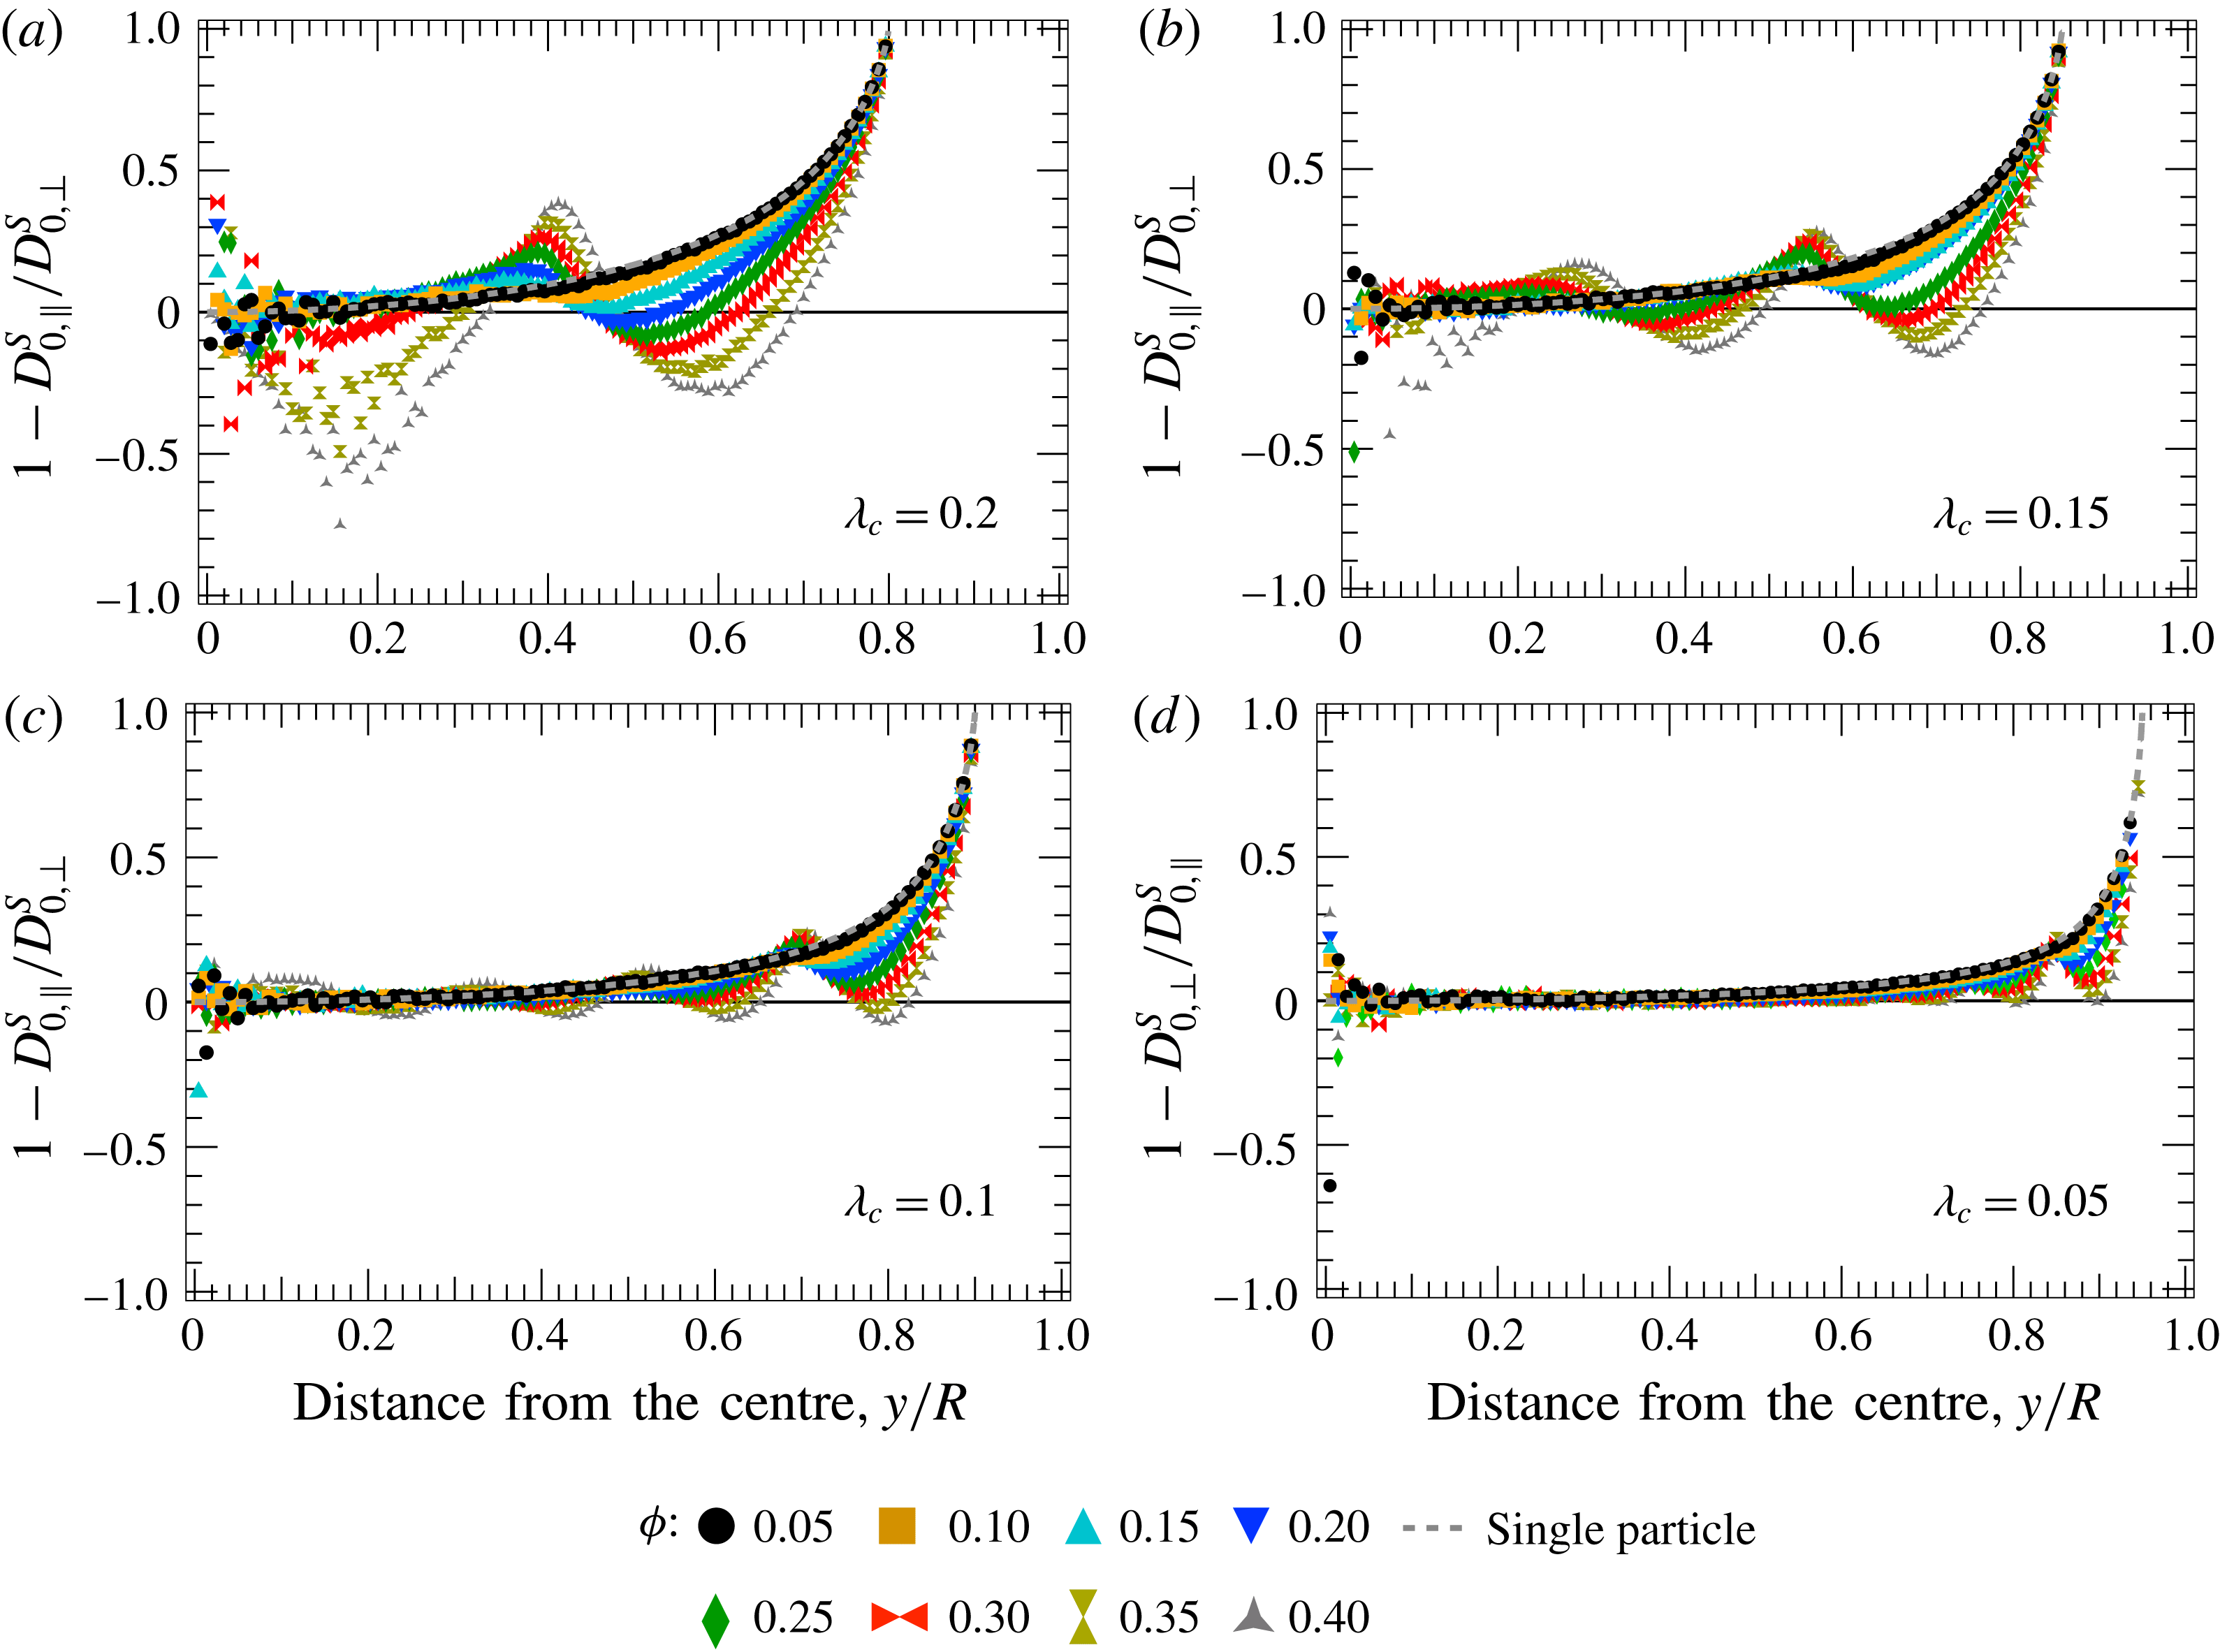
The anisotropy of diffusion plotted as a function of the normalized particle position
 $y/R$
for particle-to-cavity size ratios of (a)
 $\unicode[STIX]{x1D706}_{c}=0.2$
, (b)
 $\unicode[STIX]{x1D706}_{c}=0.15$
, (c)
 $\unicode[STIX]{x1D706}_{c}=0.1$
and (d)
 $\unicode[STIX]{x1D706}_{c}=0.05$
. In each plot, the symbols represent the degree of anisotropy for spherically confined suspensions at varying volume fractions. The straight line represents a value of unity, the limit of isotropic diffusion.

Computation of the ratio of radial to transverse diffusion removes the influence of the volume fraction on the anisotropy of the diffusion tensor, and should reveal the extent to which structure, e.g. layering, sets this anisotropy. The ratio
 $D_{\Vert }/D_{\bot }$
can be subtracted from unity to give a measure of the ‘degree of anisotropy’, where a value of zero corresponds to isotropic diffusion, negative values correspond to preferred radial diffusion and positive values correspond to preferred transverse diffusion. This quantity is plotted in figure 9 as a function of radial position for particles that are
 $1/5$
,
 $1.5/10$
,
 $1/10$
and
 $1/20$
of the cavity size in figure 9(a–d) respectively. The dashed line corresponds to the degree of anisotropy of an isolated particle in the confined domain and symbols to the degree of anisotropy in confined suspensions at various volume fractions. Isotropic diffusion is mapped onto the horizontal line through zero. Particles at the centre of the cavity (left end of axis) exhibit isotropic diffusion, regardless of the particle-to-cavity size ratio. However, the higher standard error in measurements made in bins near the centre of the cavity leads to non-zero values near the centre. As the particle moves any distance away from the centre, anisotropy emerges. Near particle–cavity contact,
 $D_{\Vert }/D_{\bot }\approx 1$
, due to longitudinal lubrication interactions that are strong relative to transverse interactions.
Even though volume fraction dependence is automatically scaled out by the ratio, the undulations do not collapse together, confirming that heterogeneity in particle dynamics arises from structural heterogeneity. In contrast to the behaviour of an isolated particle, where radial diffusion is always slower than perpendicular diffusion, liquid-like structure at high volume fractions results in regions where radial diffusion is faster than perpendicular diffusion. In biophysical systems, such dynamic heterogeneity could serve to optimize the short-time diffusion of particles along the radial or perpendicular direction depending on their position. The dynamical heterogeneity also poses interesting questions for, e.g., the formation of photonic crystals via decreasing cavity radius in spherically confined suspensions (Vogel et al. Reference Vogel, Utech, England, Shirman, Phillips, Koay, Burgess, Kolle, Weitz and Aizenberg2015), where the time scale of shrinking the cavity radius may not allow the structure to relax into a fully crystallized state, or for interpretation of particle diffusive behaviour in the interior of eukaryotic cells (Daniels, Masi & Wirtz Reference Daniels, Masi and Wirtz2006).
In summary, short-time self-diffusivity in a spherically confined domain is position-dependent, anisotropic and exhibits undulations that arise primarily due to boundary- and concentration-induced structure. Such features must be taken into consideration when measuring short-time diffusion coefficients in, e.g., cells, as ignoring them will lead to artificially large or small diffusion coefficients, depending on the particle position and suspension structure. Finally, the ordered dynamical heterogeneity seen here suggests that confinement may promote self-organization of particles in biophysical systems based on their size and self-mobility.
3.3 Comparison with direct measurements: numerical experiments
In the previous section, the short-time self-diffusivity was computed by calculating an ensemble-averaged mobility tensor utilizing a stochastic sampling technique to obtain the tensorial couplings between force and motion. However, particle-tracking experiments typically do not allow direct access to such couplings. Instead, experiments rely on measurement of particle positions, from which the mean-square displacement may be calculated and utilized to determine diffusion coefficients. Here, we compare results from the previous section with the short-time self-diffusivity obtained via numerical particle-tracking ‘experiments’ in the present study. This provides an experimental protocol that accounts for confinement.
In a particle-tracking experiment, measurement of the short-time self-diffusivity requires measurement of the displacements of many particles over a short time interval (lag time) (Peng et al. Reference Peng, Chen, Fischer, Weitz and Tong2009). The mean absolute displacement at each moment in time is obtained by averaging over all particles; it is then subtracted from the absolute displacement of each particle to give its time-dependent displacement from mean motion. The square of this quantity is then averaged across all particles to give the mean-square displacement; if this quantity grows linearly in time, its derivative gives the short-time self-diffusion coefficient. This procedure is utilized for unconfined suspensions, where the absolute starting position of any particle is irrelevant. However, as shown in § 3.2, the short-time self-diffusivity in confinement varies qualitatively with position relative to the cavity centre, an effect that is smeared out and lost by all-particle averaging.
To account for the effects of confinement, in § 3.2, we established a radial binning technique that permits identification and tracking of particles according to their distance from the centre of the cavity. An accurate measurement requires either a large number of particles in each bin, to sample many representative configurations around test particles, or a finite number of particles per bin rearranged into many different configurations within the bin. The latter approach is easily taken by measuring a snapshot of particle positions, waiting until the particles rearrange themselves, and carrying out the measurement again several more times. One way to do this is to trace particle displacements over time, where such data automatically identify the current bin of each particle; a judicious choice of lag time,
 $\unicode[STIX]{x0394}t$
, is made and a new ‘snapshot’ is begun at each new initial time
 $t_{0}$
.
The absolute displacement vector
 $\unicode[STIX]{x1D6AB}\boldsymbol{y}_{ij}(\unicode[STIX]{x0394}t)=\boldsymbol{y}_{ij}(t_{0}+\unicode[STIX]{x0394}t)-\boldsymbol{y}_{ij}(t_{0})$
of a particle
 $i$
located in bin
 $j$
during the lag time interval
 $\unicode[STIX]{x0394}t$
is measured and each particle is binned according to its radial position at time
 $t_{0}$
,
 $y_{ij}=|\,\boldsymbol{y}_{ij}(t_{0})|$
. The mean displacement within the
 $j$
th bin,
 $\langle \,\boldsymbol{y}\rangle _{j}(\unicode[STIX]{x0394}t)$
, is then calculated. When the suspension is quiescent, the mean motion of the particles is vanishingly small. Displacements relative to the mean are then calculated and projected in directions along and perpendicular to the cavity radius by utilizing the orthogonal bases
 $\hat{\boldsymbol{y}}_{ij}(t_{0})\hat{\boldsymbol{y}}_{ij}(t_{0})$
and
 $[\unicode[STIX]{x1D644}-\hat{\boldsymbol{y}}_{ij}(t_{0})\hat{\boldsymbol{y}}_{ij}(t_{0})]/2$
respectively. Along the radial direction, the displacement relative to the mean is defined as
 $$\begin{eqnarray}r_{ij,\Vert }(\unicode[STIX]{x0394}t,t_{0})=[\unicode[STIX]{x1D6AB}\boldsymbol{y}_{ij}(\unicode[STIX]{x0394}t)-\langle \,\boldsymbol{y}\rangle _{j}(\unicode[STIX]{x0394}t)]\boldsymbol{\cdot }\hat{\boldsymbol{y}}_{ij}(t_{0}).\end{eqnarray}$$
Similarly, we define displacements relative to the mean in the perpendicular direction as
 $$\begin{eqnarray}r_{ij,\bot }(\unicode[STIX]{x0394}t,t_{0})=|[\unicode[STIX]{x1D6AB}\boldsymbol{y}_{ij}(\unicode[STIX]{x0394}t)-\langle \,\boldsymbol{y}\rangle _{j}(\unicode[STIX]{x0394}t)]\boldsymbol{\cdot }[\unicode[STIX]{x1D644}-\hat{\boldsymbol{y}}_{ij}(t_{0})\hat{\boldsymbol{y}}_{ij}(t_{0})]/2|.\end{eqnarray}$$
Anisotropy and radial dependence of the mean-square displacement are automatically captured by this method; the mean-square displacement in the radial direction varies with the distance
 $y$
from the centre, i.e. it is the mean-square displacement in the
 $j$
th bin,
 $$\begin{eqnarray}\langle r_{\Vert }^{2}\rangle _{j}(\unicode[STIX]{x0394}t,\unicode[STIX]{x1D706}_{c})=\frac{1}{n_{s}N_{j}}\mathop{\sum }_{k=0}^{n_{s}}\mathop{\sum }_{i=1}^{N_{j}}[r_{ij,\Vert }(\unicode[STIX]{x0394}t,t_{0}=k\unicode[STIX]{x0394}t)]^{2}.\end{eqnarray}$$
In (3.5), the angle brackets represent an ensemble over many configurations within bin
 $j$
, the indices denote the
 $i$
th particle in the
 $j$
th bin,
 $N_{j}$
is the total number of particles in bin
 $j$
and
 $n_{s}$
is the total number of snapshots (realizations)
 $k$
of duration
 $\unicode[STIX]{x0394}t$
. Similarly, the perpendicular mean-square displacement transverse to the radius is
 $$\begin{eqnarray}\langle r_{\bot }^{2}\rangle _{j}(\unicode[STIX]{x0394}t,\unicode[STIX]{x1D706}_{c})=\frac{1}{n_{s}N_{j}}\mathop{\sum }_{k=0}^{n_{s}}\mathop{\sum }_{i=1}^{N_{j}}[r_{ij,\bot }(\unicode[STIX]{x0394}t,t_{0}=k\unicode[STIX]{x0394}t)]^{2}.\end{eqnarray}$$
The radial and perpendicular short-time self-diffusion coefficients, as they vary with position in the cavity, are directly obtained as
 $$\begin{eqnarray}D_{0,j}^{\Vert }(\unicode[STIX]{x1D706}_{c},\unicode[STIX]{x1D719})=\langle r_{\Vert }^{2}\rangle _{j}(\unicode[STIX]{x0394}t,\unicode[STIX]{x1D706}_{c})/(2\unicode[STIX]{x0394}t)\end{eqnarray}$$
and
 $$\begin{eqnarray}D_{0,j}^{\bot }(\unicode[STIX]{x1D706}_{c},\unicode[STIX]{x1D719})=\langle r_{\bot }^{2}\rangle _{j}(\unicode[STIX]{x0394}t,\unicode[STIX]{x1D706}_{c})/(2\unicode[STIX]{x0394}t).\end{eqnarray}$$
The short-time self-diffusion is plotted as a function of radial position by identifying the location of each bin as the distance of the bin centre from the centre of the cavity, given by
 $y_{j}=(j-1/2)/(n_{tot}\unicode[STIX]{x1D706}_{c})$
.
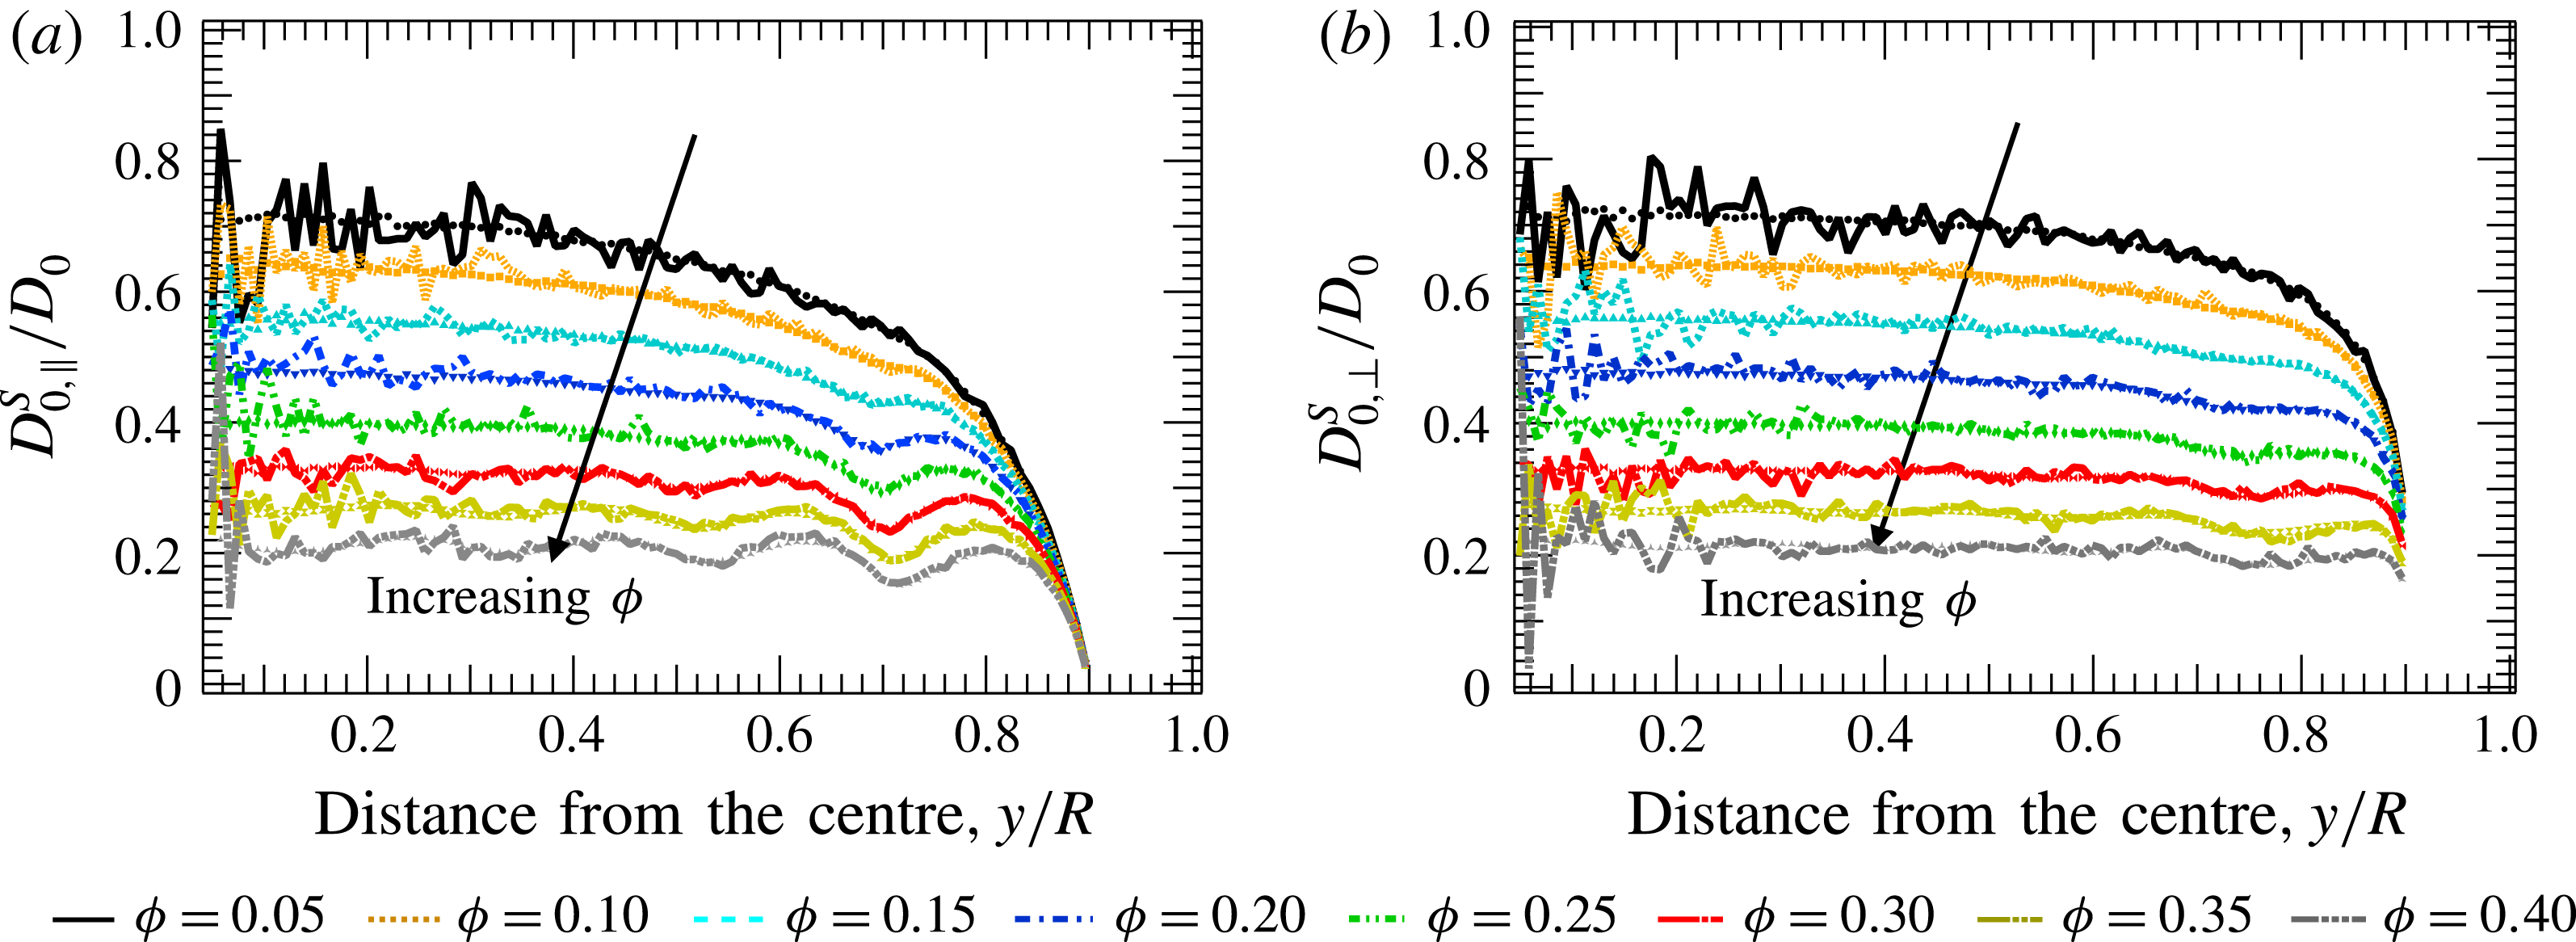
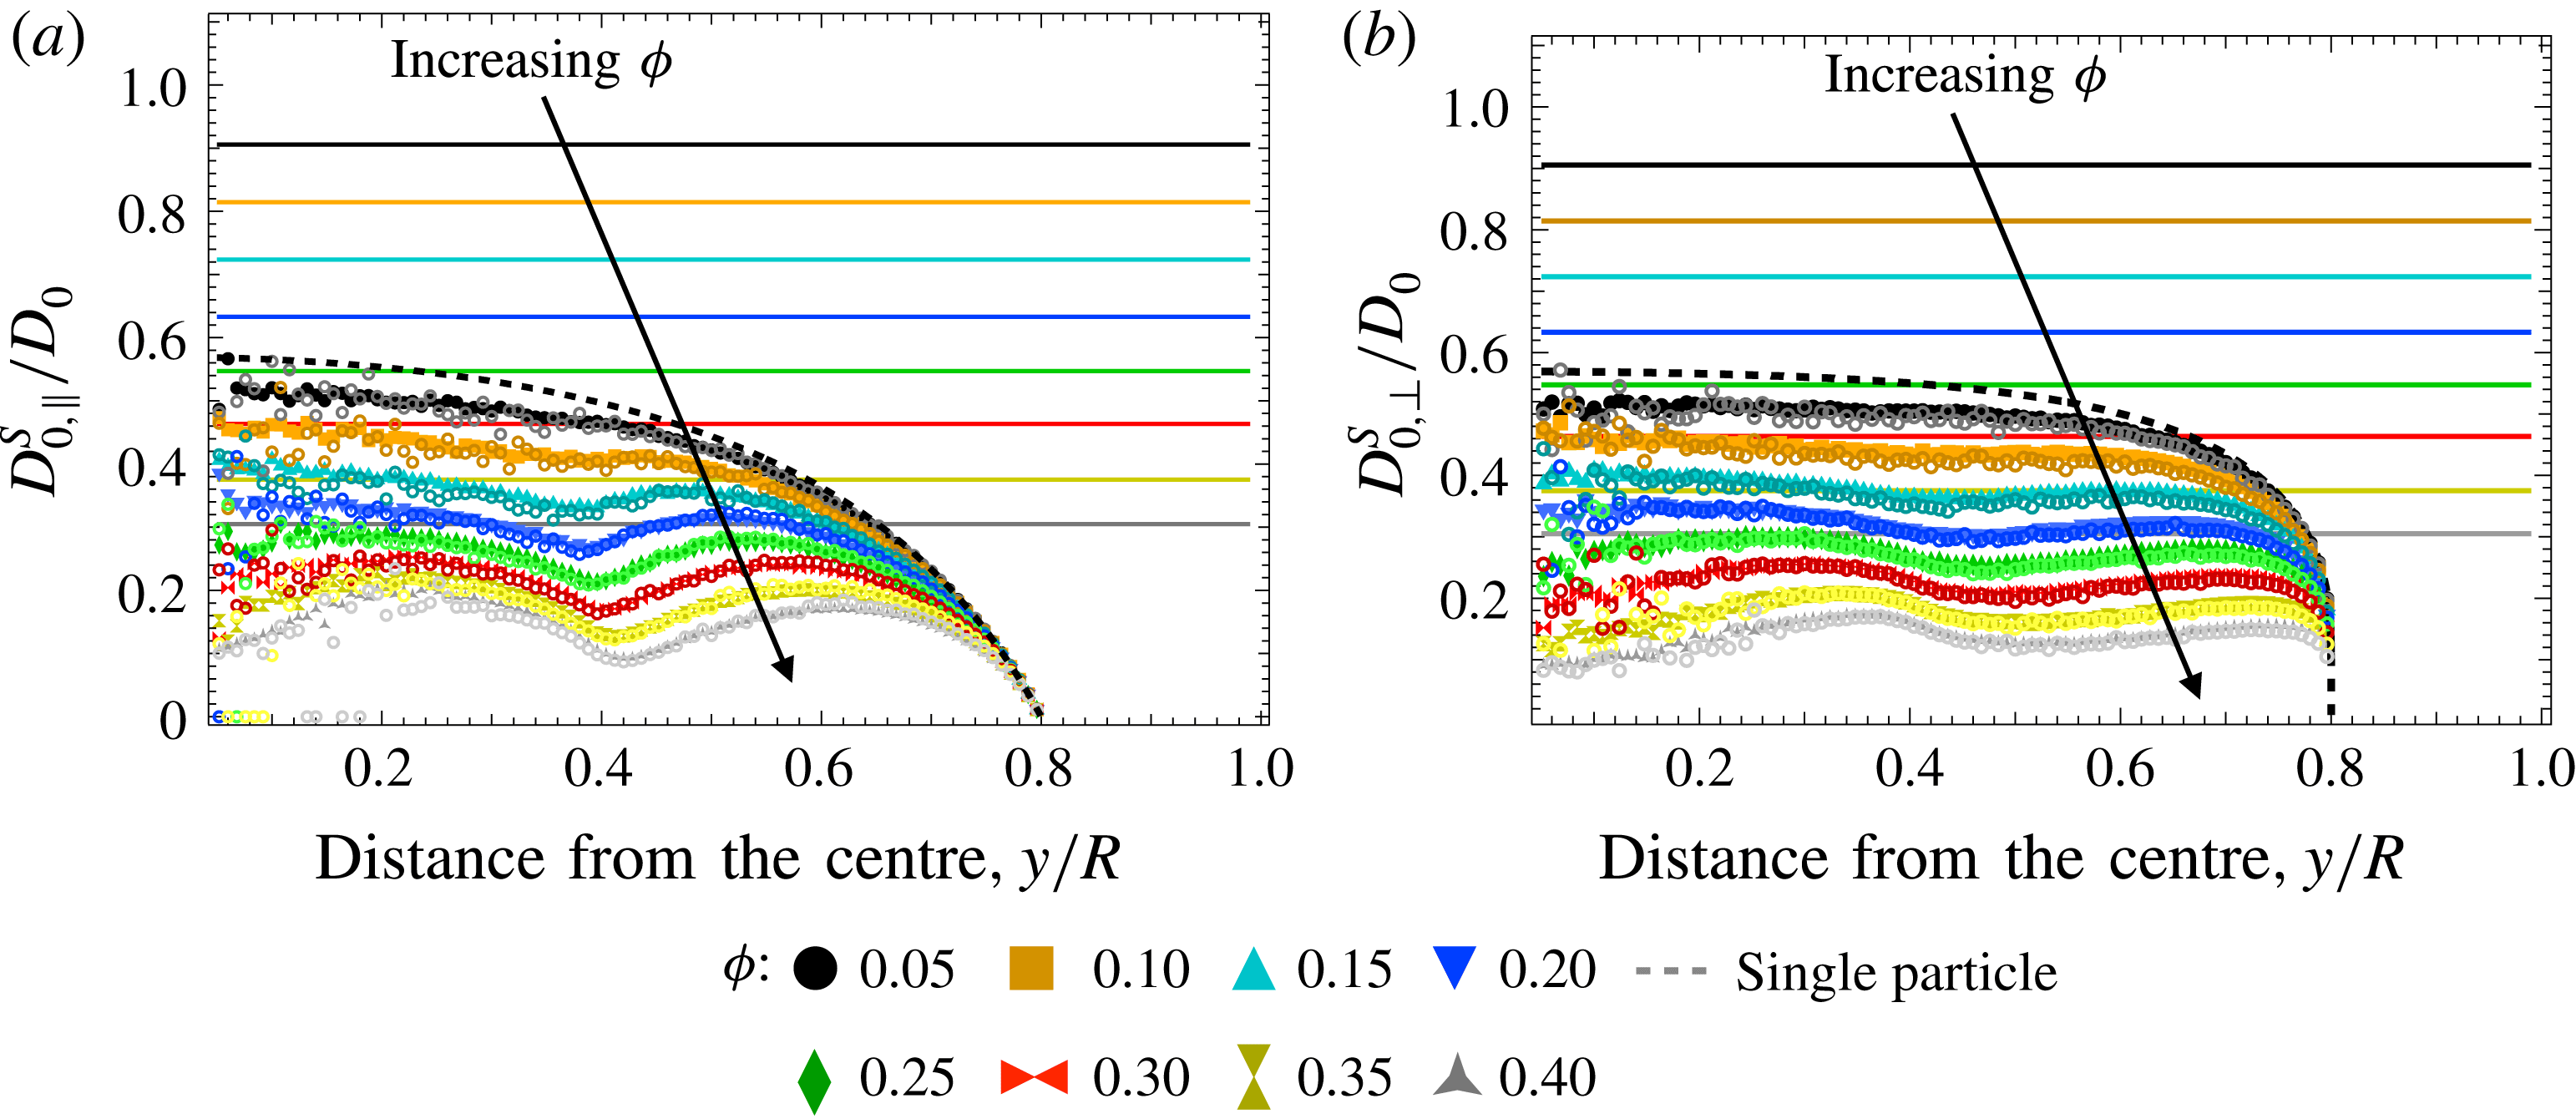
The short-time self-diffusivity in the (a) radial and (b) perpendicular directions obtained via ‘numerical experiments’ in the present study with lag time
 $\unicode[STIX]{x0394}t=0.01$
. Particles are
 $1/10$
of the cavity size, and a range of volume fractions,
 $0.05\leqslant \unicode[STIX]{x1D719}\leqslant 0.4$
, is plotted, as shown in the legend.

The short-time self-diffusivity measured via this method in our simulations is plotted as a function of particle radial position in figure 10 for a range of volume fractions
 $\unicode[STIX]{x1D719}$
and particles of size
 $a=R/10$
. Two sets of data appear in each plot: the solid curves correspond to the experimental measurement of mean-square displacement and the open symbols correspond to the mobility tensors utilized in § 3.2. Each curve is nearly indistinguishable from its corresponding symbol series, indicating excellent agreement between the numerical experiments and the stochastic sampling technique. This also shows that the lag time interval selected,
 $\unicode[STIX]{x0394}t=0.01a^{2}/D_{0}$
, accurately captures short-time self-diffusion for particles
 $1/10$
of the size of the enclosure. At lower volume fractions, there are fewer particles within the small volume at the centre, which leads to a larger standard error for measurements in that region. In a particle-tracking experiment, such error can be mitigated by increasing the number of snapshots (realizations). Another strategy to mitigate the reduced sampling near the centre is to define bins of constant volume, such that bins near the cavity centre have a larger radius and thus a higher probability of containing particles. However, bins of constant volume improve sampling near the centre at the cost of spatial resolution in the measured diffusion coefficient.
It is natural to ask what errors would arise if the effects of the boundary, such as dependence on radial position and anisotropy, were neglected. A discussion of those errors is given next.
3.4 Relative error arising from common approximations
Here, we compare the short-time self-diffusivity that would be obtained in a particle-tracking experiment if the tensor were assumed to be isotropic and position-independent, an approximation often made when data are analysed following the same protocols as utilized for an unbound suspension. We determine the relative error of this approximation, for diffusion along the cavity radius, by comparing the approximated numerical ‘particle-tracking experiments’ with the results obtained in § 3.2. As discussed in § 3.3, in measurements of short-time diffusion in unconfined suspensions, the starting position of any particle is irrelevant. In addition, the motion is isotropic on average and so only the magnitude of particle displacements matters; direction does not matter. Absolute displacements are thus measured and averaged over all particles, to obtain the mean displacement within the cavity,
 $\langle \,\boldsymbol{y}\rangle (\unicode[STIX]{x0394}t)$
. The magnitude of the displacement relative to the mean is then
 $$\begin{eqnarray}r_{ij}^{\prime }(\unicode[STIX]{x0394}t,t_{0})=|\unicode[STIX]{x1D6AB}\boldsymbol{y}_{ij}(\unicode[STIX]{x0394}t)-\langle \,\boldsymbol{y}\rangle (\unicode[STIX]{x0394}t)|.\end{eqnarray}$$
Averaging of the mean-square motion over all particles is equivalent to a spatially averaged mean; the spatially averaged mean-square displacement is then
 $$\begin{eqnarray}\overline{\langle r^{2}\rangle }=\frac{1}{n_{s}N}\mathop{\sum }_{k=0}^{n_{s}}\mathop{\sum }_{j=1}^{n_{tot}}\mathop{\sum }_{i=1}^{N_{j}}[r_{ij}(\unicode[STIX]{x0394}t,t_{0}=k\unicode[STIX]{x0394}t)]^{2},\end{eqnarray}$$
where the overbar indicates a spatial average over the ensemble (bin) average indicated by the angle bracket.
This is a weighted average, where the weight is the probability of finding a particle in the
 $j$
th bin and the average is taken along the cavity radius. As the cavity size increases, the probability of finding a particle in any bin far from the wall becomes uniform, indicating homogeneous suspension structure. Thus, the ensemble-averaged mean-square displacement of unbound suspensions is recovered in the limit
 $\unicode[STIX]{x1D706}_{c}\rightarrow 0$
. This approach smears out anisotropy and dependence on radial position, providing a means with which to determine the error arising from such approximation. Utilizing this approach, the diffusivity may then be approximated as
 $$\begin{eqnarray}D_{MSD}(\unicode[STIX]{x1D706}_{c},\unicode[STIX]{x1D719})=\overline{\langle r^{2}\rangle }(\unicode[STIX]{x1D706}_{c},\unicode[STIX]{x1D719})/6\unicode[STIX]{x0394}t,\end{eqnarray}$$
where
 $\unicode[STIX]{x0394}t\ll a^{2}/D_{0}$
, so that particle displacements are measured during the short-time self-diffusive regime. To quantify the error arising from this approximation, we define the relative error for diffusion along the cavity radius as
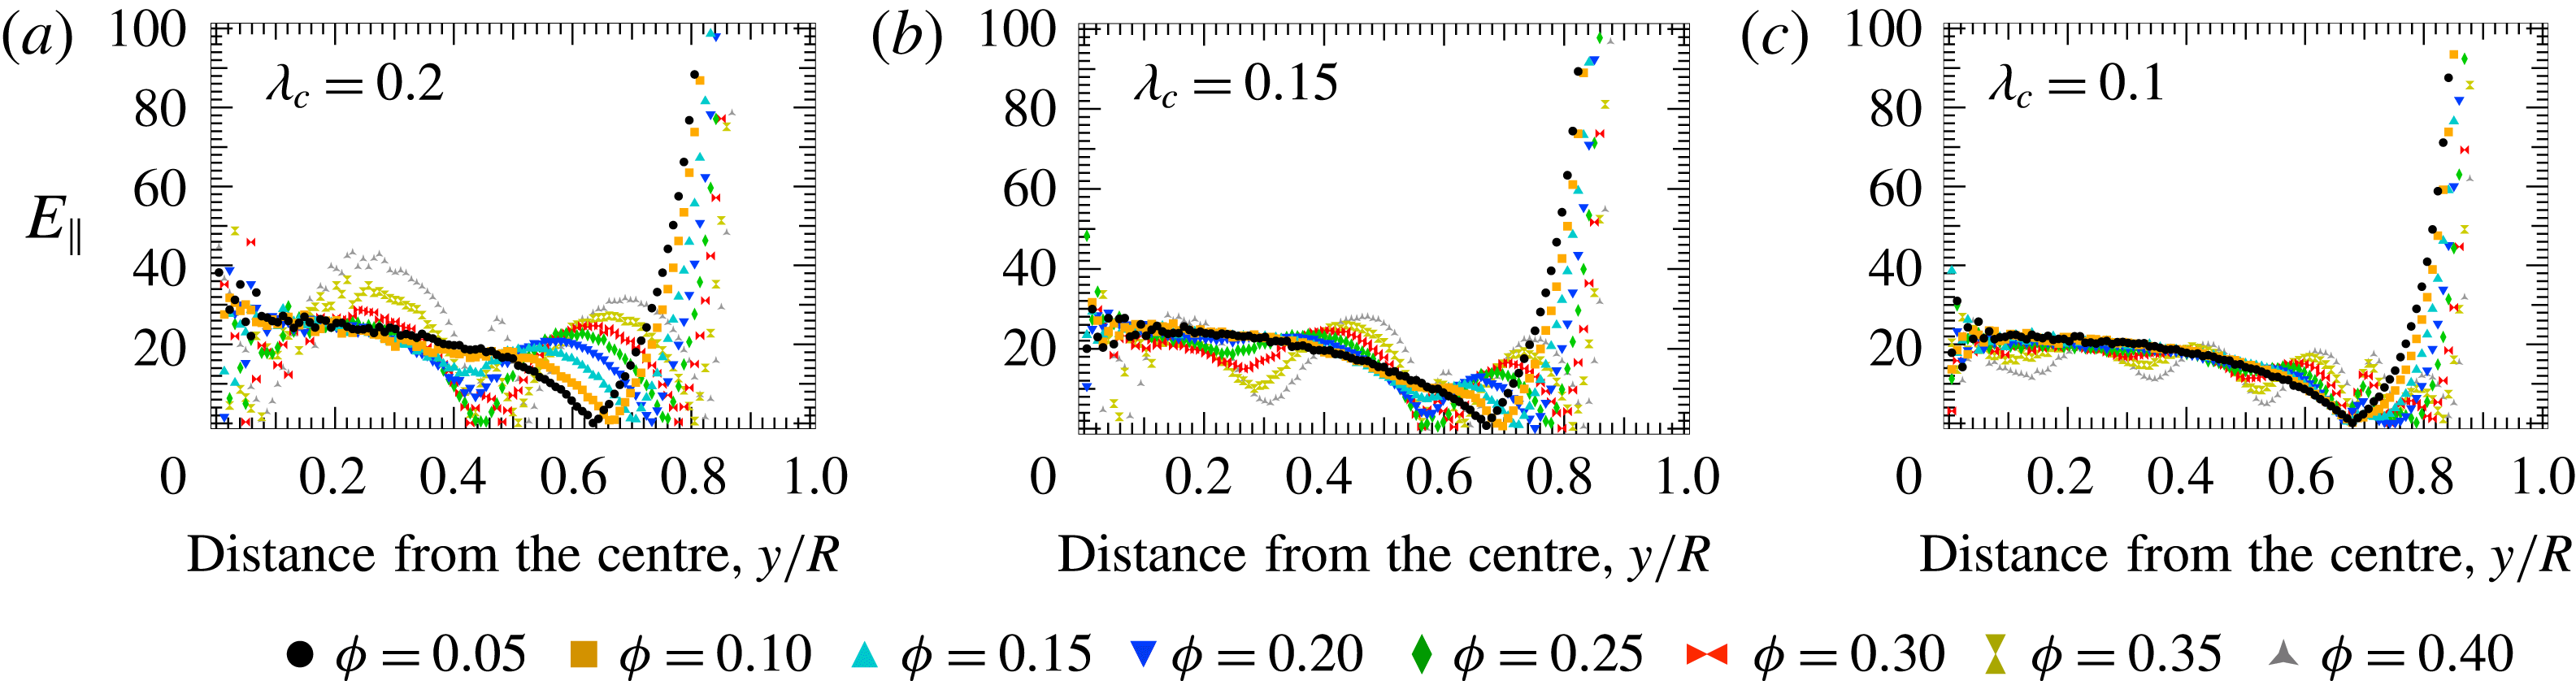
 $$\begin{eqnarray}E_{\Vert }(\,y/R,\unicode[STIX]{x1D706}_{c},\unicode[STIX]{x1D719})=100\frac{|D_{0}^{\Vert }(\,y/R,\unicode[STIX]{x1D706}_{c},\unicode[STIX]{x1D719})-D_{MSD}(\unicode[STIX]{x1D706}_{c},\unicode[STIX]{x1D719})|}{D_{0}^{\Vert }(\,y/R,\unicode[STIX]{x1D706}_{c},\unicode[STIX]{x1D719})}.\end{eqnarray}$$
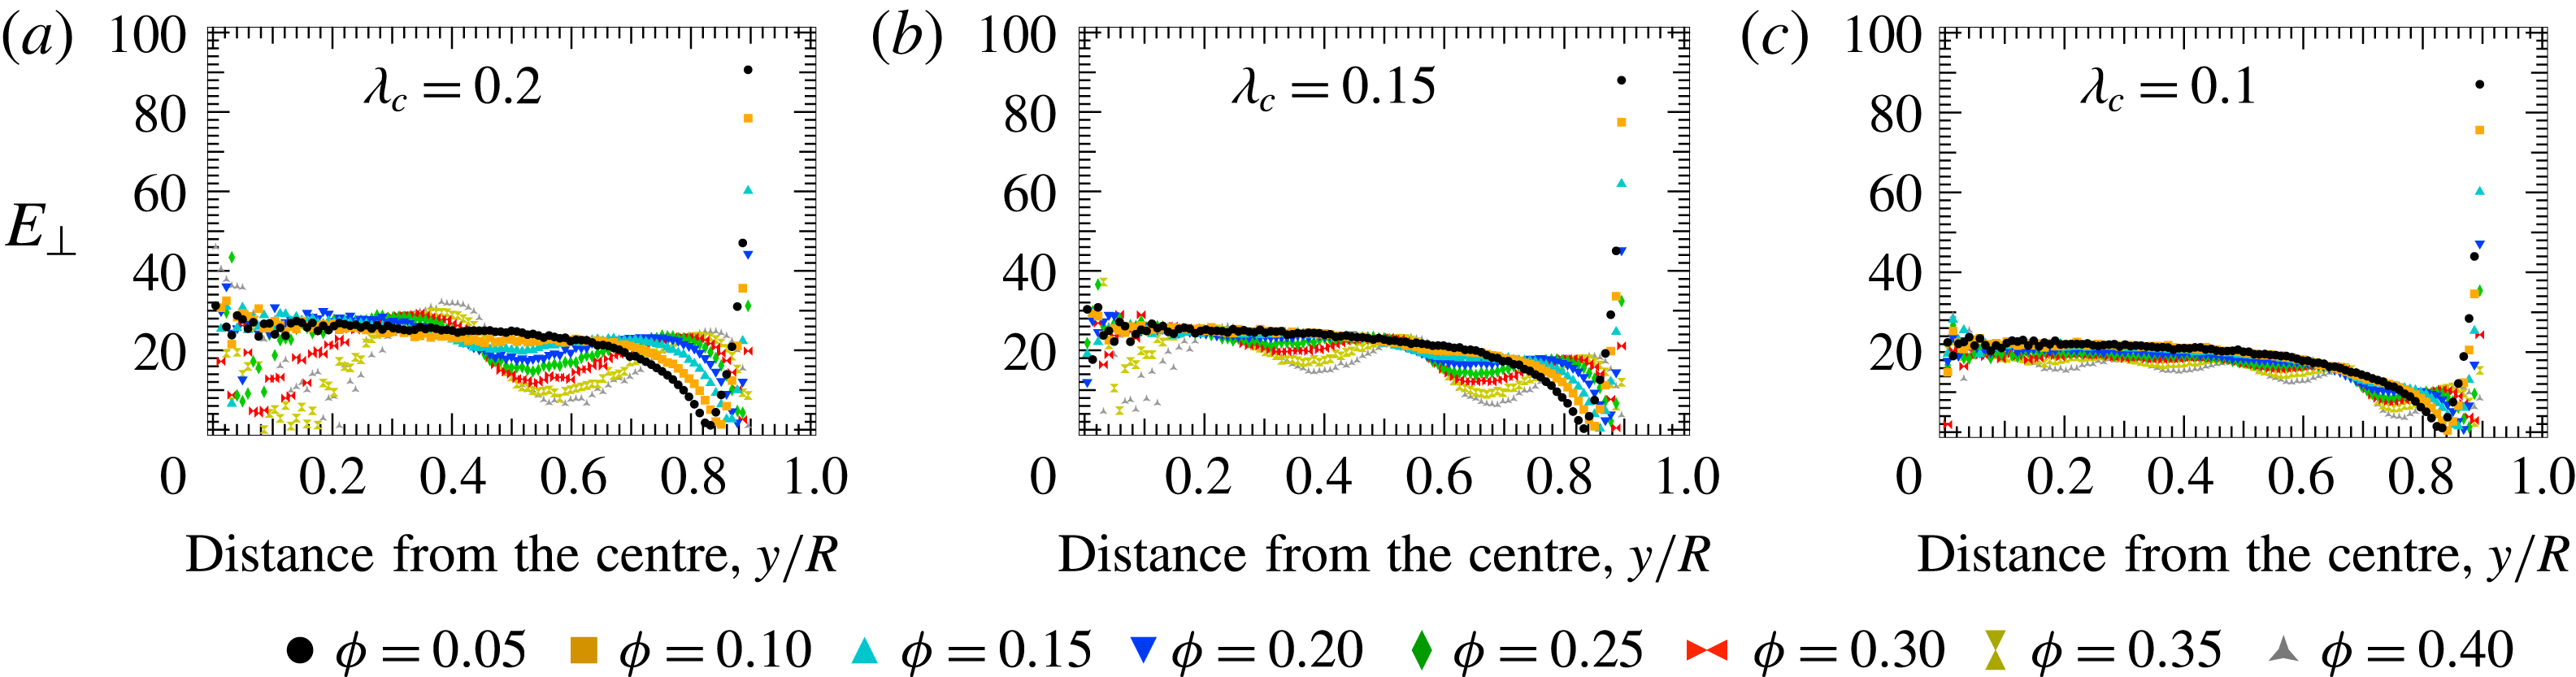
The relative error of the short-time self-diffusivity in the radial direction approximated by the early-time behaviour of the mean-square displacement. Panels (a–c) correspond to the relative error in the radial direction for suspensions with a particle-to-cavity relative size of
 $1/5$
,
 $1.5/10$
and
 $1/10$
respectively.

In figure 11(a–c), the relative error associated with approximating radial diffusion via this anisotropic smeared averaging is plotted for particle-to-cavity relative sizes of
 $1/5$
,
 $1.5/10$
and
 $1/10$
respectively; different curves correspond to different volume fractions. Beginning with the relative error for dilute suspensions (
 $\unicode[STIX]{x1D719}=0.05$
) of particles that are
 $1/5$
of the cavity size, the plot shows that near the centre, the relative error can be as high as
 $35\,\%$
. Near the dilute limit, error decreases to a minimum, and suddenly reverses toward a maximum as the wall is approached. This reversal occurs where the coarse prediction changes from an underprediction to an overprediction of the correct value. As the volume fraction increases, several such reversals occur, evidence of the impact of neglecting structural heterogeneity. The spatial variation of the error changes with the volume fraction: the relative error in a concentrated suspension is higher than that of a dilute suspension at a position of
 $y/R\approx 0.3$
, whereas the relative error in a concentrated suspension is smaller than that of a dilute suspension at a position of
 $y/R\approx 0.45$
. This shows that pronounced error persists as the concentration increases, i.e. that crowding and confinement do not give bulk behaviour. With decreasing particle size, the relative error decreases for all positions away from the cavity wall. Large errors are still observed near the centre for the smallest particles, with a particle-to-cavity relative size of
 $1/10$
. Close to the cavity wall, the relative error diverges regardless of the particle-to-cavity relative size, showing that such approximations will lead to large errors when predicting the motion of particles near the cavity surface. Overall, the assumption that diffusion is isotropic and independent of position leads to serious qualitative errors in the predicted radial diffusion, which increase with increasing particle size. Large errors are obtained whether the particle is near the cavity centre or close to the cavity wall. Similar behaviour is observed for the relative error along the direction perpendicular to the cavity radius, and this is discussed in appendix D.
Overall, the assumption that diffusion is isotropic and independent of position leads to qualitative error in the predicted radial diffusion even for small particles at dilute concentrations; the error only increases with increasing particle size. The relative errors observed for diffusion radial and perpendicular (see appendix D) to the cavity radius highlight the importance of accounting for the effect of confinement when measuring particle diffusivities in 3D-confined suspensions, as such coarse approximations can fail to predict variations in mobility which could aid in self-organization.
3.5 Long-time behaviour: mean-square displacement
A diffusing particle will distort the suspension structure as it probes its surrounding medium, leading to correlated motion as it escapes a ‘cage’ of neighbouring particles, during which its mean-square displacement grows sublinearly in time (Rallison & Hinch Reference Rallison and Hinch1986). In an unbound domain, a particle executes a random walk through the suspension after many such structural rearrangements, undergoing long-time self-diffusion. In a 3D-confined domain, a particle will also distort the surrounding structure as it exchanges places with its neighbours, but after many such exchanges, the particle is still confined to a finite domain. Tough & van den Broeck (Reference Tough and van den Broeck1989) showed that a single point particle will exhibit a long-time plateau in mean-square displacement as this finite domain is explored. A question left open by previous studies is whether, between these two limits, a long-time diffusive regime exists. In this section, we continue our study of confined particle dynamics, but now study particle motion over longer times.
Over long times, a particle will wander from its starting point, sampling many different radial positions and, as a consequence, different radial bins within the cavity. This suggests that a spatially averaged mean-square displacement is appropriate for the study of long-time particle dynamics. Absolute displacements
 $\unicode[STIX]{x0394}\boldsymbol{y}_{ij}$
are thus measured and averaged over all particles to determine the mean displacement within the cavity,
 $\langle \,\boldsymbol{y}\rangle (\unicode[STIX]{x0394}t)$
. We note that, as before, the mean motion of the particles is vanishingly small in quiescent suspensions. Radial displacements relative to this mean are then calculated via
 $$\begin{eqnarray}r_{ij,\Vert }^{\prime }(\unicode[STIX]{x0394}t,t_{0})=[\unicode[STIX]{x1D6AB}\boldsymbol{y}_{ij}(\unicode[STIX]{x0394}t)-\langle \,\boldsymbol{y}\rangle (\unicode[STIX]{x0394}t)]\boldsymbol{\cdot }\hat{\boldsymbol{y}}_{ij}(t_{0}),\end{eqnarray}$$
where the prime indicates that displacements are relative to the mean displacement within the cavity. Similarly, the perpendicular displacement relative to the mean is given by
 $$\begin{eqnarray}r_{ij,\bot }^{\prime }(\unicode[STIX]{x0394}t,t_{0})=|[\unicode[STIX]{x1D6AB}\boldsymbol{y}_{ij}(\unicode[STIX]{x0394}t)-\langle \,\boldsymbol{y}\rangle (\unicode[STIX]{x0394}t)]\boldsymbol{\cdot }[\unicode[STIX]{x1D644}-\hat{\boldsymbol{y}}_{ij}(t_{0})\hat{\boldsymbol{y}}_{ij}(t_{0})]/2|.\end{eqnarray}$$
In contrast to (3.3) and (3.4), equations (3.13) and (3.14) give particle displacement relative to the spatially averaged mean motion,
 $\langle \,\boldsymbol{y}\rangle (\unicode[STIX]{x0394}t)$
. The squares of these quantities are then ensemble-averaged to give the spatially averaged radial and perpendicular mean-square displacements,
 $$\begin{eqnarray}\overline{\langle r_{\Vert }^{2}\rangle }(\unicode[STIX]{x0394}t,\unicode[STIX]{x1D706}_{c})=\frac{1}{n_{s}N}\mathop{\sum }_{k=0}^{n_{s}}\mathop{\sum }_{j=1}^{n_{tot}}\mathop{\sum }_{i=1}^{N_{j}}[r_{ij,\Vert }(\unicode[STIX]{x0394}t,t_{0}=k\unicode[STIX]{x0394}t)]^{2}\end{eqnarray}$$
and
 $$\begin{eqnarray}\overline{\langle r_{\bot }^{2}\rangle }(\unicode[STIX]{x0394}t,\unicode[STIX]{x1D706}_{c})=\frac{1}{n_{s}N}\mathop{\sum }_{k=0}^{n_{s}}\mathop{\sum }_{j=1}^{n_{tot}}\mathop{\sum }_{i=1}^{N_{j}}[r_{ij,\bot }^{\prime }(\unicode[STIX]{x0394}t,t_{0}=k\unicode[STIX]{x0394}t)]^{2},\end{eqnarray}$$
where the overbar on the left-hand side indicates a spatially averaged quantity with respect to the radial position and the angle brackets represent an ensemble (realization) average. In the confined domain, (3.15) and (3.16) are weighted averages, where bins with more particles weight the average more than bins of smaller volume. The implication of such a technique is that the overall measurement gives a better idea of what is going on near the wall, but a less clear idea of dynamics elsewhere.
The average (a) radial and (b) perpendicular mean-square displacements plotted as a function of lag time for a suspension with particles that are
 $1.5/10$
of the size of the cavity, for several volume fractions, as shown in the legend. The solid, dashed and dashed-dotted curves correspond to suspensions of different volume fractions from the present study, as shown in the legend. The dotted curve in (a) corresponds to the result of Tough & van den Broeck (Reference Tough and van den Broeck1989) for a single point particle diffusing in one dimension.

The radial and perpendicular spatially averaged mean-square displacements are plotted as a function of lag time for a particle-to-cavity size of
 $1.5/10$
in figure 12(a,b) respectively. Several curves are shown, representing a range of volume fractions. In figure 12(a), the average radial mean-square displacement grows linearly in time at short times, as particles undergo short-time self-diffusion. At intermediate times, the average radial mean-square displacement grows sublinearly for
 $0.05\leqslant \unicode[STIX]{x1D719}\leqslant 0.15$
, suggesting that particles undergo correlated motion as they exchange places with their neighbours. The power-law exponent of this subdiffusive motion decreases with increasing lag time and eventually vanishes to a long-time plateau. The time required to reach the long-time limit corresponds to the time required for particles to sample the entire domain. When particles are dilute and large, ‘caging’ effects arise from both the cavity and other particles, as evidenced by the subdiffusive motion prior to the long-time plateau. As the concentration increases,
 $0.2\leqslant \unicode[STIX]{x1D719}\leqslant 0.4$
, an intermediate superdiffusive region emerges, separating the short-time diffusion and the long-time plateau. Thus, the combined effects of crowding, hydrodynamic interactions and confinement can lead to anomalous transport. This region of superdiffusive motion occurs before the long-time plateau, but after the subdiffusive transition that occurs after short-time diffusion. This suggests that ‘cage-hopping’ events play a role in setting the superdiffusive character of the average radial mean-square displacement.
The data from the present study can be compared with simplified theory, as shown by the dotted curve in figure 12(a), which corresponds to the model of Tough & van den Broeck (Reference Tough and van den Broeck1989) for point-particle diffusion along a line in a cavity. The data from the present study shown in the plot are projected along one direction as well, providing an opportunity for qualitative comparison. Unsurprisingly, the point-particle theory and the concentrated finite-size results reach the same long-time plateau since entropy (no flux) restricts long-time motion to the cavity boundary. However, the theory strongly overpredicts the short-time diffusion due to the neglect of particle size and hydrodynamic interactions. More seriously, it fails to predict the anomalous transport observed at higher volume fractions, confirming that crowding and hydrodynamic interactions play a critical role in this behaviour.
The average perpendicular mean-square displacement is plotted in figure 12(b). For
 $0.05\leqslant \unicode[STIX]{x1D719}\leqslant 0.15$
, it is actually subdiffusive, with a power-law exponent that vanishes to a long-time plateau. Consistent with the behaviour observed in figure 12(a), ‘caging’ arises both from the cavity and from other particles. As the concentration increases,
 $0.2\leqslant \unicode[STIX]{x1D719}\leqslant 0.4$
, an intermediate subdiffusive region emerges during the lag times where the average radial mean-square displacement displays a superdiffusive behaviour. As with the average radial mean-square displacement, this intermediate region occurs before the long-time plateau but after the short-time diffusion region, suggesting that ‘cage-hopping’ events play a role in this behaviour as well.
Overall, the combined effects of crowding, hydrodynamic interactions and confinement lead to anomalous transport that qualitatively depends on the direction of motion. Caging effects of both the surrounding particles and the enclosing cavity produce anomalous transport – superdiffusion in the radial direction and subdiffusion in the transverse direction. In the next section, we explore the idea that cage-hopping dynamics underlie this behaviour; we also provide further evidence that cage-hopping events play a role in particle dynamics at these time scales by analysing the average excess kurtosis of the confined suspension.
3.6 Dynamics of cage hopping
The linear growth of the mean-square displacement with time for diffusive motion produces a Gaussian distribution of particle displacements; deviation from Gaussian behaviour can arise when the behaviour becomes sub- or superdiffusive. The excess kurtosis measures the deviation of the tails of a probability distribution from Gaussian behaviour, focusing on regions of the distribution that are far from the mean. Here, we define the average excess kurtosis of motion in a spherically confined domain, where positive values indicate a broader tail (increased probability of displacements far from the mean) and negative values indicate a thinner tail (lower probability of displacements far from the mean) compared with a Gaussian distribution. An increased likelihood of large displacements is associated with the structural rearrangements particles must undergo in order to jump between cages of neighbouring particles (Weeks et al. Reference Weeks, Crocker, Levitt, Schofield and Weitz2000). The excess kurtosis thus provides a means by which to identify the time scale over which such ‘cage-hopping’ events take place, as well as which direction plays a more important role in cage hopping.
We define the average excess kurtosis in the radial direction as
 $$\begin{eqnarray}\unicode[STIX]{x1D6FC}_{\Vert }=\frac{\displaystyle \mathop{\sum }_{j}^{n_{tot}}\langle r_{\Vert ,j}^{4}\rangle }{\displaystyle \mathop{\sum }_{j}^{n_{tot}}3\langle r_{\Vert ,j}^{2}\rangle ^{2}}-1,\end{eqnarray}$$
where
 $r_{\Vert ,j}^{4}$
represents the fourth moment of the probability distribution of particle displacements in the radial direction and the angle brackets represent an average over particles within a bin
 $j$
. Conducting the average within radial bins ensures that the average excess kurtosis will vanish at times small enough to observe short-time diffusion. Similarly, the average excess kurtosis in the perpendicular direction is
 $$\begin{eqnarray}\unicode[STIX]{x1D6FC}_{\bot }=\frac{\displaystyle \mathop{\sum }_{j}^{n_{tot}}\langle r_{\bot ,j}^{4}\rangle }{\displaystyle \mathop{\sum }_{j}^{n_{tot}}3\langle r_{\bot ,j}^{2}\rangle ^{2}}-1.\end{eqnarray}$$
The average excess kurtosis in the radial direction is plotted as a function of lag time in figure 13 for a particle-to-cavity relative size of
 $1.5/10$
. Several curves are shown, representing the range of volume fractions
 $0.05\leqslant \unicode[STIX]{x1D719}\leqslant 0.4$
. In figure 13(a), the average radial excess kurtosis is vanishingly small at early times; that is, particle motion is primarily diffusive. With increasing lag time, the average radial excess kurtosis increases, suggesting that large displacements along the radial direction take place. A maximum is reached at intermediate times, after which the average radial excess kurtosis decreases towards a long-time plateau as particles sample the extent of the domain. The time required for the average radial excess kurtosis to cross over from positive to negative increases with the volume fraction. This suggests that structural rearrangements become slower as crowding increases.
The average (a) radial and (b) perpendicular excess kurtosis as a function of lag time for a suspension with particles that are
 $1.5/10$
of the size of the cavity. The different curves represent different volume fractions, as shown in the legend.

In figure 13(b), the average perpendicular excess kurtosis is plotted and again shown to be vanishingly small at early times where particle motion is diffusive. However, in contrast to the average radial excess kurtosis, for volume fractions in the range
 $0.05\leqslant \unicode[STIX]{x1D719}\leqslant 0.2$
, the average perpendicular excess kurtosis does not increase to positive values; it remains vanishingly small and only becomes negative as the particle dynamics approaches the long-time plateau.
These results suggest that cage-hopping events occur mainly along the radial direction for this range of volume fractions. In a biophysical system, such behaviour could allow particles to sample their environment more rapidly along the radial direction, an effect that would act to mitigate the hydrodynamic hindrance of the cavity surface. At higher volume fractions,
 $0.25\leqslant \unicode[STIX]{x1D719}\leqslant 0.4$
, the average perpendicular excess kurtosis becomes weakly positive, suggesting that larger displacements are favoured and cage-hopping events occur along the perpendicular direction. However, the weakly positive values indicate that the role of perpendicular displacements is smaller than that of radial displacements, and that radial displacements are more important. Similarly to the average radial excess kurtosis, the time required for the average perpendicular excess kurtosis to attain negative values increases with increasing volume fraction, suggesting slower dynamics as crowding increases.
Overall, the average excess kurtosis suggests that, unsurprisingly, the time scale required to escape cages of neighbouring particles increases with the volume fraction. It also suggests that cage effects from the confining boundary or neighbouring particles cause displacements along the radial direction to become larger, while having little effect on structural rearrangements along the perpendicular direction. These anisotropic long-time particle dynamics pose interesting questions for microconfined systems. For example, in the crowded environment of the cell interior, cage rearrangements occurring mainly along the radial direction could mitigate hydrodynamic hindrance from the surface of the cell membrane or a cellular microcompartment, allowing particles to better explore their surroundings. Another example is the relaxation processes taking place during the formation of photonic balls (Kim et al. Reference Kim, Park, Choi, Manoharan and Weitz2014; Vogel et al. Reference Vogel, Utech, England, Shirman, Phillips, Koay, Burgess, Kolle, Weitz and Aizenberg2015), where the volume fraction is increased via a reduction of the radius of a spherical boundary.
4 Conclusions
We have studied the short- and long-time transport properties of concentrated spherically confined colloidal suspensions for a range of particle-to-cavity relative sizes, finding that the hydrodynamic and entropic effects of confinement exert a qualitative impact on the self-diffusion and micro-structure. At short times, the diffusion in the 3D-confined domain is anisotropic and dependent on the particle distance from the cavity centre. As the volume fraction increases, boundary- and concentration-induced spatial heterogeneity in the particle concentration causes radial undulations in the short-time diffusion. Confinement hinders the short-time diffusion, and this hindrance depends on the particle-to-cavity relative size, the volume fraction and the radial position inside the spherical cavity. The ordered dynamical heterogeneity seen here could also promote particle self-organization based on self-mobility, which may have important implications in biophysical systems.
To account for confinement effects in particle-tracking experiments, we propose a radial binning technique and decomposition of particle displacements into an orthogonal basis. The technique was tested by conducting ‘numerical experiments’, where particle displacements and positions were tracked through simulation and utilized to calculate short-time diffusion coefficients by computing mean-square displacements in directions along and perpendicular to the cavity radius. The method was found to accurately reproduce the short-time diffusion coefficients obtained from the ensemble-averaged mobility, and illustrates the importance of selection of the lag time interval.
Long-time transport behaviour was studied utilizing a spatially averaged mean-square displacement. No long-time self-diffusive regime exists in the confined domain; the particle mean-square displacement instead reaches a plateau at long times. With increasing volume fraction, particles require a longer time to reach the long-time plateau, suggesting that the long-time dynamics becomes slower as crowding increases. Caging effects were found to arise both from the cavity and from other particles, and, at moderate to high concentration, anomalous diffusion was observed, with superdiffusive and subdiffusive behaviours along the radial and perpendicular directions respectively. The average excess kurtosis along the radial direction revealed that large displacements are favoured in this direction as particles undergo cage hopping. In contrast, the average perpendicular excess kurtosis suggests small changes in the statistics of displacements along the perpendicular direction. The average excess kurtosis in both the radial and perpendicular directions was found to reach a long-time plateau as particles sampled the domain extent. Overall, the cage-hopping dynamics is primarily radial; perpendicular motion is less important for cage hopping events.
These confinement-induced effects answer some open questions and also pose interesting new ones relevant to confined biophysical transport. We have shown here that hydrodynamic coupling to the spherical boundary strongly hinders particle motion as the particle-to-cavity relative size increases in concentrated suspensions. Our finding explains the observation of a ‘finite-size effect’, observed in the experimental measurements of Hunter, Edmond & Weeks (Reference Hunter, Edmond and Weeks2014), wherein particle motion in a bidisperse concentrated suspension confined inside a high-surface-tension droplet was strongly hindered with decreasing particle-to-cavity relative size. This led the authors to hypothesize that motion was perhaps slowed by the more pronounced curvature of smaller droplets. Results presented here suggest that the motion of large particles is slowed primarily by stronger hydrodynamic coupling with the cavity wall. We also show that in concentrated suspensions of freely diffusing hydrodynamically interacting hard spheres, the presence of 3D confinement leads to a mean-square displacement with an anomalous temporal growth. In addition, this long-time anomalous transport is anisotropic. This makes it clear that experimental measurements reporting anomalous transport in microconfined biophysical systems (Marshall et al. Reference Marshall, Straight, Marko, Swedlow, Dernburg, Belmont, Murray, Agard and Sedat1997; Weiss et al. Reference Weiss, Elsner, Kartberg and Nilsson2004) require careful consideration of the particle-to-cavity relative size to address the role of the boundary. Now that we have shown that the role of particle-to-cavity size ratio is important, and quantified its effects, it opens new questions; for example, the particle-to-cavity relative size of some intracellular particles (Weber & Brangwynne Reference Weber and Brangwynne2015) changes during cellular processes such as cell division, which will qualitatively change particle transport due to confinement effects. How such changes in transport properties affect cellular processes remains an open question, but the idea that such sizes are tied to cell changes is an emergent area of study. Although many particle-tracking experiments have been conducted inside cells (Suh, Wirtz & Hanes Reference Suh, Wirtz and Hanes2003; Daniels et al. Reference Daniels, Masi and Wirtz2006; Jaensch et al. Reference Jaensch, Decker, Hyman and Myers2010; Tabei et al. Reference Tabei, Burov, Kim, Kuznetsov, Huynh, Jureller, Philipson, Dinner and Scherer2013) the particle-to-cavity relative size of the tracked particle is seldom reported nor is the mean-square displacement projected through the most physically relevant orthogonal basis, which may mask important anisotropic behaviours that can explain difficulties in transport of, e.g., DNA therapy vectors. Future modelling work in this area must also incorporate more detailed architecture, such as size polydispersity, spheroids and slender bodies, to model organelles and the cytoskeleton, deformable and slippery surface conditions, and active motion. Going forward, it is clear that any such modelling must account for many-body hydrodynamic and lubrication interactions and a confining boundary.
Acknowledgement
This work was supported in part by the National Science Foundation Graduate Research Fellowship grant no. DGE-0707428.
Supplementary material
Supplementary material including a movie is available at https://doi.org/10.1017/jfm.2017.801.
Appendix A. Size-ratio dependence of long-time particle dynamics
Here, we extend the data presented in § 3.5, figure 12 to illustrate the effects of increasing particle-to-cavity relative size on the average radial and perpendicular mean-square displacement.
The average radial and perpendicular mean-square displacements are plotted as a function of particle radial position in figure 14(a,b) respectively for particles with a size
 $1/5$
of that of the cavity. Several curves represent different volume fractions, and are qualitatively similar to those of figure 12. For the radial mean-square displacement, the particle motion is diffusive at short times, leading to an average radial mean-square displacement that grows linearly in time. In contrast, at times long enough for particles to sample the domain extent, the average radial mean-square displacement reaches a plateau. In figure 14(a), superdiffusive motion is observed for
 $0.15\leqslant \unicode[STIX]{x1D719}\leqslant 0.4$
, showing that a smaller confining cavity causes superdiffusion at smaller volume fractions.
The average perpendicular mean-square displacement is plotted as a function of particle radial position in figure 14(b) for particles with a size
 $1/5$
of that of the cavity. As before, several curves represent different volume fractions. The average perpendicular mean-square displacement for these larger particles is qualitatively similar to that of figure 12(b); at short times, motion is diffusive, then the average perpendicular mean-square displacement reaches a plateau at times long enough for particles to sample the domain extent. Between the short- and long-time regimes, the average perpendicular mean-square displacement becomes subdiffusive as the concentration increases – in contrast to the superdiffusive motion along the radial direction.
The (a) radial and (b) perpendicular spatially averaged mean-square displacements as a function of lag time for suspensions with a particle-to-cavity relative size of
 $1/5$
. Different curves correspond to different volume fractions.

Overall, larger particles show similar qualitative behaviour to the smaller particles discussed in § 3.5, where the long-time dynamics of particles that are
 $1.5/10$
of the cavity size was discussed, in both the radial and perpendicular directions. As expected, cavity-induced effects are more pronounced for larger particles.
Appendix B. Isotropic approximation at long times
In experiments, the long-time self-diffusivity is often reported as an isotropic tensor, due to the practice of determining mean-square motion by averaging the square of the magnitude of particle displacements; however, this masks the anisotropy induced by confinement. To highlight the qualitative and quantitative impact of that approximation, we define here an average isotropic mean-square displacement in terms of the average radial and perpendicular mean-square displacements,
 $$\begin{eqnarray}\overline{\langle r^{2}\rangle }=\overline{\langle r_{\Vert }^{2}\rangle }+2\overline{\langle r_{\bot }^{2}\rangle }.\end{eqnarray}$$
That is, we smear out the details of anisotropy capture by orthogonal projection.
This isotropic average mean-square displacement is plotted as a function of position in figure 15(a,b) for particles with sizes
 $1/5$
and
 $1.5/10$
of that of the cavity respectively. As before, different curves represent different volume fractions. As with the anisotropic mean-square displacements, the isotropic mean-square displacement grows diffusively at short times; a long-time plateau is reached for times long enough for particles to sample the domain extent. Between the short- and long-time limits, an intermediate subdiffusive region emerges as the volume fraction increases. The subdiffusive behaviour in this isotropic measurement is a consequence of the higher contribution of the perpendicular component relative to the radial component. The superdiffusive behaviour is lost entirely. Because motion is less hindered in the perpendicular direction, the magnitude of the mean-square motion is larger and thus contributes more to the isotropic mean-square displacement. This highlights the importance of capturing the anisotropy in confined suspensions; without it, key behaviour, superdiffusion, is lost entirely.
The isotropic mean-square displacement
 $\langle r^{2}\rangle$
versus the lag time. Panels (a) and (b) correspond to suspensions with particle-to-cavity relative sizes of
 $1/5$
and
 $1.5/10$
respectively, for several volume fractions.

Appendix C. Size-ratio dependence of cage-hopping dynamics
Here, we discuss the effects of increasing particle-to-cavity relative size on the average excess kurtosis. We utilize the same quantities as defined in § 3.6 to determine the dynamics of cage hopping for large particles. This extends the discussion of the cage-hopping dynamics at long times in § 3.6 that were plotted in figure 13.
The average radial and perpendicular excess kurtosis are plotted as a function of lag time for suspensions with particles
 $1/5$
of the size of the cavity in figure 16(a,b) respectively. Several curves are plotted, corresponding to different volume fractions. For the larger particles, the average radial excess kurtosis is vanishingly small at short times, revealing that particle motion is primarily diffusive. For volume fractions
 $0.05\leqslant \unicode[STIX]{x1D719}\leqslant 0.30$
, the average radial excess kurtosis becomes positive at intermediate times, indicating that large displacements are favoured at intermediate times. The kurtosis reaches a maximum and then reverses to become negative before it reaches a long-time plateau as particles sample the domain extent. In contrast, for volume fractions
 $0.35\leqslant \unicode[STIX]{x1D719}\leqslant 0.40$
, the average radial excess kurtosis is weakly negative before obtaining positive values, suggesting that the combined effects of confinement and crowding are severe enough to restrict large displacements before particles undergo cage hopping. Another interesting feature of the average radial excess kurtosis of these concentrated suspensions is that its magnitude seems to saturate for
 $\unicode[STIX]{x1D719}=0.35$
and
 $\unicode[STIX]{x1D719}=0.45$
, suggesting that as the volume fraction increases, the tendency of particles to sample large displacements reaches a maximum. With increasing lag time, the average radial excess kurtosis increases to a maximum before starting to decreases toward its long-time plateau.
The average radial excess kurtosis plotted as a function of lag time for suspensions with a particle-to-cavity relative size of
 $1/5$
, for several volume fractions.

The average perpendicular excess kurtosis is plotted as a function of lag time for suspensions with particles
 $1/5$
of the size of the cavity in figure 16(b). For the largest particles, the average perpendicular excess kurtosis is vanishingly small at short times, indicating that motion is primarily diffusive. As the lag time increases, the average perpendicular excess kurtosis decreases to negative values and eventually reaches its long-time plateau. However, weakly positive values are observed for volume fractions
 $0.3\leqslant \unicode[STIX]{x1D719}\leqslant 0.40$
, indicating that large displacement are only weakly favoured at these time scales. As discussed in § 3.6, the positive values for the average radial excess kurtosis indicate that cage-hopping events occur primarily along that direction.
Overall, the average excess kurtosis for larger particles exhibits similar qualitative behaviour to that of the smaller particles discussed in § 3.6 in both the radial and perpendicular directions. The only difference occurs for the largest particles, where the average radial excess kurtosis for suspensions with volume fractions of
 $\unicode[STIX]{x1D719}=0.35$
and
 $\unicode[STIX]{x1D719}=0.40$
is weakly negative at intermediate times before becoming positive. This shows that the combined effects of crowding and confinement can be severe enough to restrict large displacements before particles undergo cage hopping.
Appendix D. Relative error in perpendicular diffusion arising from common approximations
An isotropic diffusivity was computed in § 3.4 (equation (3.12)), smearing out all spatial dependence of particle dynamics. The loss of information associated with that calculation was illustrated for the radial spatially dependent diffusion tensor in that section. Here, we give the corresponding calculation for the error associated with using that approximation in place of the perpendicular diffusivity. The relative error for diffusion perpendicular to the cavity radius is then given by
 $$\begin{eqnarray}E_{\bot }(\,y/R,\unicode[STIX]{x1D706}_{c},\unicode[STIX]{x1D719})=100\frac{|D_{0}^{\bot }(\,y/R,\unicode[STIX]{x1D706}_{c},\unicode[STIX]{x1D719})-D_{MSD}(\unicode[STIX]{x1D706}_{c},\unicode[STIX]{x1D719})|}{D_{0}^{\bot }(\,y/R,\unicode[STIX]{x1D706}_{c},\unicode[STIX]{x1D719})}.\end{eqnarray}$$
This error is plotted in figure 17(a–c) for particle-to-cavity relative sizes of
 $1/5$
,
 $1.5/10$
and
 $1/10$
respectively; different curves correspond to different volume fractions. As was found for the radial direction, near the centre, the relative error may again be as high as
 $35\,\%$
, and, near the dilute limit, the error decreases to a minimum and suddenly reverses to maximum as the wall is approached, revealing that the coarse approximation transitions from underpredicting to overpredicting perpendicular diffusion. Close to particle-to-cavity contact (far right of the plot), the relative error diverges because the coarse approach cannot account for vanishing mobility at the wall, and thus would vastly overpredict the speed of particle motion there. As the volume fraction increases, the relative error oscillates but does not undergo additional reversals, reflecting the fact that the effect of structural heterogeneity on perpendicular diffusion is weaker than its effect on radial diffusion. With decreasing particle-to-cavity relative size, the relative error decreases; however, the error is still quite significant near the centre for the smallest particles.
Overall, the assumptions of isotropy and position independence lead to significant error in the predicted perpendicular diffusion even for relatively small particles at dilute concentrations. As with the relative error obtained for radial diffusion, the error only increases with increasing particle size.
The relative error of the short-time self-diffusivity in the perpendicular direction approximated by the early-time behaviour of the mean-square displacement. Panels (a–c) correspond to the relative error in the perpendicular direction for suspensions with particle-to-cavity relative sizes of
 $1/5$
,
 $1.5/10$
and
 $1/10$
respectively.

Appendix E. Statistical sampling and standard error
Here, we discuss the statistical error associated with spatial averaging of particle positions and displacements and how this impacts the results presented for the radial distribution function, the short-time self-diffusion and the anisotropy of diffusion. Division of the cavity into spherical shells of fixed thickness (cf. § 2.2) permitted a discretized means by which to compute the probability of finding a particle at a given radial distance from the cavity centre. Fixed shell thickness gives a clear location of the inner radius of each shell, but also produces shells of progressively smaller volume as the centre of the cavity is approached. Statistical sampling is thus best in the large shells far from the centre, and noisiest near the centre.
The radial component of the short-time self-diffusivity in confined suspensions as a function of the normalized distance from the centre,
 $y/R$
, for particle-to-cavity size ratios of (a)
 $\unicode[STIX]{x1D706}_{c}=0.2$
, (b)
 $\unicode[STIX]{x1D706}_{c}=0.15$
, (c)
 $\unicode[STIX]{x1D706}_{c}=0.1$
and (d)
 $\unicode[STIX]{x1D706}_{c}=0.05$
. The number of particles per simulation varies with the volume fraction, as shown in the plots. The error bars are larger for particles near the centre of the cavity, due to lower sampling of radial bins near the cavity centre where the volume of each bin is small.

This behaviour is illustrated in figure 18, where the radial short-time self-diffusivity is plotted as a function of the radial position and the error bars correspond to the standard error of the reported value. The standard error is largest for radial positions near the cavity centre, where the bin volume is smallest. The error becomes progressively smaller moving radially outward as the bins grow in volume. The uncertainty of other position-dependent quantities follows a qualitatively similar trend, wherein error bars are smaller for positions close to the cavity wall than they are for positions close to the cavity centre. To mitigate the error near the centre, the number of simulations was increased until the average relative error obtained in a region from the cavity centre to half of the cavity radius was 5 %–18 %; relative errors near the wall are small due to better sampling in bins of higher volume.
Time-dependent quantities, such as the mean-square displacement and the excess kurtosis, are computed as a function of the simulation lag time. Simulation snapshots are taken by tracking particle positions over a time interval
 $\unicode[STIX]{x0394}t$
in a simulation with a total time
 $t_{f}$
, with samples obtained from all of the particles. The total number of snapshots is thus given by
 $N_{s}=t_{f}/\unicode[STIX]{x0394}t$
, which is directly proportional to the simulation time but inversely proportional to the time interval
 $\unicode[STIX]{x0394}t$
. Thus, in the calculation of all time-dependent quantities, a smaller time interval produces more snapshots for averaging. As a result, the uncertainty is smaller at short times, and increases as the value of the time interval increases. This behaviour is illustrated in figures 12 and 13, where the noise increases as the time interval of interest increases. For each volume fraction and particle-to-cavity size ratio, at least three simulations were carried out for a total of
 $200$
diffusive time steps, to observe the long-time plateau for all particle-to-cavity relative sizes. These simulations provided enough samples to obtain a relative standard error of less than
 $0.5\,\%$
for the mean-square displacement at short and intermediate times, as evidenced by the nearly indistinguishable noise in figure 12. Only for time intervals comparable to the total simulation time does the standard error of the mean-square displacement lead to noticeable statistical noise in figure 12. Noise becomes more observable in the excess kurtosis (figure 13), due to the small magnitude of the measurement itself, which results in a smaller ‘signal-to-noise’ ratio.
Appendix F. Effects of truncating at the force–torque level
The short-time self-diffusivity in the (a) radial and (b) perpendicular directions as a function of the normalized distance from the centre,
 $y/R$
. The solid symbols represent the short-time self-diffusivity from force–torque simulations, the hollow circles represent the short-time self-diffusivity from force–torque–stresslet simulations at matching volume fractions and the solid lines represent the short-time self-diffusivity in unbound suspensions at matching volume fractions. The particles are
 $1/5$
of the cavity size and several volume fractions are plotted, as shown in the legend.

In this section, we discuss the effect of truncating the far-field mobility matrix. Figure 19 presents a comparison of the short-time self-diffusion coefficients for the force/torque only calculation and for the force/torque/stresslet calculation. The radial and perpendicular short-time self-diffusivities for particles that are
 $1/5$
of the cavity size are plotted as a function of particle distance from the cavity centre in figure 19(a,b) respectively. The solid symbols correspond to the radial short-time self-diffusivity predicted by force–torque simulations, the hollow circles correspond to the short-time self-diffusivity obtained from force–torque–stresslet simulations and the solid lines correspond to the short-time diffusivity of particles in an unbound domain. Solid symbols, hollow circles and solid lines of equal colour correspond to simulations at matching volume fractions. As seen in the figure, the results are nearly indistinguishable, demonstrating that the weak contribution of the stresslet at equilibrium can be neglected.