Introduction
Retinal detachment (RD) is a serious ophthalmic disease characterized by acute vision loss. RD patients were associated with several clinical symptoms such as floaters and flashes (Lumi et al., Reference Lumi, Hawlina, Glavač, Facskó, Moe, Kaarniranta and Petrovski2015). According to a survey in the Netherlands, the incidence of the annual rhegmatogenous retinal detachment was 18.2 per 100,000 people (Van de Put et al., Reference Van de Put, Hooymans and Los2013). There are a various risk factors in the occurrence of RD including high myopia (Tsujikawa et al., Reference Tsujikawa, Kikuchi, Ishida, Nonaka, Yamashiro and Kurimoto2006), eye traumas (Sarrazin et al., Reference Sarrazin, Averbukh, Halpert, Hemo and Rumelt2004), diabetic retinopathy (Murakami et al., Reference Murakami, Uji, Ogino, Unoki, Horii, Yoshitake, Nishijima and Yoshimura2013), etc. At present, the surgery is an effective treatment for RD (Schatz & Andréasson, Reference Schatz and Andréasson2010). However, the RD patients were associated with many complications such as proliferative vitreoretinopathy (PVR) (Sarrafizadeh et al., Reference Sarrafizadeh, Hassan, Ruby, Williams, Garretson, Capone, Trese and Margherio2001), vitreous hemorrhage (Chen & Chen, Reference Chen and Chen2013), and even blindness (Manners et al., Reference Manners, Ng, Kemp-Casey, Chow, Kang and Preen2017).
The main pathological mechanism of RD is retinal neurosensory layer separation from the retinal pigment epithelium layer. The retinal neurosensory layer is composed of the photoreceptor cell. The dysfunction of the retinal neurosensory layer leads to the death of the photoreceptor cell and subsequent vision loss (Lo et al., Reference Lo, Woo, Wong and Wong2011). RD would lead to the dysfunction of electroretinography. Although many previous studies reported the recovery of retinal function after successful retinal reattachment surgery, the visual function recovery is less than before RD (Schatz & Andréasson, Reference Schatz and Andréasson2010; Terauchi et al., Reference Terauchi, Shinoda, Matsumoto, Watanabe, Matsumoto and Mizota2015). As we all know, the visual system includes retinal, visual pathway, and visual cortex. Thus, whether RD leads to the dysfunction of the visual system remains unknown.
Functional magnetic resonance imaging (fMRI) has been extensively applied to assess the neurophysiological lesions in many eye diseases. Previous studies corroborated that interhemispheric synchrony is closely related to visual experience (Foubert et al., Reference Foubert, Bennequin, Thomas, Droulez and Milleret2010; Mima et al., Reference Mima, Oluwatimilehin, Hiraoka and Hallett2001). Resting state-fMRI technology, the voxel-mirrored homotopic connectivity (VMHC) method, was used to quantify the functional connectivity (FC) between the time series for a given voxel and that of its mirrored counterpart in the opposite hemisphere (Zuo et al., Reference Zuo, Kelly, Di Martino, Mennes, Margulies, Bangaru, Grzadzinski, Evans, Zang, Castellanos and Milham2010) by reflecting specific patterns of interhemispheric disconnection. VMHC has been utilized to study physiological mechanisms of some diseases such as early blindness (Hou et al., Reference Hou, Liu, Zhou, Zhou and Li2017), strabismic amblyopia (Liang et al., Reference Liang, Xie, Yang, Yin, Wang, Yu, He and Wang2017), and postherpetic neuralgia (Jiang et al., Reference Jiang, Gu, Bao, Hong, He, Tan, Zeng, Gong, Zhang and Zhou2016). However, it still remains doubtful that whether there are alterations of interhemispheric functional synchronization in RD patients.
Here, our study intended to evaluate alternations of interhemispheric FC in RD patients using the VMHC method. We hypothesized that RD might be associated with the impaired interhemispheric FC in the visual area.
Materials and methods
Subjects
All subjects were provided an informed consent form before participation, which was approved by the principles of the First Affiliated Hospital of Nanchang University medical ethics.
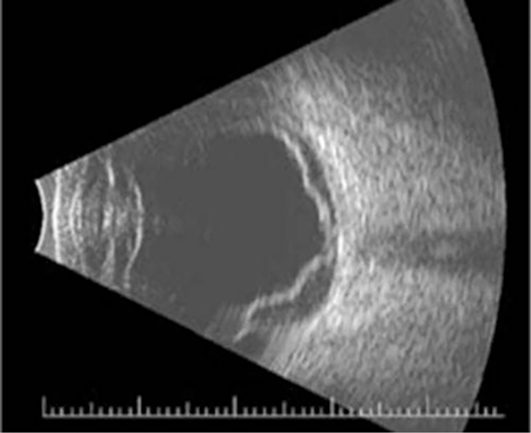
The study was conducted from October 2016 to November 2017. We recruited 30 patients with RD (16 males and 14 females) from the Ophthalmology Department of the First Affiliated Hospital of Nanchang University with the following inclusion criteria: (1) Ocular ultrasound shows unilateral idiopathic RD patients with one or two retinal tears (Fig. 1); (2) without any other eye diseases (glaucoma, optic neuritis, cataract, etc.).
Example of RD seen on ocular ultrasound.

The exclusion criteria of RD were as follows: (1) RD secondary to ocular trauma; (2) RD with serious related complications [PVR, vitreous hemorrhage, macular degeneration, etc.]; (3) RD patients with a history of smoking and alcohol; (4) with cardiovascular system diseases such as heart failure and atherosclerosis; and (5) with cerebral infarction and mental illness.
Thirty healthy controls (HCs) (16 males and 14 females) who were precisely matched to subjects in the RD group in age, sex, and status were also enrolled for this study. All HCs met the following criteria: (1) with normal visual acuity (VA) >1.0; (2) no mental illness (depression, bipolar disorder); and (3) ability to go through an MRI scan (e.g., no cardiac pacemaker or implanted metal devices).
MRI parameters
MRI scanning was performed on a 3-T MRI scanner (Siemens, Erlangen, Germany). High-resolution T1-weighted images were acquired with a three-dimensional spoiled gradient-recalled sequence in an axial orientation: 176 images (repetition time = 1900 ms, echo time = 2.26 ms, thickness = 1.0 mm, gap = 0.5 mm, acquisition matrix = 256 × 256, field of view = 250 mm × 250 mm, flip angle = 9°) were obtained. Finally, 240 functional images (repetition time = 2000 ms, echo time = 30 ms, thickness = 4.0 mm, gap = 1.2 mm, acquisition matrix = 64 × 64, flip angle = 90°, field of view = 220 mm × 220 mm, 29 axial slices with gradient-recalled echo-planar imaging pulse sequence), covering the entire brain, were obtained.
MRI data acquisition
A 3.0 T MRI system with eight-channel head coil (Siemens, Munich, Germany) was applied for imaging. According to a previous study, the T1-weighted and function images of the whole brain were obtained by spoiled gradient-recalled echo sequences with the previous parameters (Jiang et al., Reference Jiang, Gu, Bao, Hong, He, Tan, Zeng, Gong, Zhang and Zhou2016).
fMRI data preconditioning
The functional data were analyzed with the Data Processing Assistant for Resting-State fMRI Advanced Edition (DPARSFA; http://rfmri.org/DPARSFA) (Yan & Zang, Reference Yan and Zang2010) and Statistical Parametric Mapping (SPM8) (http://www.fil.ion.ucl.ac.uk/spm) based on MATLAB2010a (Mathworks, Natick, MA). To ensure the signal equilibrium and the participants’ adaption to the scanning noise, the first ten volumes of each subject were discarded. The remaining 230 volumes were proofread and corrected for delay in acquisition time between different slices as well as geometrical displacements in accordance with the estimated head movement in which each subject had a maximum translocation of less than 1.5 mm in any cardinal direction (x, y, z) and a maximum rotation (x, y, z) of less than 1.5°. A multiple regression method was applied for artifact elimination. The effect of low-frequency drift and high-frequency noise was reduced using a temporal filter (0.01–0.08 Hz). Subsequently, every image was recorded in a study-specific symmetric MNI template to calculate the VMHC (Guo, Reference Guo, Liu, Xue, Gao, Liu, Xiao, Chen and Zhao2013).
VMHC statistical analysis
To improve the normality, the individual VMHC maps were converted to z values using a Fisher z-transformation with REST software (http://resting-fmri.sourceforge.net). The individual z-maps were entered into a random effect two-sample t-test with the global VMHC as the covariate in a voxel-wise manner to identify the difference in VMHC between two groups (P < 0.01, cluster ≥40 voxels, AlphaSim corrected).
Statistical analysis
As for clinical data, the behavioral performances were analyzed by SPSS version 16.0 (SPSS Inc., Chicago, IL) using independent sample T test. (P < 0.05 significant differences).
The difference in the z-maps VMHC between the RD groups and the health controls was examined with two-sample t-tests using the SPM8 toolkit (P < 0.01 for multiple comparisons using Gaussian Random Field (GRF) theory) (P < 0.01, cluster ≥40 voxels, AlphaSim corrected).
The receiver operating characteristic (ROC) curve method was applied to analyze the mean VMHC values in the different brain regions between two groups. The correlations of the mean VMHC values among different brain regions in the RD group and behavioral performances were evaluated using Pearson correlation. (P < 0.05 significant differences).
Results
Demographics and visual measurements
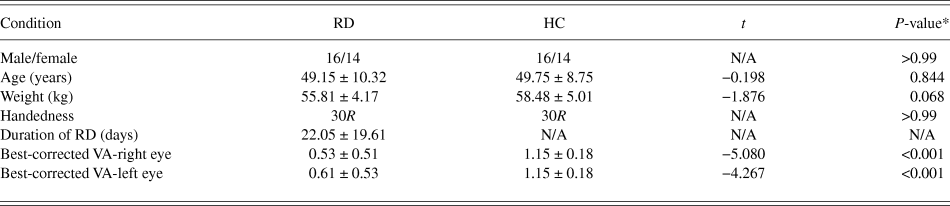
No marked differences can be seen in weight (P = 0.068), age (P = 0.149), best-corrected VA-Right (P = 0.259), and best-corrected VA-Left (P = 0.192) between the two groups (Table 1).
Demographics and clinical measurements by group

Notes: *P < 0.05 independent t-tests comparing two groups.
Abbreviations: RD, retinal detachment; HC, healthy control; N/A, not applicable; VA, visual acuity.
VMHC differences and correlation analysis
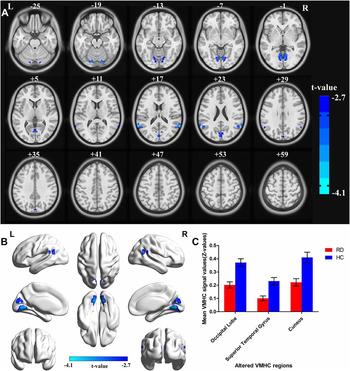
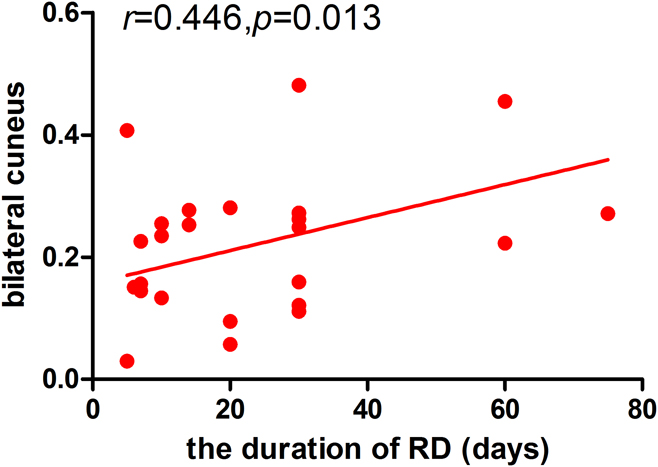
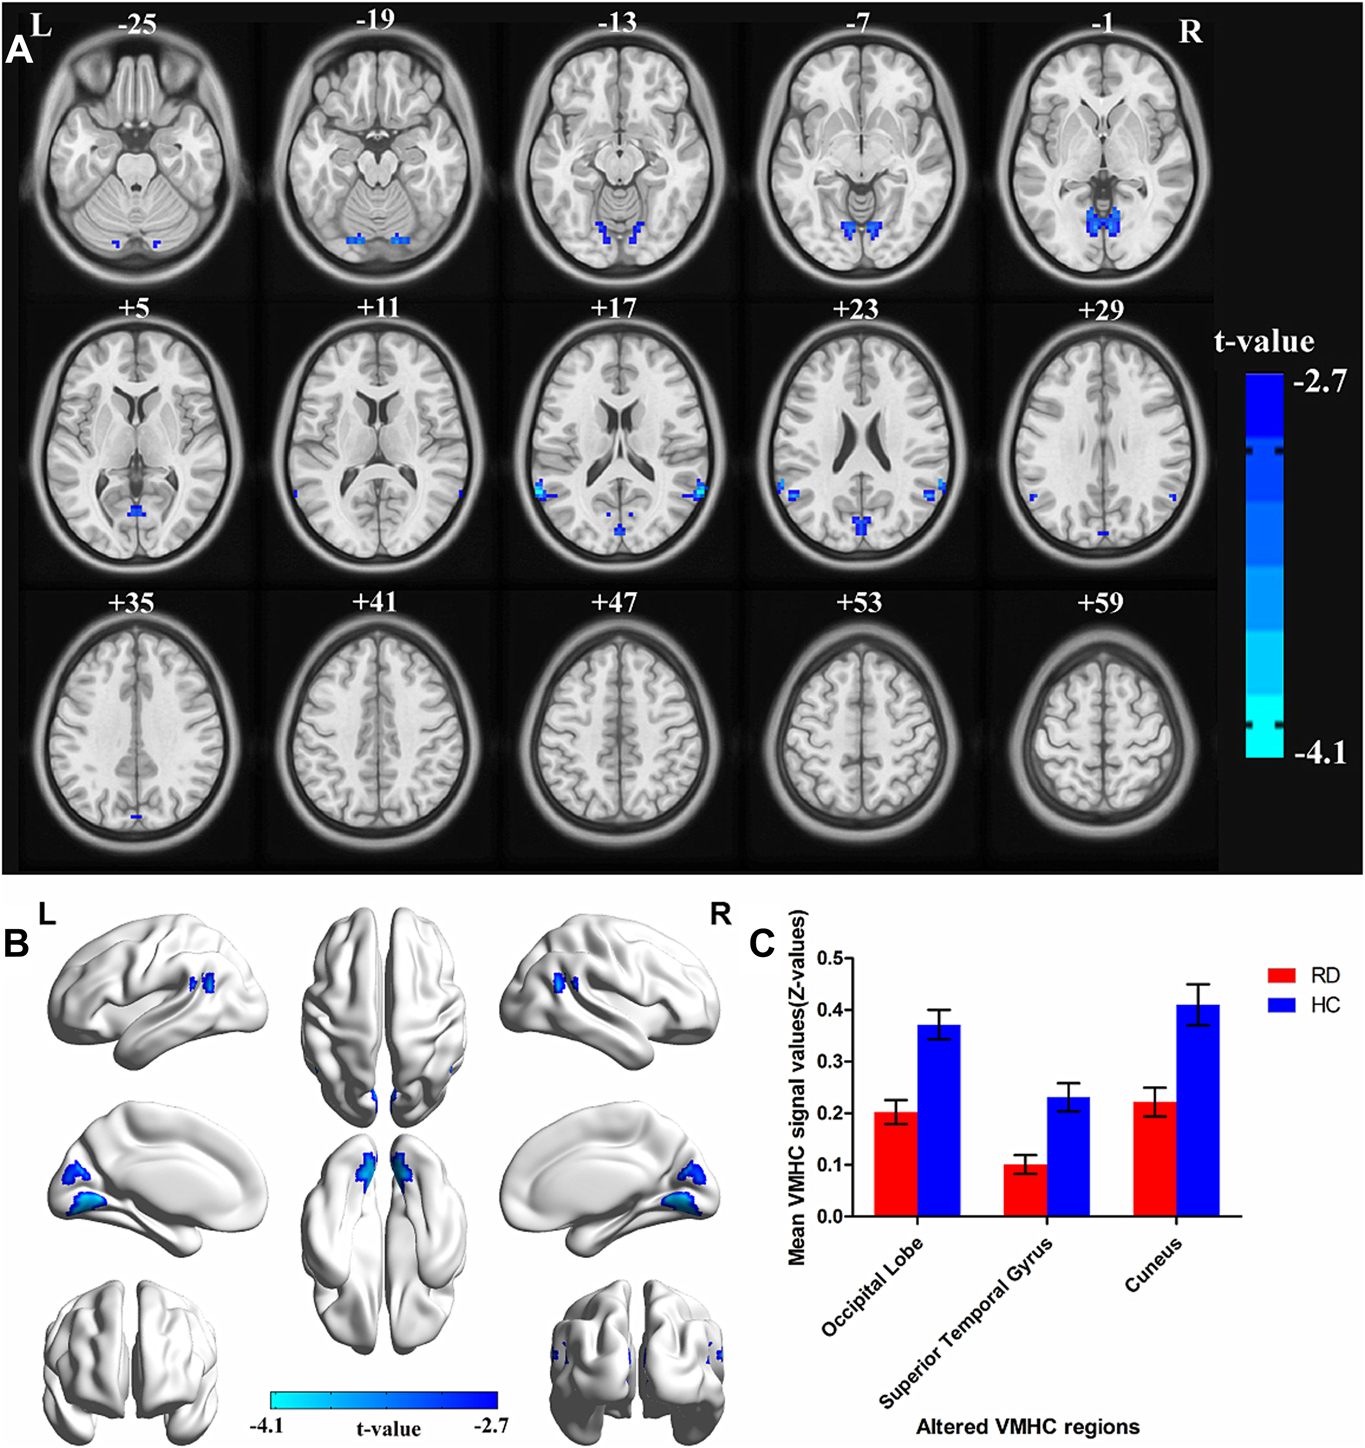
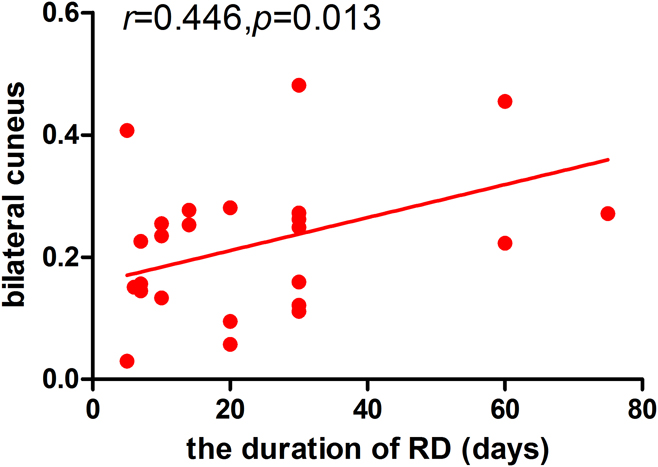
When comparing with HCs, RDs had prominently lower VMHC values in the bilateral occipital lobe (Brodmann areas, BA 18), bilateral superior temporal gyrus (BA 39), and bilateral cuneus (BA 19) (Fig. 2A and 2B [blue] and Table 2). The mean VMHC signal values between the two groups are represented by a histogram (Fig. 2C) (P < 0.01, cluster ≥40 voxels, AlphaSim corrected). In the RD group, the average VMHC signal values of the bilateral cuneus were in positive correlation with the duration of the RD (r = 0.446, P = 0.013) (Fig. 3).
Group comparison of interhemispheric functional connectivity between RD patients and HCs. Significant FC differences were observed in the bilateral occipital lobe (Brodmann areas, BA 18), bilateral superior temporal gyrus (BA 39), and bilateral cuneus (BA 19). The blue areas indicate lower VMHC values. (P < 0.01 for multiple comparisons using GRF theory) (z > 2.3, P < 0.01, cluster ≥ 40 voxels, AlphaSim corrected) (A) and (B). The mean values of altered VMHC values are shown with a histogram between two groups (C). Abbreviations: VMHC, voxel-mirrored homotopic connectivity; BA, Brodmann area; RD, retinal detachment; HCs, healthy controls.
Brain areas with significantly different VMHC values between two groups

Notes: The statistical threshold was set at the voxel level with P < 0.05 for multiple comparisons using GRF theory (z > 2.3, P < 0.01, cluster ≥40 voxels, AlphaSim corrected).
Abbreviations: VMHC, voxel-mirrored homotopic connectivity; BA, Brodmann area; RD, retinal detachment; HCs, healthy controls; MNI, Montreal Neurological Institute; B, bilateral.
Correlations between the mean VMHC signal values and behavioral performance. Note: In the RD group, the mean VMHC signal of the bilateral cuneus showed positive correlation with the duration of the RD (r = 0.446, P = 0.013). Abbreviations: VMHC, voxel-mirrored homotopic connectivity; RD, retinal detachment.
ROC curve
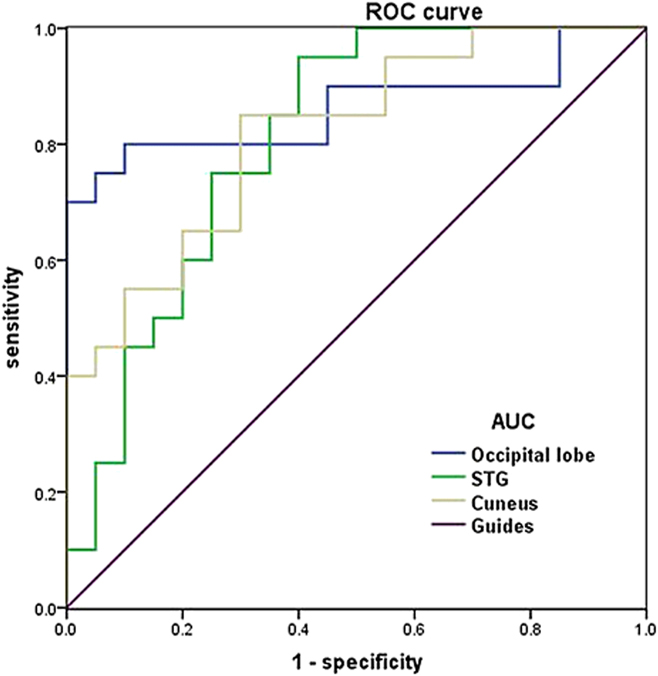
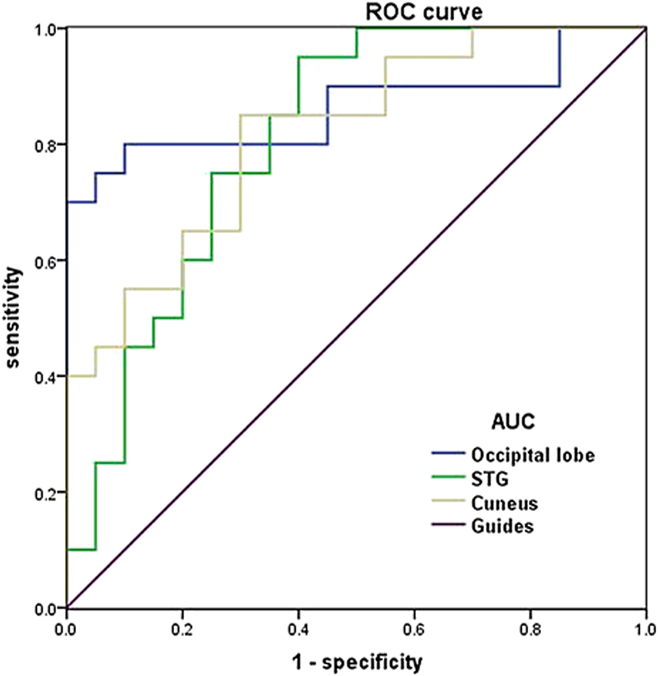
The ROC curve method was applied to analyze the mean VMHC values in three different brain regions within two groups. The areas under the ROC curve (AUCs) for VMHC values were listed as follows: bilateral occipital lobe (0.863), bilateral superior temporal gyrus (0.808), and bilateral cuneus (0.817) (RDs < HCs) (Fig. 4).
ROC curve analysis of the mean VMHC values for altered brain regions. Notes: The areas under the ROC curve were 0.863 (P < 0.001; 95% CI: 0.736–0.989) for the bilateral occipital lobe (Brodmann areas, BA 18), 0.863 (P = 0.001; 95% CI: 0.670–0.945) for bilateral superior temporal gyrus (BA 39), and 0.817 (P = 0.001; 95% CI: 0.689–0.946) for bilateral cuneus (BA 19). (RDs < HCs). Abbreviations: ROC, receiver operating characteristic; VMHC, voxel-mirrored homotopic connectivity; CI, confidence interval; RD, retinal detachment; HCs, healthy controls.
Discussion
The VMHC method is the reliable and noninvasive rs-fMRI to reveal the interhemispheric functional connectivity. This is the first study to evaluate the interhemispheric functional connectivity changes in RD patients. In our study, RD patients had significantly lower VMHC values than HCs in the bilateral occipital lobe (Brodmann areas, BA 18), bilateral superior temporal gyrus (BA 39), and bilateral cuneus (BA 19). Furthermore, the mean VMHC signal of the bilateral cuneus was in positive correlation with the duration of the RD (r = 0.446, P = 0.013).
Visual cortex, which mainly comprises visual areas V1, V2, V3, V4, and V5, is located in occipital lobe (Brodmann areas 18, BA 18) and is involved in the visual information processing. The bilateral hemispheres of the brain contain a visual cortex. The primary visual cortex receives the visual signal from lateral geniculate body through optic radiation (Chen & Zhu, Reference Chen and Zhu2001) and then, the V1 transforms the visual signal into other visual area through ventral stream and the dorsal stream visual pathways (Wang et al., Reference Wang, Zhou, Qiu, Du, Cai, Wang, Zhou, Meng, Zhuo, Fan and Chen1999). In this study, all RD patients were associated with the acute vision loss of right eye. The dysfunction of the retinal neurosensory layer leads to the death of the photoreceptor cell. In our study, we found that RD patients had significantly lower VMHC values in the bilateral occipital lobe, which indicates the functional connection obstacle between hemispheres in visual cortex.
The cuneus (BA19), a part of the occipital lobe, played an critical part in visual processing. The cuneus comprises the extrastriate cortex. The primary visual cortex accepts visual information from the bilateral lateral geniculate body (Atapour et al., Reference Atapour, Worthy, Lui, Yu and Rosa2017). According to the mechanism of natural vision, the V1 sparsely coding and decorrelating visual information (Vinje & Gallant, Reference Vinje and Gallant2000). In addition, the V1 is in close contact with visuospatial integration (Kapadia et al., Reference Kapadia, Westheimer and Gilbert2000). Moreover, the primary visual cortex contributes to visual awareness (Tong, Reference Tong2003). In our study, our results suggested that RD individuals showed significantly lower VMHC values in the bilateral cuneus (BA 19), which reflect the impaired functional connectivity between hemispheres in cuneus. Besides, the mean VMHC signal of the bilateral cuneus was in positive correlation with the duration of the RD (r = 0.446, P = 0.013). Thus, we deduced that unilateral RD might lead to dysfunction of interhemispheric functional connectivity of primary visual cortex. Moreover, the VMHC values in the bilateral cuneus might indicate the progress of RD.
Superior temporal gyrus (STG), containing the primary auditory cortex, played a critical role in processing sounds (Reale et al., Reference Reale, Calvert, Thesen, Jenison, Kawasaki, Oya, Howard and Brugge2007; Mesgarani et al., Reference Mesgarani, Cheung, Johnson and Chang2014). Besides, many transcranial magnetic stimulation studies revealed that STG was involved in visual search (Ellison et al., Reference Ellison, Schindler, Pattison and Milner2004; Gharabaghi et al., Reference Gharabaghi, Fruhmann Berger, Tatagiba and Karnath2006). According to the study, we found that RD patients had significantly lower VMHC values in the bilateral superior temporal gyrus, which reflect the impaired functional connectivity between hemispheres of superior temporal gyrus.
Conclusion
In summary, our result suggested that the acute RD individuals were associated with the impaired functional connectivity (FC) between hemispheres in the visual area, which might provide us with some evidence to understand the neural mechanism of unilateral acute RD individuals with sharp vision loss.
Limitations
There are several limitations. First, the amount of participants was relatively small. Second, the RD patients were in different progresses of vision loss, which might have bad influence on the results of this study. In addition, the accuracy of the resting-state fMRI signal was vulnerable to the effects of psychological state and physiological noise such as heart beats and breathing in all subjects. In future, the multimodal neuroimaging method can be applied to reveal the neural mechanism of unilateral acute RD individuals.
Conflict of interest statement
This was not an industry supported study. The authors report no conflicts of interest in this work.
Acknowledgments
The authors acknowledge support from National Natural Science Foundation of China (No. 81660158, 81460092, and 81400372); Jiangxi Province Voyage Project (No. 2014022); Natural Science Key Project of Jiangxi Province (No. 20161ACB21017); Youth Science Foundation of Jiangxi Province (No. 20151BAB215016); Technology and Science Foundation of Jiangxi Province (No. 20151BBG70223); and Health Development Planning Commission Science Foundation of Jiangxi Province (No. 20175116).