I. INTRODUCTION
Ag and Cu particles are of significant importance in catalytic, medical, and electronic applications.Reference Lewis1–Reference Sheppard4 In the electronics industry, Ag and Cu particles are used for the fabrication of thick film conductive pastes or as filler particles in isotropic conductive adhesives (ICA).Reference Kim, Stach and Handwerker5–Reference Liu, Li and Zeng9 The diameter of the conductive filler particles ranges from 1 to 10 µm.Reference Kang and Purushothaman10,Reference Wu, Wu, Ge, Zhang, Wang and Jiang11 Either in the thick film conductive pastes or in the ICA, metal particles contact each other forming the conductive network. Ag has an electrical resistivity of 15.87 nΩ m at 20 °C, slightly less than that of Cu (16.78 nΩ m at 20 °C).Reference Speight12 Ag is very expensive, and therefore, Cu is preferred. The problem with Cu is that it easily oxidizes causing it to no longer be conductive. AgCu bicomponent particles are of interest because they combine the conductivity and oxidation resistance of Ag with the cost benefits of Cu.
Ultrasonic spray pyrolysis has been used for the generation of single and bicomponent metal particles.Reference Gurav, Kodas, Pluym and Xiong13–Reference Ju, Jang, Kang and Kim21 Hydrogen, or a cosolvent, usually ethanol (ET) or ammonia is needed to generate oxide-free particles.Reference Kim, Babushok, Germer, Mulholland and Ehrman22–Reference Jian, Liu and Zachariah28 Compared with other particle generation methods such as chemical reduction,Reference Tsai and Dye29,Reference Hirai, Nakao and Toshima30 the polyol method,Reference Kurihara, Chow and Schoen31,Reference Fievet, Fievetvincent, Lagier, Dumont and Figlarz32 and vaporization techniques,Reference Cardenas-Trivino, Klabunde and Dale33,Reference Satoh and Kimura34 spray pyrolysis technology has the advantages of simple experimental setup, large scale production ability, and controllable particle size.Reference Jain, Skamser and Kodas35–Reference Nagashima, Iwaida, Sasaki, Katatae and Kato37
Recently, we generated bicomponent AgCu particles using the pyrolysis process with a cosolvent of ethylene glycol (EG).Reference Zhong, Peabody, Blankenhorna, Glicksman and Ehrman38 Particles composed of two solid solution phases with various patchy structures were detected, and the patchy structures were greatly affected by the operating conditions, such as the furnace temperature and the residence time. In a separate study of single-component Cu particle generation, we found that the cosolvent affected the reaction process, with EG promoting the formation of Cu at a lower temperature than ET.Reference Zhong, Peabody, Glicksman and Ehrman23
To make AgCu particles with controllable structures and morphologies, it is important to understand the particle formation process and how it is affected by the operating conditions and the reactants. In this work, we extend our spray pyrolysis studies of AgCu, with a systematic study of the reaction and phase separation mechanisms. Micron-sized AgCu particles were generated by the ultrasonic spray pyrolysis process with a cosolvent of either ethanol (ET) or ethylene glycol (EG). Phase separation behavior between copper and silver and the reaction mechanism of the particle formation process were investigated by short residence time experiments.
II. EXPERIMENT
A. Particle generation
A detailed description of the cosolvent spray pyrolysis reaction system used in these experiments was reported previously.Reference Zhong, Peabody, Glicksman and Ehrman23,Reference Zhong, Peabody, Blankenhorna, Glicksman and Ehrman38 In brief, the system is composed of a precursor solution reservoir, an ultrasonic droplet generator, tube furnaces, a quartz tube reactor, and a filtration system for particle collection. For the generation of Ag0.4Cu0.6 particles, a mixture of silver nitrate (AgNO3, purity of 99.5%, Strem, Newburyport, MA) and copper nitrate hexahydrate [Cu(NO3)2·6H2O, purity of 99.5%, Strem] was used as the precursor solution. AgNO3 (8.15 g) and Cu(NO3)2·6H2O (17.40 g) were first dissolved in 20 mL water, and then 40 mL cosolvent of either ethanol (ET) or ethylene glycol (EG) plus more water were added into the solution until the volume was 100 mL. The total concentration of Ag+ and Cu2+ was 1.2 M. An ultrasonic generator, operating at a frequency of 1.7 MHz, atomized the precursor solution to droplets with volume average diameters of around 5 μm. Two tube furnaces, with a total length of 81 cm, were combined in series. A quartz tube reactor with an inner diameter of 2.5 cm was placed in the center of the furnaces. A polytetrafluoroethylene filter was used to collect the particles. Industrial grade nitrogen (N2) with a minimum purity of 99.9% was used as the carrier gas. A carrier gas flow rate of 2.5 L/min leads to a residence time of ≈2 s with two furnaces used at 875 °C. A high flow rate of 10 L/min and a single furnace (40 cm) at temperatures ranging from 400 to 875 °C were used to decrease the residence time to less than 0.4 s for the investigation of the reaction process. Particles were quenched with an additional 10 L/min of the industrial grade nitrogen before collection.
B. Hydrogen concentration measurement
A Universal gas analyzer 300 (UGA) (Stanford Research Systems, Sunnyvale, CA) was used to measure the hydrogen concentration in the outlet gas. About 40 vol% ET or EG aqueous solution was sprayed into the tube furnace reactor, which was maintained at set points of 600, 700, 800, 895, and 1000 °C. The mass of the solution in the reservoir was recorded every 10 min, so that the atomization rates could be calculated. Two furnaces were used in series, and the carrier gas flow rate was held constant at 2.5 L/min for each test. After the furnace reaction, the outlet flow was diluted by 10 L/min quench gas and introduced into the UGA system via a capillary tube. An inline mass spectrometer was used for the analysis of the gas composition. The hydrogen concentration in the furnace was estimated as 5 times greater than the value measured by the UGA system because of the dilution of the quench gas.
To determine the theoretical hydrogen concentration possible, ChemCad (Chemstations INC, Houston, TX) was used for the calculation of the equilibrium hydrogen concentration in the furnace. The furnace was modeled as a Gibbs reactor, solving for the outlet gas composition such that the free energy of the system is minimized while mass is conserved. N2, H2O, and ET/EG were set as reactants, and the ratio of each component in the reactor inlet stream was calculated based on the actual measured atomization rate and 2.5 L/min carrier flow, which was assumed to be pure N2. The product gas stream included N2, H2O, ET/EG, H2, CO, and CO2. At different temperatures, outlet gas composition with the minimum system free energy was calculated. To simplify the calculation, metal nitrate species were not included in our calculation. The reported hydrogen concentrations are the concentrations before the quench after correcting for the dilution introduced by the quench.
C. Particle characterization
Scanning electron microscopy (SEM, Hitachi SU-70, Dallas, TX) combined with energy dispersive spectroscopy (EDS) mapping and backscattered electron (BSE) microscopy was used for the characterization of the particles. Particle phase composition was analyzed with an x-ray diffractometer (XRD, Bruker Smart 1000, Madison, WI) with the diffraction angle ranging from 10 to 90°. Detailed information about crystal structure and phase abundance was obtained from Rietveld refinement. The calculated phase abundances have a standard error of approximately 5%.
III. RESULTS AND DISCUSSION
A. Hydrogen concentration measurement
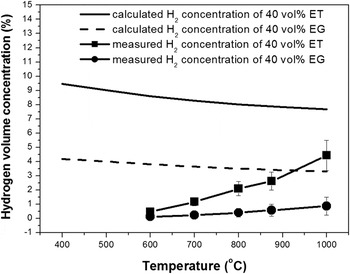
Hydrogen was generated from the decomposition of the cosolvents and played an important role in the transition reaction from metal oxide to pure metal. Its concentration was experimentally measured and theoretically calculated assuming equilibrium conversion. The results are shown in Fig. 1.
Calculated and measured hydrogen concentration in the outlet gas. 40 vol% EG or ET water solution was sprayed into the two furnaces. A carrier gas flow rate of 2.5 L/min was used. UGA 300 system was used to measure the hydrogen concentration in the outlet gas. Furnace temperatures were changed from 600 to 1000 °C.

When ET solution was used, the atomization rate is about 0.3 g/min. The equilibrium H2 concentration was calculated to be about 9 vol% and decreased to 8 vol% when furnace temperature was increased to 1000 °C. The concentration of CO was several orders smaller than H2, so it was considered to have a negligible contribution to the metal salt reduction reactions. When thermodynamic equilibrium is achieved, more than 99.9% of the ET decomposes. However, the measured H2 concentration was always lower than the calculated value and increased from 0.4 to 4.4% with increasing temperature from 600 to 1000 °C. This indicated that ET decomposition was limited by the kinetics of the decomposition reactions, and less than half of the ET decomposed in the furnace when two furnaces and 2.5 L/min carrier gas flow rate were used. The detailed decomposition mechanism of ET is quite complicated. Kim reported a simple model of ET decomposition, with ET finally decomposing to hydrogen, carbon monoxide, and carbon dioxide with acetaldehyde, ethylene, and ethane as intermediate species.Reference Kim, Babushok, Germer, Mulholland and Ehrman22
About 0.15 g of EG solution was atomized every minute, leading to a theoretical H2 concentration of approximately 4%. The calculated H2 concentration from the EG solution was lower than the concentration from ET solution mainly because the more viscous EG solution had a lower atomization rate. The measured H2 concentration resulting from the EG solution was between 0.1 and 0.8%, which is lower than the H2 concentration from ET at the same temperature and lower than the H2 concentration from ET on the basis of moles of H2 produced per mole of cosolvent atomized, 0.81 moles H2 per mole EG versus 2.2 moles H2 per mole ET. The measured H2 concentration from the EG solution is also lower than the explosive limits of hydrogen in the air,Reference Venetsanos, Adams and Azkarate39 indicating EG is the better cosolvent from an explosion-risk perspective. The decomposition mechanism of EG is not yet fully understood. As described in a prior report, we used short residence time experiments to observe Cu particle generation with EG. Unreacted liquid phase EG was observed in the product after 0.4 s reaction at 400 °C, indicating that the evaporation and decomposition of EG are very slow.Reference Zhong, Peabody, Glicksman and Ehrman23
B. AgCu particles generated by the spray pyrolysis process
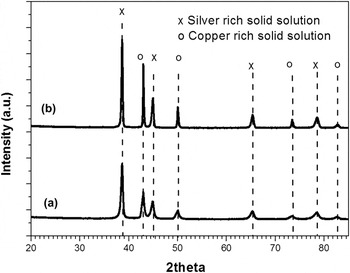
Oxide free AgCu particles were generated at 875 °C with 40 vol% ET, 2.5 L/min carrier gas flow rate, and two furnaces. The residence time, estimated based on the temperature measured along the furnace center line,Reference Kim, Babushok, Germer, Mulholland and Ehrman22 was about 1.7 s. According to the XRD results (Fig. 2), the particles are composed of two phases: one is a Ag-rich solid solution phase leading to diffraction peaks at 38.6, 44.9, and 65.3° and the other is a Cu-rich solid solution phase with diffraction peaks at 43.0, 50.0, and 73.7°. Compared to the diffraction peaks of pure Ag (38.1, 44.3, and 64.5°) and Cu (43.3, 50.4, and 74.1°) (ICDD PDF Nos. 01-071-3761 and 01-071–3762), there were slight shifts in the diffraction peaks of Ag solid solution and Cu solid solution. According to the refinement result, the particles were composed of 40 at.% Ag and 60 at.% Cu.
XRD of AgCu particles generated at 875 °C by the spray pyrolysis process with the cosolvent of (a) ET and (b) EG.

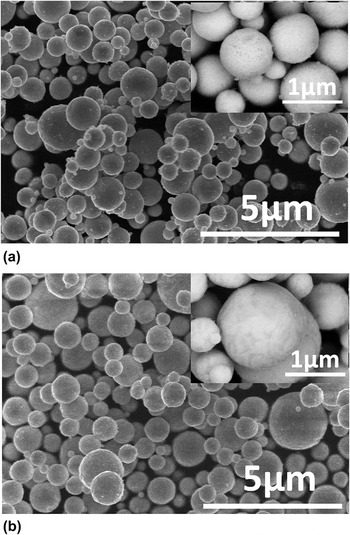
SEM images of particles are shown in Fig. 3(a). Particles were spherical with diameters ranging from 0.5 to 2 μm. The light and dark areas in the BSE images of the particles represent the two phases in the particles. The dark surface area was enriched in copper and the light area was enriched in silver because atoms with a higher atomic number are stronger scatterers than lighter atoms.
SEM images of AgCu particles generated at 875 °C by the spray pyrolysis process with the cosolvent of (a) ethanol and (b) ethylene glycol, inseted images were taken in backscattered mode.

Oxide-free particles also could be generated with the cosolvent of EG. SEM and BSE images of particles generated with the cosolvent of EG are shown in Fig. 3(b). Ag-rich solid solution and Cu-rich solid solution phases with a total composition of 40% Ag and 60% Cu were detected by XRD (Fig. 2).
C. Reaction process with the cosolvent of ET
To investigate the reaction mechanism during the formation of the particles, the short residence-time experimental method was used. Because there is not enough residence time for complete reaction, the intermediate products could be collected allowing for the analysis of the detailed reaction process. In these experiments, a higher carrier gas flow rate of 10 L/min was used with only one furnace. The residence time was less than a half second. For example, it takes 0.4 s to pass through one furnace at 400 °C with a 10 L/min carrier gas flow rate, whereas 3.3 s are needed if a 2.5 L/min flow rate and two furnaces are used. Short residence-time experiments were carried out at temperatures from 400 to 875 °C. Experimental temperatures and corresponding residence times are listed in the Supplemental Material. Particles were collected and characterized by XRD and SEM.
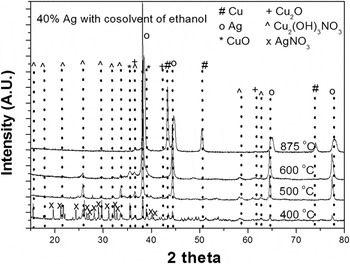
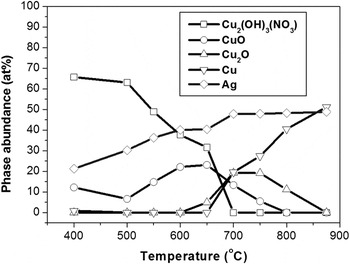
XRD results of particles generated with ET at 400, 500, 600, and 875 °C are shown in Fig. 4. At 400 °C, the particles are mainly composed of Cu2(OH)3NO3, CuO, AgNO3, and Ag. CuO has primary XRD peaks at 35.5 and 39°. The observed peaks at 35.5 and 39° indicate the existence of CuO, but the peak at 39° partly overlaps with the signals from Ag. Peaks at 36.5° could be attributed to Cu2O or Cu2(OH)3NO3, so the existence of Cu2O is unclear. Rietveld refinement gave a particle composition of 66 at.% Cu2(OH)3NO3, 12 at.% CuO, 1 at.% Cu, and 21 at.% Ag. When the temperature was increased to 500 °C and 600 °C, residence times decreased to 0.36 s and 0.32 s respectively. Stronger peaks of Ag at 38° and CuO at 35.5° were observed, and less signal from Cu2(OH)3NO3 was detected because of the higher reaction rate at 500 and 600 °C. Particles generated at 875 °C were mainly composed of Ag-rich and Cu-rich solid solution phases. Additional XRD refinement results are listed in Fig. 5 and in the Supplemental Material. Cu2(OH)3NO3 decomposed to CuO (circle), and full decomposition was at 650 °C. The maximum concentration of CuO occurred at 650 °C, further decomposing to Cu2O in the reducing atmosphere. Cu was observed at 650 °C and became more prevalent as temperature increased.
XRD of powders generated at 400, 500, 600, and 875 °C with a single furnace and 10 L/min carrier gas flow rate. Ethanol (ET) was used as the cosolvent.

XRD refinement results for powder generated at temperatures from 400 to 875 °C with a single furnace and 10 L/min carrier gas flow rate. Ethanol (ET) was used as the cosolvent.

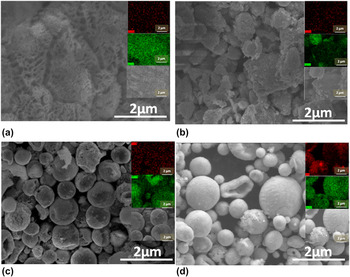
SEM images of particles generated in the short residence-time experiment are shown in Fig. 6. At 400 °C, no distinct individual particles were observed [Fig. 6(a)]. A mixture composed of Cu2(OH)3NO3 and Ag was observed with white patterns on the surface, which is probably indicative of the initial phase separation during the evaporation of the solvent. At 500 °C, an outline of distinct particles, mainly composed of Cu2(OH)3NO3 and Ag, started to appear [Fig. 6(b)], and distinct Ag-rich became observable according to the EDS mapping image, where the green dots represent Ag and the red dots represent Cu. At 500 °C, individual particles were detected with more obvious separation between Ag and compounds containing Cu. From the SEM images and EDS mapping [Fig. 6(c)], it was determined that each of the particles consists of two phases. One is the dark area enriched in Cu according to the EDS mapping, and the other is the light area mainly composed of Ag. The Ag looks like it is forming a half shell, covering the surface of the mixture of CuO and Cu2(OH)3NO3. Dark stripes in the primary particles were observed in the SEM images of the particles generated at 875 °C [Fig. 6(d)], indicating that AgCu particles contained two solid solution phases. Formation of the solid solution phases at 875 °C was probably due to the mutual solid state interdiffusion between Ag and Cu, which precipitated separately as shown in Fig. 6(c). It is also possible that the solid solution phases resulted from melting of Ag0.4Cu0.6 and mixing in liquid state, since Ag0.4Cu0.6 has a melting point of approximately 850 °C according to the phase diagram.Reference Okamoto40
SEM images and EDS mapping of particles generated at different temperatures with a single furnace and 10 L/min carrier gas flow rate. In the EDS mapping, the green dots represent Ag and the red dots represent Cu. Ethanol (ET) was used as the cosolvent (a) 400 °C, (b) 500 °C, (c) 600 °C, and (d) 875 °C.

According to the XRD and SEM analysis of short residence-time particles, a formation process for AgCu particles with the cosolvent of ET is proposed. When the precursor droplets are sent into the hot furnace, ethanol and water evaporates quickly. Precipitation behavior is determined by the solubility differences in water between 71.5 g AgNO3/100 g saturated solution and 56.0 g Cu(NO3)2·6H2O/100 g saturated solution at room temperature.Reference Speight12 In our case (8.15 g AgNO3 and 17.4 Cu(NO3)2·6H2O in 100 mL solution), Cu(NO3)2·6H2O will precipitate, followed by AgNO3. The precipitation in that order will lead to the separation as we described in Fig. 6(a). Cu(NO3)2 decomposes to Cu2(OH)3NO3, which then reacts to form CuO and Cu2O. At the same time, AgNO3 and Ag precipitate and agglomerate on the surface of the particles. As the particles are continually heated up to more than 600 °C, Cu2O is reduced to Cu in the reducing atmosphere created by ethanol decomposition. Mutual interdiffusion probably happens between Ag and Cu, and leading to Ag-rich and Cu-rich solid solution phases. If the furnace temperature is higher than the melting point of the alloy, as in the case of the particles produced at 875 °C, the particles could also melt, with spinodal decomposition occurring during the cooling process as the particle exit the high temperature furnace. Similar morphologies were observed in an earlier study of Ag0.6Cu0.4 particles at 1000 °C, well above the melting point of 779 °C for this composition.Reference Zhong, Peabody, Blankenhorna, Glicksman and Ehrman38
D. Reaction process with the cosolvent of ethylene glycol (EG)
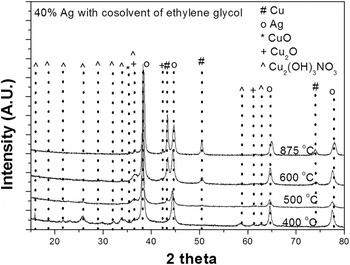
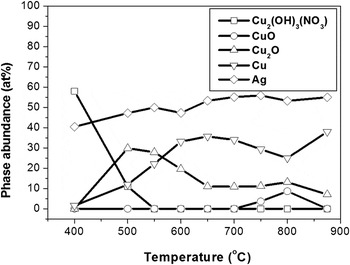
The same short residence-time experimental method was used to investigate the Ag0.4Cu0.6 formation process with ethylene glycol as the cosolvent. XRD results of particles generated at temperatures from 400 to 875 °C are shown in Fig. 7. At 400 °C, a wet sample was collected, and a significant portion of the unevaporated solvent was observed on the filter. A similar phenomenon was reported during the generation of pure Cu particles with EG.Reference Zhong, Peabody, Glicksman and Ehrman23 According to the spectrum (Fig. 8), samples collected at 400 °C consist mainly of Cu2(OH)3NO3 and Ag. At 500 °C, signals of Cu2(OH)3NO3 were nearly undetectable, indicating decomposition of Cu2(OH)3NO3. The signals of CuO were not detected either. Besides Cu2(OH)3NO3 and Ag, two other phases were detected: Cu2O with primary peaks at 36.5° and Cu with peaks at 43.4°. This indicated that when EG was used as the cosolvent, Cu2(OH)3NO3 experienced a quick decomposition reaction, leading to the formation of Cu2O and Cu at a relatively low temperature of 500 °C. Diffraction signals of Cu2O and Cu became more obvious at 600 °C. As temperature increased to 875 °C, Ag-rich and Cu-rich solid solution phases were detected with slightly shifted diffraction peaks compared with pure Ag and Cu.
XRD of powders generated at 400, 500, 600, and 875 °C with a single furnace and 10 L/min carrier gas flow rate. Ethylene glycol (EG) was used as the cosolvent.

XRD refinement results for powders generated at temperatures from 400 to 875 °C with a single furnace and 10 L/min carrier gas flow rate. Ethylene glycol (EG) was used as the cosolvent.

XRD refinement results are listed in Fig. 8 and in the Supplemental Material. At a low temperature of 400 °C, Cu2(OH)3NO3 and Ag precipitated as indicated by the squares and the diamonds in Fig. 9. As temperature increased, Cu2(OH)3NO3 decomposed to Cu2O (triangle) when we are using EG rather than CuO when using ET (circle). Full decomposition of the copper containing species occurred at 550 °C. Metallic Cu was observed at a temperature as low as 500 °C and became more prevalent as temperature increased.
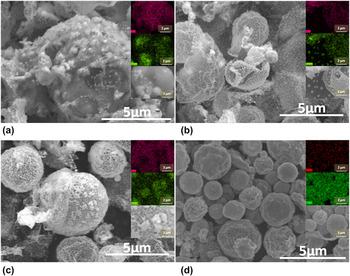
SEM images and EDS mapping of particles generated at different temperatures with a single furnace and 10 L/min carrier gas flow rate. In the EDS mapping, the green dots represent Ag, and the red dots represent Cu. Ethylene glycol (EG) was used as the cosolvent (a) 400 °C, (b) 500 °C, (c) 600 °C, and (d) 875 °C.

Differences in phase separation behavior also occurred when EG was used to replace ET. SEM images and EDS mapping of particles generated with EG are shown in Fig. 9. At 400 °C, Ag precipitated as individual spheres in the matrix of Cu2(OH)3NO3 [Fig. 9(a)]. At 500 °C, small distinct spheres of less than 100-nm diameter were observed in some layered structures [Fig. 9(b)]. EDS indicated that the layers contain Cu and Ag and the light dots contained mainly Ag. Also considering the XRD results earlier, we believe the layered structures are a mixture of Cu2(OH)3NO3, Cu2O, metallic Cu, and Ag, and the small dots in the layers are Ag. Increasing temperatures to 600 °C, porous particles could be observed with patterns on the surface [Fig. 9(c)]. EDS showed that the pattern structures on the surface were enriched with Ag, and the primary particles contained both Cu and Ag. The porous particles consisted of Cu2O, metallic Cu, and some metallic Ag. At 875 °C, two solid solution phases were formed, appearing well mixed. EDS cannot distinguish between two phases because of the limitation of the spatial resolution.
From the above result, a formation process of AgCu particles with the cosolvent of EG is proposed. The first step is the evaporation of the solvents. The low evaporation rate of EG, compared to ET, leads to the formation of nanosize Ag particles and layered structures, which were mainly composed of Cu2(OH)3NO3, Cu2O, and Cu. As the temperature increases, Cu2(OH)3NO3 decomposes to Cu2O which then is reduced to porous Cu particles. Ag particles are embedded in the matrix of Cu2O and/or Cu. Finally at high enough temperatures and long enough residence times, particles composed of Ag and Cu solid solution phases are generated.
When comparing the generation process using ET and EG, two significant differences were noticed. One is the morphology of precipitated Ag. The other difference is the reaction path between Cu(NO3)2 and Cu. When ET was used, Ag-rich domains were observed on the surface [Fig. 6(a)], while Ag precipitated as distinct nanoparticles with EG [Fig. 9(a)]. This could be explained by the difference in the evaporation rate of ET versus EG. ET has a higher vapor pressure (43 mmHg at 20 °C) than water (18 mmHg at 20 °C)Reference Speight12 and fully evaporates before complete decomposition of AgNO3 according to our XRD result (Fig. 4).
As for ET, precipitation behavior was determined by solubility differences in water. Cu(NO3)2·6H2O will precipitate first, followed by AgNO3, leading to the separation as we described in Figs. 9(a)–9(c). With EG having a vapor pressure of 0.06 mmHg at 20 °C, nearly 1000 times less than ET, it will take 1000 times longer for the evaporation of EG than ET if they are at the same temperature.Reference Pruppacher and Klett41,Reference Friedlander42 According to earlier studies,Reference Zhong, Peabody, Glicksman and Ehrman23 more than 0.4 s is required for the full evaporation of EG at 400 °C. During such a long evaporation process, EG and AgNO3 coexist and are heated. Ag+ is probably reduced to Ag0 by EG, similar to what occurs in the polyol methodReference Yang, Deivaraj, Too and Lee43 leading to the formation of nanoparticles of silver that were observed in Fig. 9.Reference Kurihara, Chow and Schoen31,Reference Fievet, Fievetvincent, Lagier, Dumont and Figlarz32,Reference Fievet, Lagier, Blin, Beaudoin and Figlarz44
The other difference between using ET and EG was the decomposition of Cu(NO3)2. With ET, Cu(NO3)2 first decomposed to CuO, followed by the formation of Cu2O and then decomposition to Cu. This process was reported previously by other groups.Reference Lvov and Novichikhin45,Reference Jackson, Fonseca and Holcombe46 However, when using EG as the cosolvent, a direct transition from Cu(NO3)2 to Cu2O was observed. There are two possible reasons for the CuO disappearing. One is that EG created a greater reducing atmosphere and a higher H2 concentration than ET. A large H2 concentration allows a quick reduction from CuO to Cu2O, so we cannot detect any CuO. However, H2 concentration measurement results showed that less H2 was actually generated from EG (0.1–0.8% H2 concentration) than from ET (0.4–4.4% H2 concentration). Another possible reason is that EG reacted with Cu(NO3)2, reducing Cu2+ to Cu2O, and EG was oxidized to an aldehyde or acid.
IV. SUMMARY AND CONCLUSION
Ag0.4Cu0.6 particles were generated by the spray pyrolysis process from Cu(NO3)2 and AgNO3 precursor solution with the cosolvent of either ET or EG. ET resulted in a H2 concentration between 0.4 and 4.4 vol%, and EG yielded a H2 concentration between 0.1 and 0.8 vol%. Decomposition of both ET and EG was limited by the reaction kinetics. Particles were oxide free and composed of Ag-rich and Cu-rich solid solution phases. Short residence-time experiments were used for the investigation of the details of the particle formation process. The products of the short residence-time experiments are not directly useful because they are porous or have other unfavorable properties. However, the results are important for designing processes to make multicomponent metal powders.
With a cosolvent of ET, Ag precipitated during the evaporation of the solvent, and phase separated on the surface of the particles. Cu(NO3)2 decomposed to Cu2(OH)3NO3, then to CuO and Cu2O. CuO and Cu2O were reduced to Cu in the reducing atmosphere resulting from ET, and finally Ag and Cu diffused into each other, leading to the formation of solid solution phase. With a cosolvent of EG, nanosized Ag particles were generated during the evaporation process. Layer structures of Cu2(OH)3NO3 and Cu2O with Ag particles embedded were observed during the formation of the particles. EG probably interacted with Cu2(OH)3NO3, resulting in the formation of Cu2O and Cu at a lower temperature than ET.
The results indicated that the phase separation between Ag and Cu strongly depends on the properties of the cosolvent. A cosolvent with high evaporation rate leads to the separation during the evaporation process, whereas a cosolvent like EG, which evaporates more slowly than ET, results in the reaction in the liquid phase, and the separation behavior is then determined by the thermodynamic properties of the component. Thus, control over AgCu particle structure can be achieved through choice of the cosolvent as well as process experimental conditions.
ACKNOWLEDGMENTS
This work was supported by the National Science Foundation (Grant No. CBET-0755703) and by the DuPont Company. We also acknowledge the support of the Maryland NanoCenter and its NispLab. The NispLab is supported in part by the National Science Foundation as a Materials Research Science and Engineering Center Shared Experimental Facility. E.B. acknowledges support from MTECH ASPIRE Program.