Implications
Combined diets consist of the alternation of total mixed rations (TMR) with pasture or herbage throughout the day. This feeding management could enhance productivity in pasture-based systems. In this study, heifers that were fed a combined diet had a similar nutrient consumption and nitrogen metabolism, but a different glucose metabolism relative to the TMR diet. Moreover, the combined diet improved microbial protein synthesis and N use efficiency relative to the herbage diet. The understanding of digestive and metabolic processes will help to improve productivity, profitability and sustainability of intensive cattle grazing production systems.
Introduction
Pasture-based diets have economic advantages and may reduce the nitrogen leaching losses compared with confinement systems (Soder and Rotz, Reference Soder and Rotz2001). It has also been reported that pasture grazing confers nutraceutical characteristics to the final products, that is, meat and milk (Lourenço et al., Reference Lourenço, Van Ranst, Vlaeminck, De Smet and Fievez2008). However, pasture-based diets have limitations related to the energy intake and productivity of the animals (Kolver and Muller, Reference Kolver and Muller1998) and to the excess of rumen-degradable protein that herbage provides. This excess N cannot be fully incorporated as microbial protein, and it is primarily excreted in the urine (Hristov et al., Reference Hristov, Hanigan, Cole, Todd and McAllister2011), with a consequent energy cost (Reynal and Broderick, Reference Reynal and Broderick2005) and a negative impact on the environment. Supplementation with non-fibrous carbohydrate (NFC)-rich concentrates could enhance N use efficiency in the rumen in these situations. However, several studies demonstrated that this feeding practice does not help to increase the microbial protein synthesis efficiency (MPSE) compared with exclusive pasture feeding (Garcia et al., Reference Garcia, Santini and Elizalde2000; Tebot et al., Reference Tebot, Cajarville, Repetto and Cirio2012; Aguerre et al., Reference Aguerre, Cajarville, Kozloski and Repetto2013) probably because the concentrate is presented separately from the forage, in one or two meals per day.
Conversely, the use of a TMR provides forage and concentrates simultaneously. These types of diets help to decrease selection and stabilize the nutrient supply and the nutrient ratio in the diet, resulting in high intake and high productivity per animal (Coppock et al., Reference Coppock, Bath and Harris1981).
Some authors have proposed the use of combined diets, providing TMR and herbage alternately throughout the day (Bargo et al., Reference Bargo, Muller, Delahoy and Cassidy2002; Loor et al., Reference Loor, Soriano, Lin, Herbein and Polan2003; Vibart et al., Reference Vibart, Fellner, Burns, Huntington and Green2008; Morales et al., Reference Morales, Soldado, González, Martínez, Domínguez, Delgado and Vicente2010). The use of combined diets imply that the final ration consumed by the animals is not balanced in a traditional form, as a balanced diet (TMR) is supplemented with access to herbage at certain times. Moreover, combined diets can involve heterogeneous feedstuffs, and the results depend on the quality of herbage or TMR used in each situation. Even considering the inherent variability of these feeding systems, the use of combined diets are increasingly used in temperate regions of the Southern Hemisphere, as a means of increasing productivity in pasture-based systems and also to overcome the seasonal variability in the production of pasture (Wales et al., Reference Wales, Marett, Greengood, Wright, Tornhill, Jacobs, Ho and Auldist2013).
It has been reported that animals fed combined diets can achieve a similar nutrient intake compared with animals fed TMR when high-quality herbages are used (Vibart et al., Reference Vibart, Fellner, Burns, Huntington and Green2008; Morales et al., Reference Morales, Soldado, González, Martínez, Domínguez, Delgado and Vicente2010). Moreover, there is an evidence that combined diets, although not balanced for N supply for the animal, may be effective in capturing the excess of degradable protein from pasture, thereby improving total microbial N flow (MNF) and MPSE. Vibart et al. (Reference Vibart, Burns and Fellner2010), working with in vitro fermenters, reported a greater substrate partition toward microbial cells, that led to an increase in MPSE, when transitioning from a substrate composed by only TMR to a substrate composed by a combination of TMR and herbage.
Most of the in vivo research about combined diets has used dairy cows in early and middle lactation. To our knowledge, there are no studies that address the use of combined diets for animals with nutritional requirements different from lactating dairy cows, such as growing beef cattle. It would be of interest to quantify the extent to which this feeding system affects the use of nutrients, N in particular, relative to a TMR or an all-herbage system. Considering that the rational combination of pastures and TMR could represent a useful tool for intensive beef pasture-based systems, the aim of this work was to determine the effects of alternating TMR with herbage throughout the day on nutrient intake, digestion, N use and ruminal fermentation in beef heifers.
Material and methods
Animals, diets and experimental design
The study was conducted at the Experimental Farm (San José Department, GPS coordinates: latitude S 34°40'652'', longitude W 56°32'349'') of the Veterinary Faculty of UdelaR, Uruguay. All procedures involving animals were approved by the Bioethics Committee of the Veterinary Faculty (Facultad de Veterinaria-UdelaR, Uruguay).
Nine 18-month old cross-bred heifers (Aberdeen Angus×Hereford) with an average BW of 214±18 kg were used. The animals were weaned at the age of 6 months and raised on native grassland. The heifers fitted with permanent rumen catheters were housed in individual metabolic cages and fed either a balanced TMR, legume-based herbage, or a combined diet composed by the TMR and the herbage provided at different times during the day. The experiment consisted of a replicated 3×3 Latin Square. Each experimental period lasted 18 days (10 adaptation days and 8 measurement days). Animals were assigned to one of three treatments: TMR for 24 h/day (T), TMR for 18 h plus legume-based herbage for 6 h/day (T+H) and legume-based herbage for 24 h/day (H).
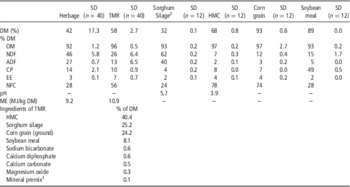
Herbage and TMR as the sole dietary ingredients were offered individually without restriction in amount beginning at 1000 h. In the T+H treatment, herbage was supplied between 1300 h and 1900 h. In order to ensure the permanent availability of feed, each feeder was observed periodically (approximately each 30 min), and if necessary, more feed was added. As part of our experimental design, the time when the animals had access to the TMR or to the herbage was a factor under control in this experiment. The legume-based herbage was composed (% dry matter (DM)) of Trifolium repens (63.0%), Trifolium pratense (18.6%), Lolium multiflorum (15.0%) and the remaining herbage in brown tissue (3.4%), with an average availability of 2170±380 kg DM/ha (Table 1). Herbage was cut daily at 0900 h at a cutting height of 8 cm using a mower (TT CBM 165; Adiyaman, Turkey), and was kept in the shade without chopping. The TMR was formulated for daily gains of 1 kg when offered without restriction, using the Cornell Net Carbohydrates and Protein System (CNCPS) software version 6.1 and was prepared daily. The chemical composition of the legume-based herbage, TMR, feeds used to formulate the TMR and the proportion of each component in the TMR are described in Table 1. The animals had access to fresh water ad libitum.
Chemical composition of legume-based herbage, total mixed ration (TMR) and the ingredients used to formulate the TMR, and proportion of each component of the TMR

HMC=high moisture corn; DM=dry matter; OM=organic matter; EE=ether extract; NFC=non-fiber carbohydrate, calculated as: %NFC=%MO−(%CP+%NDF+%EE); ME=metabolizable energy estimated using values from the Cornell Net Carbohydrate and Protein System v. 6.1.
1 Mineral–vitamin premix (Rovimix® Feedlot; Insalcor S.A., Ciudad del Plata, Uruguay): vitamin A, 50 IU; vitamin D, 1000 IU; vitamin E, 20 000 IU; Mg, 72 000 ppm; Mn, 30 000 ppm; Fe, 80 000 ppm; Zn, 50 000 ppm; Cu, 14 000 ppm; I, 20 000 ppm; total mineral, 95% to 97%; Ca, 10% to 13%; P, 8% to 10%; Ca : P, 1.28; Cu, 480 ppm; Zn, 1800 ppm; insoluble ash, 4.5%; Cd, 5 ppm; Cr, 2 ppm; As, 12 ppm; Pb, 30 ppm; Hg, 0.1 ppm.
2 whole-plant sorghum silage.
Sampling and measurements
Feed intake (TMR and herbage) was determined daily for 8 days (days 1 to 8 of measurements) by quantifying the amount of feed offered and refused. Orts were collected and weighed immediately before 1000 h for all treatments. For T+H treatment, herbage orts were collected at 1900 h. Samples of the offered feeds and orts from each heifer were collected daily, dried in a forced-air oven at 55°C during 48 h and ground to pass through a 1 mm screen (Fritsch GmbH; Idar-Oberstein, Birkenfeld, Germany) for further analysis of chemical composition. Digestibility was measured by weighing the fecal matter of each individual heifer from day 1 to day 5. Fecal samples were collected from each heifer (10% of the feces produced by an animal), dried in a forced-air oven at 55°C during 48 h, ground to pass through a 1 mm screen and pooled within heifer and period for analysis. Total daily urine output was collected and measured individually from day 1 to day 5 using urethral catheters and vessels containing 200 ml of 10% H2SO4. Samples of 1 ml/l of urine were taken and diluted with tap water to a final volume of 50 ml; these were stored at −20°C (Chen and Gomes, Reference Chen and Gomes1995) and pooled within animal and period (according to the proportions of daily urine production) before analysis. Ruminal fluid samples were taken every hour for 24 h during day 3 using the permanent rumen catheters according to Aguerre et al. (Reference Aguerre, Cajarville, Kozloski and Repetto2013). The pH was immediately measured using a digital pH meter (EW-05991-36; Cole Parmer, Vernon Hills, IL, USA), and 10 ml of rumen fluid was mixed with 5% NaCl (50 : 50, v/v) and frozen at −20°C for subsequent determination of N–NH3. For the determination of volatile fatty acid (VFA) concentration, 3 ml samples of ruminal contents corresponding to 0200, 0800, 1400 and 2000 h, were mixed with 0.1 M perchloric acid (50 : 50, v/v) and frozen at −20°C. On day 5, blood samples were collected by jugular venipuncture at 1000, 1200, 1400 and 1800 h for plasma concentration determination of glucose, urea, glucagon and serum concentration of insulin. Samples were taken in 10-ml tubes with 1 ml of potassium fluoride and ethylenediaminetetraacetic acid as an anticoagulant (Wiener Lab SACI, Rosario, Santa Fe, Argentina) for glucose and urea analysis, and in a glass tube with 70 ml of aprotinin (PL Rivero y Cia. SA, Buenos Aires, Argentina) for glucagon analysis. The plasma was immediately separated by centrifugation (750×g, for 10 or 15 min, respectively) and 3 ml were stored at −20°C for later analysis. Another blood sample was taken in a dry tube, left at room temperature for 6 h or more until clot retraction; the sample was then centrifuged (750×g, for 10 min), the supernatant was removed and a 3 ml sample was stored at −20°C for insulin analysis.
Chemical analysis and calculations
Feed and fecal samples were analyzed according to the Association of Official Analytical Chemists (AOAC) (1990) methodology DM (method 934.01), ash (method 942.05), ether extract (EE) (method 920.39) and P (method 984.13) contents. NDF and ADF were performed according to the methods of Robertson and Van Soest (Reference Robertson and Van Soest1981) with NDF and ADF assayed sequentially (ADF determination performed on the residue of NDF) in a fiber analyzer (Ankom220; ANKOM Technology Corp., Fairport, NY, USA) using sodium sulfite and a thermo-stable amylase without residual ash exclusion. The NFC were calculated as: % organic matter (OM)−(%CP+%NDF+%EE) according to the National Research Council (2001). The metabolizable energy (ME) content of the feed was estimated with the software CNCPS (Fox et al., Reference Fox, Tedeschi, Tylutki, Russell, Van Amburgh, Chase, Pell and Overton2004) using the chemical composition described in Table 1. The coefficient of apparent digestibility (CD) for each of the chemical fractions was calculated as: (g ingested−g excreted in feces)/g ingested. Each urine pool sample was analyzed for N (AOAC, 1990; method 984.13). The quantity (g) of N retained per day (RN) was calculated as: g ingested N−g eliminated N (from feces and urine combined). Urine pools were also analyzed for purine derivatives (PD; allantoin and uric acid) according to Balcells et al. (Reference Balcells, Guada and Peiró1992) with HPLC (Ultimate® 3000; Dionex; Sunnyvale, CA, USA), using an Acclaim C18, 5 µm, 4.6×250 mm column at 205 nm. The quantity of absorbed purines (mmol/day) was calculated from the equation described by Chen and Gomes (Reference Chen and Gomes1995):
 $${\rm Absorbed}\,{\rm purines \, {\equals}\, }\left( {{\rm PD}\,{\rm excreted}\,{\minus}\,{\rm 0}{\rm .385}{\times}{\rm BW}^{{{\rm 0}{\rm .75}}} } \right){\rm /0}{\rm .85}$$
The MNF was calculated as:
 $${\rm MNF}\,\,\left( {{\rm g/day}} \right)\,{\rm \, {\equals}\, }\,{\rm absorbed}\,{\rm purines}{\times}{\rm 70/}\left( {{\rm 0}{\rm .116{\times}0}{\rm .83{\times}1000}} \right)$$
assuming a purine N content of 70 mg N/mmol, a ratio of purines N/total N of 0.116 and a microbial purine digestibility of 0.83 (Chen and Gomes, Reference Chen and Gomes1995). The MPSE was calculated as: g MNF/kg of digestible organic matter intake (DOMI). The DOMI was calculated as the ingested OM (kg)×the CDOM. The use efficiency of ingested N for microbial protein synthesis (EUN) was estimated as MNF/g of ingested N. The N–NH3 concentration in rumen fluid samples was analyzed by direct distillation (Food and Agriculture Organization of the United Nations (FAO), 1986) in a distiller (1002 Kjeltec System; TECATOR, Buenos Aires, Argentina). The concentrations of acetic, propionic and butyric acids were analyzed according to Adams et al. (Reference Adams, Jones and Conway1984) using HPLC (Ultimate® 3000, Dionex) and an Acclaim Rezex Organic Acid H+ (8%) 7.8×300 mm column at 210 nm. Total VFA concentration (mmol/l) was calculated as the sum of acetic, propionic and butyric acid concentrations and was expressed as a proportion of the total VFA concentration. Glucose and urea plasma concentrations were determined by colorimetry using commercial kits (BioSystems SA; Santa Coloma de Gramanet, Barcelona, Spain) and a spectrophotometer (1200, UNICO®; United Products & Instruments Inc., Dayton, OH, USA). For glucose, the detection limit was 0.012 mmol/l and the intra-assay CV was 6.4%. For urea, the detection limit concentration was 0.21 mmol/l and the CV was 4.1%. Insulin concentrations were determined using an immunoradiometric assay with a commercial kit (Immuno Assays; DIAsource SA, Nivelles, Belgium); assay sensitivity was 1.47 pg/ml. The samples were analyzed in two separate assays (the intra- and inter-assay CV were 7.5% and 5.7%, respectively). Glucagon concentrations were determined in a single assay using an immunoradiometric assay (Siemens Healthcare Diagnostics Inc., Los Angeles, CA, USA) and a commercial kit; assay sensitivity was 11.7 pg/ml and the intra-assay CV was 7.6%.
Statistical analyses
Data were analyzed as a replicated Latin square design as suggested by Kaps and Lamberson (Reference Kaps and Lamberson2004) using the MIXED procedure of SAS (SAS Institute, Cary, NC, USA). For variables with non-repeated measures intake (CD, PD, RN, MNF, MPSE, EUN and DOMI) was
 $$\Upsilon _{{ijkl}} {\rm \, {\equals}\, }\mu {\rm {\plus}}C_{i} {\rm {\plus} }P(c)_{j} {\plus}T_{k} {\plus}{\rm }A(c)_{l} {\plus}e_{{ijkl}} $$
where Y ijkl was the dependent variable, μ the overall mean, C i the fixed effect of the square (i=1, 2 or 3), P(c) j the fixed period effect, nested in square (j=1, 2 or 3), T k the fixed treatment effect (k=T, T+H or H), A(c) l the random effect of animal nested in square (l=1, 2 or 3) and e ijkl the residual error.
For variables with repeated measures over time (glucose, glucagon, insulin, urea, pH, N–NH3 and VFA) the model was
 $$\Upsilon _{{ijklm}} \, {\equals}\, {\rm }\mu {\plus}C_{i} {\plus}{\rm }P(c)_{j} {\plus}T_{k} {\plus}{\rm }A(c)_{l} {\plus}H_{m} {\plus}{\rm }T_{k} {\times}{\rm }H_{m} {\plus}{\rm }e_{{ijklm}} $$
where H m is the fixed effect of sampling time (l=1 to 24) and T k ×H m the fixed effect of the treatment and time interaction. The treatment×period interaction was tested in order to evaluate possible carry-over effect, and was non-significant for any variable. Means were compared using Tukey’s test; significant differences were declared when P<0.05 and trends when 0.05<P<0.10.
Results
Feed intake and nutrient digestibility
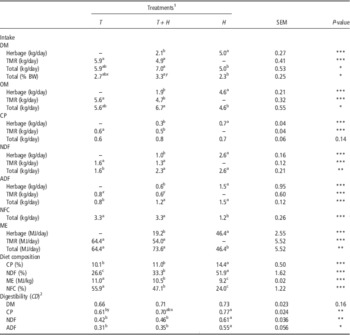
Animals fed T+H consumed 29% herbage as a percentage of total DM intake (DMI) and consumed more DM and OM than those fed H diet (Table 2). DMI expressed as a percentage of BW tended to be higher for animals fed the T+H treatment compared with animals fed T diet (P=0.07). Higher NDF and ADF intakes were observed when animals received diets that included herbage (H and T+H) than when animals were fed T diet, and NFC and ME intake were lower for H treatments compared with T+H and T treatments (Table 2). The concentration of CP in the diet was higher for H treatment compared with the other two treatments, but CP consumption did not differ among treatments. Animals had a higher NDF, ADF and CP digestibility when fed H diet than when fed the other diets.
Nutrient intake, composition of diets and apparent digestibility of nutrients in heifers fed total mixed ration (TMR), herbage or both

DM=dry matter; OM=organic matter; EE=ether extract; NFC=non-fiber carbohydrate, calculated as: %NFC=%MO−(%CP+%NDF+%EE); ME=metabolizable energy estimated using values from the Cornell Net Carbohydrate and Protein System v. 6.1.
a,b,cLeast square means in the same row with different superscripts are different (*P<0.05; **P<0.01; ***P<0.001).
x,y Least square means in the same row with different superscripts are different (P<0.10).
1 T: total mixed ration 24 h; T+H: total mixed ration 18 h+6 h legume-based herbage; H: legume-based herbage 24 h.
2 CD=coefficient of apparent digestibility, calculated as: (g ingested−g excreted in feces)/g ingested.
Ruminal parameters and microbial protein synthesis
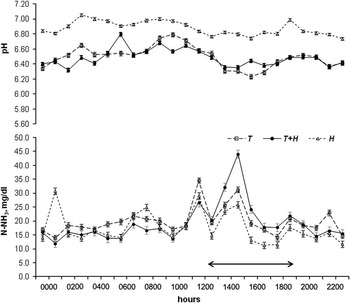
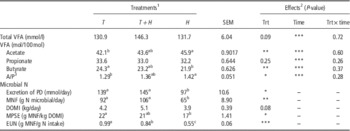
Mean ruminal pH values were higher for heifers fed H diet (pH=6.87; P<0.01) than for heifers fed treatment T (pH=6.51) or T+H (pH=6.46) (Figure 1). The mean ruminal N–NH3 concentrations (Figure 1) did not differ among treatments (overall mean=18.9 mg/dl; P=0.24). Both variables were affected by the time of sampling (P<0.05), but no interaction between treatment and time was observed. Total VFA concentrations (mmol/l) tended to be higher for animals in T+H treatment (Table 3). Those concentrations differed according to the sampling time, but no interaction between treatment and time was detected. The H treatment had proportionately higher acetic acid and lower butyric acid than T treatment (Table 3). The H treatment had a lower MNF than the other two treatments, and a lower MPSE than the T treatment; no difference was found between T and T+H treatments for these variables. The EUN decreased as the proportion of herbage in the diet increased (Table 3).
Daily kinetics of pH and N–NH3 in heifers fed total mixed ration (TMR) 24 h (T), TMR 18 h+legume-based herbage 6 h (T+H) or legume-based herbage 24 h (H) (mean±SD, n=9). Horizontal arrow indicates the access to legume-based herbage in the T+H treatment. Vertical bars for each hour indicate SEM.

Ruminal volatile fatty acid (VFA) and microbial protein synthesis in heifers fed total mixed ration (TMR), herbage or both

PD=purine derivatives (allantoin+uric acid); MNF=microbial N flow; DOMI=digestible organic matter intake; MPSE=microbial protein synthesis efficiency; EUN=use efficiency of ingested N for microbial protein synthesis.
a,b,cLeast square means in the same row with different superscripts are different (*P<0.05; **P<0.01; ***P<0.001).
1 T: total mixed ration 24 h, T+H: total mixed ration 18 h+h legume-based herbage, H: legume-based herbage 24 h.
2 Trt: treatment, time: hour, trt×time: treatment per hour interaction.
3 A/P: ratio of acetate to propionate.
Plasma concentration of glucose, urea, glucagon and serum concentration of insulin
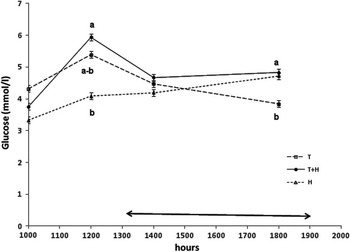
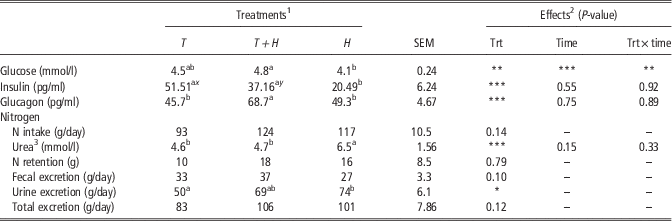
The glucose concentration in the plasma was lower for animals fed H diet compared with animals fed T+H, with an interaction between treatment and the time of sampling (P=0.04, Figure 2). The insulin concentration was lower in animals fed H diet compared with animals fed T+H and T, and glucagon concentration was higher when animals fed T+H compared with the other two treatments (Table 4). The highest concentrations of urea in blood were observed when animals consumed H diet. Heifers fed H diet increased excretion of urinary N (Table 4).
Glucose kinetics in heifers fed total mixed ration (TMR) 24 h (T), TMR 18 h+legume-based herbage 6 h (T+H) or legume-based herbage 24 h (H), (mean±SD, n=9). Horizontal arrow indicates the access to legume-based herbage in the T+H treatment. Vertical bars for each hour indicate SEM. a,bLeast square means in the same hour with different superscripts differ (P<0.05).

Plasma glucose, urea, glucagon, serum insulin and retention of nitrogen in heifers fed total mixed ration (TMR), herbage or both

a,bLeast square means in the same row with different superscripts are different (*P<0.05; **P<0.01; ***P<0.001).
x,yLeast square means in the same row with different superscripts are different (P<0.1).
1 T: total mixed ration 24 h, T+H: total mixed ration 18 h+6 h legume-based herbage, H: legume-based herbage 24 h.
2 Trt: treatment, time: hour, trt×time: treatment per hour interaction.
3 Urea: urea concentration in plasma.
Discussion
Intake and nutrient availability
The proportion of herbage in the T+H treatment (29% of DMI), was similar to the maximum levels of forage in the diet reported by Wales et al. (Reference Wales, Marett, Greengood, Wright, Tornhill, Jacobs, Ho and Auldist2013) that allow to maintain consumption and milk production in dairy cows. Animals fed T+H tended to show the highest intake, which was high according to Moore et al. (Reference Moore, Brant, Kunkle and Hopkins1999) (3.1% of BW, OM basis) considering the level of herbage included in this diet. This may be due to the high digestibility of fiber of the herbage (CDNDF was 0.61 when herbage was used as the only feed, whereas TMR CDNDF was 0.42). In dairy cows fed combined diets, it has been previously reported that herbage quality has a significant impact on the digestive and metabolic response (Vibart et al., Reference Vibart, Fellner, Burns, Huntington and Green2008). Moreover, Oba and Allen (Reference Oba and Allen1999) reported that a one-unit increase in NDF digestibility was associated with a 0.17 kg increase in DMI per day, which is consistent with the results observed in our study (with the increase in NDF intake of 0.7 kg/day and the increase of 4 percentage units of CDNDF when animals were fed T+H compared with T diets).
The greatest CD of the fiber occurred when heifers consumed H diet, which could be related to a more favorable ruminal environment for the development of cellulolytic bacteria, as it has been observed by Mosoni et al. (Reference Mosoni, Chaucheyras-Durand, Béra-Maille and Forano2007) for herbage diets. This result is consistent with the higher pH values and the higher proportion of acetic acid observed for animals fed H diet. Conversely, the lower CD in treatments T and T+H could be due to the presence in the TMR of sorghum silage with a fibrous fraction (ADF content: 40.2%, DM basis) that was more difficult to digest, which comprised the fibrous component of the TMR.
Plasma glucose, urea, glucagon and serum insulin
The lower plasma glucose of H treatment coincides with the lower intake of NFC of this treatment. Although the dilution effect created on energy concentration by the inclusion of herbage, the ME and NFC intakes of heifers fed T+H and T diets were similar. However, and even considering that hormones could be affected by the carry-over effect derived from this experimental design, heifers under T+H and T treatments showed a different metabolic strategy for maintaining similar levels of glucose. In fact, heifers fed T+H had higher glucagon concentration, indicating a higher synthesis of glucose in the liver. This could be related to a higher ruminal fermentation of starch, although no differences were observed in ruminal environment. Conversely, heifers receiving T diet had higher insulin : glucagon ratio (1.13) compared with the T+H (0.54) because of a higher concentration of insulin, which can indicate a higher intestinal starch digestion and glucose absorption according to Huntington et al. (Reference Huntington, Harmon and Richardset2006).
N metabolism
Nitrogen metabolism differed among treatments. Although no differences were detected in N intake or in the ruminal N–NH3 concentrations, animals fed H diet had higher levels of urea in the plasma and excreted more N in the urine. These differences could be due to a decrease in the capture of N–NH3 for MNF, as well as a higher rate of ruminal absorption of dissociated N–NH3 due to the less acidic pH in animals fed H diet.
The MNF and MPSE were similar for heifers fed T+H and those fed T diet, but both variables decreased for H diet, probably due to the reduced availability of energy substrates in the rumen. The higher MNF in heifers fed T+H or T is consistent with the higher DOMI and the lower pH values for these treatments compared with the animals exclusively fed H diet. This reinforces the idea expressed by other authors (Bach et al., Reference Bach, Calsamiglia and Stern2005), who reported a strong positive association between MNF and DOMI and a negative association between MNF and pH (for ruminal pH values between 7 and 5.8).
The high EUN observed in animals fed T and T+H may be associated with the fact that CP content of the diets (T=10.1% CP, T+H=11.0% CP) were very close to the animal’s requirements according to CNCPS (84% and 91% of the CP target for the diet). In addition, it could be expected that feeding animals with a TMR rather than herbage should result in a more synchronized availability of energy and N sources because of the higher protein : energy ratio of the latter (9.31 to T v. 15.0 to H g of CP/MJ ME), and this could partially explain the higher EUN in those treatments that included TMR. According to Reynolds and Kristensen (Reference Reynolds and Kristensen2008), the protein content of T and T+H diets would lead to an increase in fraction of N recycled to provide a source of N for the synthesis of microbial protein, increasing the EUN. Regardless, in this study, there was no evidence for a restriction in N availability because the ruminal N–NH3 concentration was >5.0 mg/dl. This ammonia level was considered a threshold value below which the microbial protein synthesis would be affected (Satter and Slyter, Reference Satter and Slyter1974). In our experiment, when herbage with a high CP digestibility (77% v. 61%, for herbage and TMR, respectively) was included in T+H diet, DMI tended to increase compared with T treatment, with no change in MPSE. Finally, the T+H diet improved the EUN of the herbage, decreasing N excretion to the environment.
Conclusions
Six hours of access to legume-based herbage, allowed for a combined diet including 29% herbage (DM basis), which led to consumption and digestion of nutrients similar to a TMR diet and a modified glucose metabolism that increased the concentrations of glucagon in heifers. The combined diet also improved MNF and EUN and decreased urinary excretion of N compared with an all-herbage diet. The use of combined diets with TMR : herbage ratios similar to those used in this experiment could help achieve similar feed intake to animals fed an all TMR diet and could simultaneously improve the metabolism and utilization of N compared with pasture-based diets.
Acknowledgements
The authors would like to thank Mariana Morales, Lorena Arellano, Fernando López, Jacionta Ubilla, Matías Berrutti, Juan Pablo Albornoz, Ana Claudia Ferreira and Diego Acosta (Veterinary students) and experimental field staff for making possible the realization of this research with their work and effort.