
I. INTRODUCTION
Ni based powder metallurgy (P/M) superalloys have been extensively used in gas turbine engines due to their excellent combinations of properties, including ultra-high strength, corrosion resistance, and superior fatigue strength at elevated temperature and aggressive environments. Reference Medeiros, Frazier and Prasad1,Reference Donachie and Donachie2 With the development of aerospace technology, gas turbine engine inevitably requests more outstanding performance of turbine disc materials, thus a new Ni based P/M superalloy with higher cobalt (Co) content and minor addition of hafnium (Hf) was devised. Increase of Co content in a certain range was reported to improve phase stability, lower the gamma solvus temperature, and reduce the stress induced by cooling and quenching. Reference Heslop3–Reference Jarrett and Tien5 The addition of appropriate amount of Hf was considered to promote grain-boundary effects and formation of cellular γ′ precipitation Reference Donachie and Donachie2 as well as enhance the compressive performance of Ni based superalloys. Reference Miner6 Currently, the fabrication of P/M superalloy turbine discs generally involves powder preparation, hot isostatic pressing (HIP), and hot forging (HF). However, the as-HIPed alloys are prone to suffer cracks during hot forging due to the existence of prior powder boundaries (PPBs) Reference Somani, Rao, Birla, Bhatia, Singh and Prasad7,Reference Somani, Muraleedharan, Prasad and Singh8 and hot extrusion is considered to be an effective way to break the continuous PPBs and improve the forgeability. Reference Somani, Rao, Birla, Bhatia, Singh and Prasad7–Reference Somani, Birla, Prasad and Singh9
Nevertheless, the superior deformation resistance and inferior plasticity of P/M Ni based superalloys make them extremely difficult to be extruded. In addition, the sensitivity and complexity in microstructure lead to the narrow processing window for forming the superalloy. As a result, the superalloys usually need to be deformed at controllable strain rate, appropriate reduction and temperature over 1000 °C. Reference Alniak and Bedir10 Hot deformation under these extreme conditions would cause catastrophic defects, such as cracks and flow localization, which arose from low processing temperature, large reduction, deformation friction, inappropriate strain rate, or local chilling. Reference Donachie and Donachie2 Consequently, as to obtain favorable microstructure and profile, it is urgent and essential to understand the deformation behaviors and further optimize hot working conditions of P/M Ni based superalloys.
Significant attentions were paid to explore the hot working parameters for forming the superalloys using processing maps over the past 30 years, such as Rene 95, Reference Alniak and Bedir11 IN-625, Reference Guo, Li, Guo, Wu, Peng and Hu12 IN-718, Reference Sui, Xu, Chen and Liu13 IN-706, Reference Huang, Wang, Lian, Zhang and Zhao14 NIMONIC AP-1, Reference Somani, Rao, Birla, Bhatia, Singh and Prasad7 IN-100, Reference Somani, Muraleedharan, Prasad and Singh8 IN-690, Reference Guo, Li, Pen, Guo and Hu15 and others. Reference Ning, Yao, Yang, Guo and Fu16,Reference He, Liu, Si, Yang and Jiang17 However, few studies were able to take hot cracks into consideration when proposing optimum deformation parameters, especially for HIPed P/M Ni based alloy. Understanding the mechanism of crack formation would make a more remarkable contribution to extrude this alloy with uniform-fine grains and favorable appearance.
In this study, processing map was used to analyze the hot deformation behaviors of this new alloy during hot compression. The microstructure evolutions of the alloy corresponding to different deformation conditions were investigated. In addition, activation energy, constitutive equations, and the domains in processing maps were determined. The established constitutive equations were applied to predict the true stress at different deformation conditions with an average absolute relative error of 6.46%. The surface cracks and the critical strain for avoiding such occurrence were studied. Mechanism for occurrence of compression cracks is proposed according to experimental analysis. These results can shed more light on optimizing hot working parameters.
II. MATERIALS AND EXPERIMENTAL WORK
A. Material
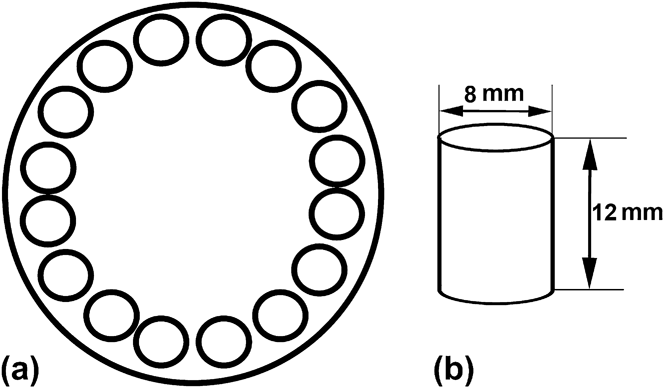
The material used for this program was a new-designed Ni based P/M superalloy (PM-0002) with the exact composition measured by ICP-AES as follow: Co about 25.3 wt%, Cr 13.3%, W 3.8%, Mo 3.7%, Al 3.2%, Ti 3.9%, Nb 0.95%, Zr 0.53%, C 0.08%, Hf 0.22%, and balance nickel. The as-HIPed ingot 90 mm in diameter and 120 mm long (d90 mm × 120 mm), was synthesized via vacuum induction melting followed by argon gas atomization and hot isostatic pressing. The cylinder compression specimens, d8 mm × 12 mm, were machined from the concentric circles of the ingot to ensure uniform microstructure across all samples, as illustrated in Fig. 1. The microstructure of the as-HIPed alloy obtained by SEM is presented in Fig. 2, which shows the existence of the PPBs, as indicated by the white arrows. Technique of Electro-Probe Microanalyzer (EPMA) was used to detect the distribution of elements and also the constitution of PPB.
Schematic diagram showing (a) the position where the specimens are cut and (b) the dimension of the specimen used for compression.

Microstructure of as-HIPed Ni based P/M superalloys obtained by SEM.

B. Hot compression test and microstructure examination
The hot compression tests were conducted on a Gleeble 3180D thermal simulator (Dynamic Systems, Inc., New York, New York) at temperatures ranging from 1000 °C to 1100 °C and constant strain rates of 0.01–1.0 s−1. The specimens were heated at a rate of 5 °C/s and soaked for 2 min at the deformation temperature before being compressed to a final true strain of 0.7, and then quenched manually upon completion of their deformation. The critical strain for avoiding surface cracks were also determined by the method of dichotomy theory.
The deformed specimens were sectioned parallel to the compression axis and prepared using standard metallographic techniques for optical and electronic observation. Optical microscope (LEICA-DM4000M, Leica Microsystems, Wetzlar, Germany) and field-emission gun SEM, equipped with electron backscatter diffraction (EBSD) detector, were used. EBSD was applied to characterize the recrystallized microstructure of the alloy. The etchant used in this work was a solution of 100 mL HCl, 100 mL ethanol, and 5 g CuCl2. Reference Vander Voort18
C. Determination of critical strain for avoiding surface cracks and fracture observation
The critical strain for avoiding cracks under established optimum processing conditions was determined using dichotomy theory. The heating procedures were the same as previous hot compression tests. The deformed specimens were sectioned parallel to the compression axis and prepared using standard metallographic techniques for optical and electronic observation. Samples were also cut parallel to the direction of crack propagation for observation of fracture. The grain size and distribution were statistically measured based on the data obtained by EBSD.
III. RESULTS AND DISCUSSION
A. Constitution of prior particle boundaries
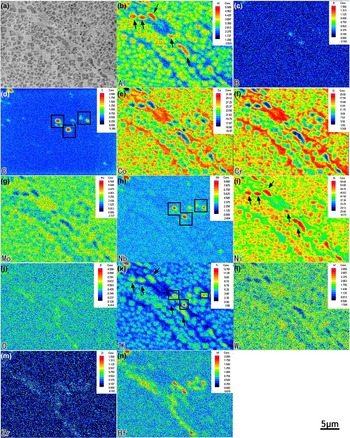
Figure 3 presents the distribution of elements around the PPB. PPB is one of the three major metallurgical defects which affect the performance of Ni based P/M superalloy, and had been reported as one of the major factors resulting in low ductility. Reference Ingesten, Warren and Winberg19,Reference Youdelis and Kwon20 As can be seen clearly, the elements of aluminum and nickel [Figs. 3(b) and 3(i), indicated by arrow] are found to concentrate at the large bulk, and the enrichment of elements carbon, niobium, and titanium [Figs. 3(d), 3(h) and 3(k), indicated by rectangle] are also observed. In addition, concentration of elements of oxygen, zirconium, and hafnium [Figs. 3(j), 3(m) and 3(n)] are detected in the form of continuous bands. It is reasonable to conclude that the PPBs consist of large-size γ′ (indicated by arrow), carbides (mainly rich in Ti and Nb), and oxides (contain Hf and Zr). Carbides and oxides were reported as detrimental phases to mechanical properties, some of which would serve as the hot crack sources during deformation according to previous reports. Reference Somani, Rao, Birla, Bhatia, Singh and Prasad7,Reference Somani, Muraleedharan, Prasad and Singh8,Reference Rao, Srinivas and Sarma21
Distribution of elements around the PPB of the alloy showing the enrichment of elements: (a) represents the micrograph of as-HIPed alloy, (b)–(n) indicate the distribution of elements of Al, B, C, Co, Cr, Mo, Nb, Ni, O, Ti, W, Zr, Hf, respectively.

B. Stress–strain curves under hot deformation
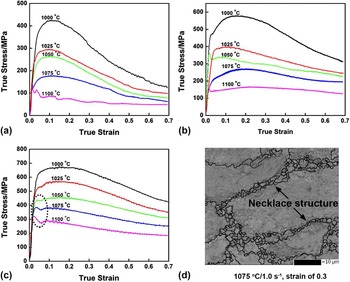
The typical true stress–true strain curves of the alloy PM-0002 are presented in Fig. 4, which are consistent with the common deformation characteristics of other Ni based superalloys. However, the phenomenon of two peaks in stress is observed under high temperatures and strain rates according to our results. As shown in Fig. 4(c) at temperature higher than 1050 °C (indicated by circle), the flow stress increases rapidly to the first peak at the beginning of deformation with increasing strain and then decreases to a valley stress after which the stress continues to increase to the second peak. This phenomenon of double peak is in accordance with that of previous report. Reference Ning, Yao, Fu and Guo22 The physics might be ascribed to the combination of work hardening and dynamic recrystallization (DRX) during hot deformation. For the case of high strain rate, the instantaneous increasing of dislocation density resulted in the initial rapid rising in flow stress at the early period of deformation. High enough dislocation density would stimulate the occurrence of DRX, leading to annihilation of dislocation. The higher temperatures would accelerate atom diffusion rate, which promotes the process of dislocation annihilation that leads to the decrease of stress after first peak. Figure 4(d) shows the microstructure of specimen deformed at 1075 °C/1.0 s−1, dynamic recrystallized grains (DRG) are found to form at the PPB and develop into necklace-like structure (NS), leading to a decrease in stress. With the progress of deformation, the stress starts to rise again to the second peak until more grains continue to generate at new grain boundaries and develop into further layers of NS. The formation of NS layer by layer results in the fluctuations of stress after the second stress peak.
Typical flow stress–strain curves of Ni based superalloy PM-0002 deformed at (a) 0.01 s−1; (b) 0.1 s−1; (c) 1.0 s−1, (d) orientation map obtained by EBSD.

C. Deformation activation energy and constitutive equation for the alloy PM-0002
Generally, plastic deformation can be considered as a thermally activated process and the peak stress could be related to strain rate and deformation temperature through the hyperbolic sine Arrhenius kinetic rate equation Reference Arrhenius23 :
 $$Z = \dot \varepsilon \exp \left( {{{{Q_{{\rm{def}}}}} \over {RT}}} \right) = A{\left( {\sinh \left( {\alpha \sigma } \right)} \right)^n}$$
or
 $$Z = \dot \varepsilon \,\exp \left( {{{{Q_{{\rm{def}}}}} \over {RT}}} \right) = A'\,\exp \left( {\beta \sigma } \right)$$
 $$Z = \dot \varepsilon \,\exp \left( {{{{Q_{{\rm{def}}}}} \over {RT}}} \right) = A''{\sigma ^{n'}}\quad .$$
In the above equations, A, A′, A″, n, n′, α, and β are constants, Q is the activation energy of deformation, R is the universal gas constant (8.31 J/mol K), T is the absolute temperature, σ is stress,
 $\dot \varepsilon$
is the strain rate, and Z is the Zener–Hollomon parameter or temperature compensation for
 $\dot \varepsilon$
. The activation energy Q could be obtained by arithmetic operations as follows:
 $${Q_{{\rm{def}}}} = R{\left[ {{{\partial \ln \,\dot \varepsilon } \over {\partial \ln \left[ {\sinh \left( {\alpha \sigma } \right)} \right]}}} \right]_T}{\left[ {{{\partial \ln \left[ {\sinh \left( {\alpha \sigma } \right)} \right]} \over {\partial \left( {{1 \over T}} \right)}}} \right]_{\dot \varepsilon }}\quad .$$
The value of Q could be obtained when the value of α is determined. The constants β and n′ are related by β = αn′, so that α can be determined simply from experimental data.
By taking the natural logarithm of the above relations (1) through (3), the following equations can be obtained correspondingly:
 $$\ln \,Z = \ln \,\dot \varepsilon + {{{Q_{{\rm{def}}}}} \over {RT}} = \ln \,A + n\,\ln \left[ {\sinh \left( {\alpha \sigma } \right)} \right]$$
 $$\ln \,Z = \ln \,\dot \varepsilon + {{{Q_{{\rm{def}}}}} \over {RT}} = \ln \,A' + \beta \sigma$$
 $$\ln \,Z = \ln \,\dot \varepsilon + {{{Q_{{\rm{def}}}}} \over {RT}} = \ln A'' + n'\,\ln \quad .$$
At constant temperature, the constants can be obtained as follows:
 $$n = {\left[ {{{\partial \ln \,\dot \varepsilon } \over {\partial \ln \left\{ {\sinh \left( {\alpha \sigma } \right)} \right\}}}} \right]_T}$$
 $$\beta = {\left[ {{{\partial \ln \,\dot \varepsilon } \over {\partial \sigma }}} \right]_T}$$
 $$n' = {\left[ {{{\partial \ln \,\dot \varepsilon } \over {\partial \ln \,\sigma }}} \right]_T}$$
 $$\alpha = {\beta \mathord{\left/ {\vphantom {\beta {n'}}} \right. \kern-\nulldelimiterspace} {n'}}\quad .$$
Herein, the peak stresses are used to calculate the deformation activity energy Q. The plots of ln σp versus
 $\ln \dot \varepsilon$
and σp versus
 $\ln \dot \varepsilon$
were presented in Figs. 5(a) and 5(b). The constants of β and n′ can be obtained accordingly to linear regression, and then the constant α is determined based on Eq. (11).
Relationships between (a) ln σp and
 $\ln \dot \varepsilon$
; (b) σp and
 $\ln \dot \varepsilon$
; (c) ln[sinh(ασp)] and
 $\ln \dot \varepsilon$
; (d) ln[sinh(ασp)] and (1000/T).

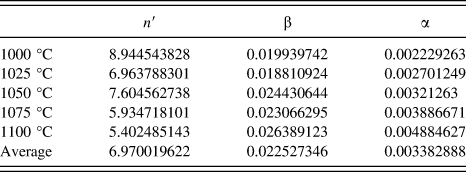
Based on Figs. 5(a) and 5(b), the values of n′, β, and α parameters at each temperature as well as the mean values of these parameters were determined, as shown in Table I.
Values of n′, β, and α obtained at each temperature and the mean values of these parameters.
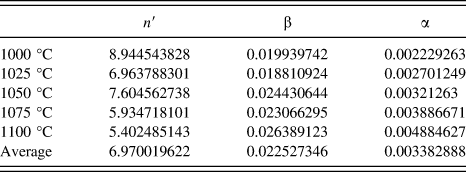
The value of constant α could be determined as 0.0034 according to the results in Table I. The curves of ln[sinh(ασp)] − (1000/T) and ln[sinh(ασp)] −
 $\ln \,\dot \varepsilon$
are plotted [Figs. 5(c) and 5(d)] to calculate the slopes, which are further substituted into Eq. (4) to finally determine Q as 1012.9 kJ/mol.
The temperature compensated strain rate parameter, or the Zener–Hollomon parameter, could be defined as follows Reference Zener and Hollomon24 :
 $$Z = \dot \varepsilon \exp \left( {{{{Q_{{\rm{def}}}}} \over {RT}}} \right)$$
or,
 $$Z = A{\left[ {\sinh \left( {\alpha {\sigma _{\rm{p}}}} \right)} \right]^n}\quad .$$
The true stress σ correlated with Z parameter could be expressed by mathematical transformation according to Eqs. (1) and (13) as follow:
 $$\sigma = {1 \over \alpha }\,\ln \left\{ {\left. {{{\left( {{Z \over A}} \right)}^{{1 \mathord{\left/ {\vphantom {1 n}} \right. \kern-\nulldelimiterspace} n}}} + {{\left[ {{{\left( {{Z \over A}} \right)}^{{2 \mathord{\left/ {\vphantom {2 n}} \right. \kern-\nulldelimiterspace} n}}} + 1} \right]}^{{1 \mathord{\left/ {\vphantom {1 2}} \right. \kern-\nulldelimiterspace} 2}}}} \right\}} \right.\quad .$$
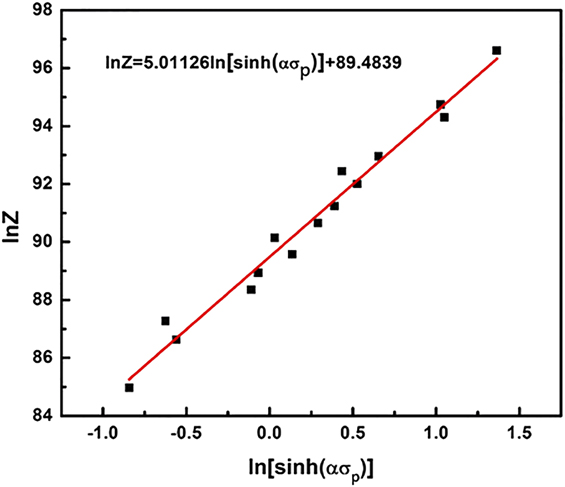
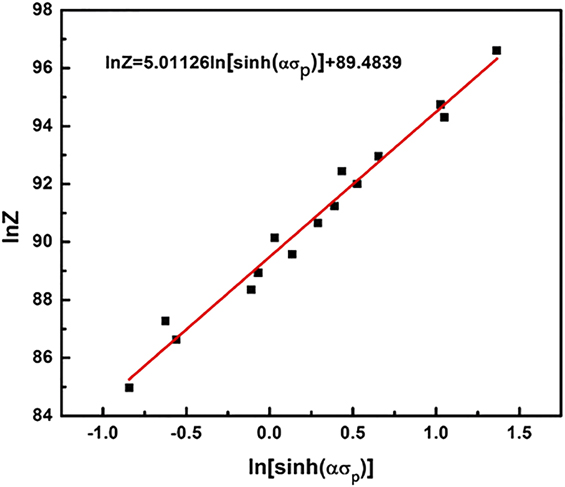
The relationship between Zener–Hollomon parameter and [sinh(ασp)] is shown in Fig. 6. The plot shows a good linear correlation between flow stress and Z parameter with the correction coefficient R = 0.9786, indicating that the established constitutive equations of hyperbolic function are valid during hot deformation. The slope represents the exponent n which is 5.011, and constant A could also be determined as 1.6185 × 1039 using linear regression. With this, the constitutive equation for PM-0002 is established as:
 $$\dot \varepsilon = 1.6185 \times {10^{39}}{\left[ {\sinh \left( {0.0034{\sigma _{\rm{p}}}} \right)} \right]^{5.011}}\exp \left( {{{ - 1012900} \over {RT}}} \right)\quad .$$
Relationship between ln Z and ln[sinh(ασp)].
According to the aforementioned method, the parameters (n, A, α, Q) in constitutive equations for other strains from 0.05 to 0.65 with the interval of 0.05 could also be determined. The constitutive equations for the alloy with different strains were developed by applying five-order multinomial to fit the relationship between true strain and parameters (n, A, α, Q) as follows:
 $$n = 3.203 + 1.861\varepsilon + 36.327{\varepsilon ^2} - 216.928{\varepsilon ^3} + 367.834{\varepsilon ^4} - 203.070{\varepsilon ^5}$$
 $$\ln \,A = 69.568 + 513.2931\varepsilon - 3478.044{\varepsilon ^2} + 8570.177{\varepsilon ^3} + - 9756.741{\varepsilon ^4} + 4269.898{\varepsilon ^5}$$
 $$\alpha = 0.00615 - 0.00194\varepsilon - 0.10437{\varepsilon ^2} + 0.41601{\varepsilon ^3} - 0.51426{\varepsilon ^4} + 0.25054{\varepsilon ^5}$$
 $$Q = 812.414 + 6306.267\varepsilon - 44329.484{\varepsilon ^2} + 112826.358{\varepsilon ^3} - 131263.735{\varepsilon ^4} + 58233.643{\varepsilon ^5}\quad .$$
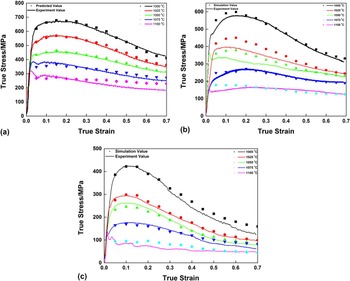
The predicted values obtained by the established constitutive equations together with experimental values of true stress are shown in Fig. 7. As can be seen in Fig. 7, the predicted values fit very well with experimental value, which indicates that the established constitutive equations can predict the true stress for the studied alloy effectively. Herein, two statistical parameters, correlation (R) and average absolute relative error (AARE) are utilized to assess the accuracy of the predicted values. R and AARE can be obtained by following expressions Reference Zhang, Hu, Zhu, Ding and Qin25 :
 $$R = {{\sum\limits_{i = 1}^N {\left( {{X_i} - \bar X} \right)\left( {{Y_i} - \bar Y} \right)} } \over {\sqrt {\sum\limits_{i = 1}^N {{{\left( {{X_i} - \bar X} \right)}^2}\sum\limits_{i = 1}^N {{{\left( {{Y_i} - \bar Y} \right)}^2}} } } }}$$
 $${\rm{AARE}}\;(\% ) = {1 \over N}\sum\limits_{i = 1}^N {\left| {{{{Y_i} - {X_i}} \over {{Y_i}}}} \right|} \times 100\quad ,$$
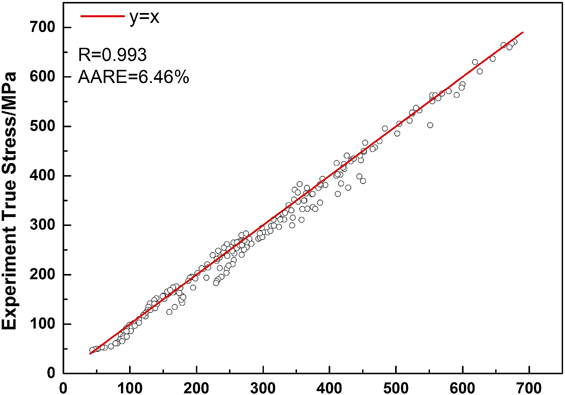
wherein, N is the total number counted, X i and Y i are the experimental and predicted values, respectively. Figure 8 shows the statistic results of AARE and the correlations between the experimental and predicted flow stress. The AARE is determined as 6.46% and R = 0.993, which demonstrates the excellent accuracy of the established constitutive equations.
True stress–true strain curves obtained by experiment and predicted values for the alloy at: (a) 1.0 s−1; (b) 0.1 s−1; (c) 0.01 s−1; the predicted values of true stress fits well with the experimental results.

The correlations between the experimental and predicted flow stress.

D. Processing maps and microstructure analysis
The processing map based on the dynamic material model and Prasad instability criterion Reference Prasad, Gegel, Doraivelu, Malas, Morgan, Lark and Barker26 was utilized to understand the hot deformation behaviors of PM-0002. In this model, the total power P can be divided into two complementary functions: G content and J co-content:
 $$P = G + J = \int_0^{\dot \varepsilon } {\sigma \,{\rm{d}}\dot \varepsilon } + \int_0^\sigma {\dot \varepsilon \,{\rm{d}}\sigma } \quad .$$
In brief, the ratio of dJ/dG is equivalent to the strain rate sensitivity exponent m. Reference Prasad, Gegel, Doraivelu, Malas, Morgan, Lark and Barker26 During the deformation, the proportion of the power dissipated by microstructure evolution over the total power could be defined as efficiency of power dissipation, and given by Reference Prasad, Gegel, Doraivelu, Malas, Morgan, Lark and Barker26 :
 $$\eta = 2m/(m + 1)\quad .$$
The power dissipation map is obtained by plotting iso-efficiency contour map, in which the value of η varies with deformation temperature and strain rate.
The continuum instability basing on the extremum principles of irreversible thermodynamics has been established to identify the domain of flow instabilities, and given by Reference Prasad, Gegel, Doraivelu, Malas, Morgan, Lark and Barker26 :
 $$\xi (\dot \varepsilon ) = {{\partial \ln \left[ {m/(m + 1)} \right]} \over {\partial \ln \,\dot \varepsilon }} + m \;\lt\; 0\quad .$$
The parameter
 $\xi (\dot \varepsilon )$
is utilized to plot the instability map, in which the metallurgy instability occurs in the domains where
 $\xi (\dot \varepsilon ) \;\lt \;0$
. With this, the well-known processing map is established by superimposing the instability map on the power dissipation map. In this map, the domains with local peak efficiency usually exhibit specific microstructure mechanism. Therefore, the processing map must be related with the microstructure evolution of the alloy to predict the optimum hot working parameters.
Figs. 9(a)–9(g) show processing maps of as-HIPed PM-0002 generated at strains of 0.1–0.7. Each map could be clearly classified into two regions: instability domains (marked as shadows) and stability domains (other than the shadows). The domains with local efficiency peak of power dissipation, framed by rectangle, are supposed to be optimum hot deformation conditions, which needs to be further verified by microstructure and macroprofile observations.
Processing maps of the alloy at different strains: (a) 0.1; (b) 0.2; (c) 0.3; (d) 0.4; (e) 0.5; (f) 0.6; (g) 0.7.

1. Instability domain
As shown in Fig. 9, the instability domain extends gradually with increasing of strain, predicting that the alloy would undergo flow instability when deformed at these domains. For example, Fig. 10 shows the metallograph of the specimen deformed at 1100 °C/1.0 s−1 with a strain of 0.7. The specimen exhibits severe localized deformation oriented at some degree with respect to the deformation axis, leading to a significant nonuniformed deformation across the sample. Similar situations can be seen in other specimens deformed at this domain. The formation of shear deformation during compression was related to the generation of adiabatic heating associated with the lower thermal conductivity of this alloy in comparison to other materials. Reference Han, Liu, Zou, Liu and Qiao27,Reference Peng, Zeng, Wang and Yu28 The mechanism might be attributed to the insufficient time for releasing the deformation heat when the specimen was deformed at higher strain rates, leading to a localized temperature rise. The accumulation of deformation heat would result in the formation of bands of flow localization, which stimulates the occurrence of flow instability.
Microstructure of specimen that deformed to a strain of 0.7 within the instability domain, under conditions of 1025 °C/1.0 s−1.

Thus, for the PM-0002 alloy the instability domain for strain of 0.7 could be determined as: at the temperature range of 1000–1100 °C and strain rate is higher than 0.2 s−1.
2. Stability domain
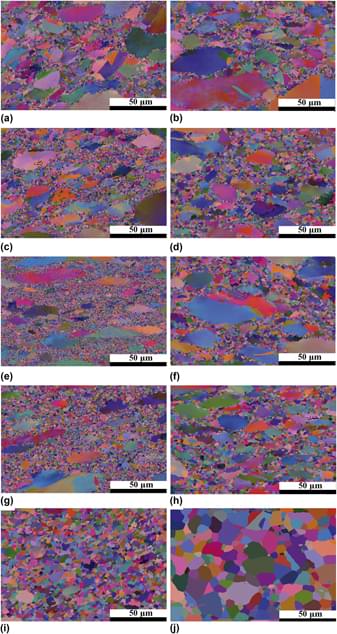
Taking the map at the strain of 0.7 as an example [Fig. 9(d)], the stability domain occurs at lower strain rate (<0.16 s−1) which exhibits two domains with peak efficiency: one was located at conditions of 1005 °C/0.014 s−1 with efficiency of about 68%, the other occurred at 1075 °C/0.014 s−1 with efficiency higher than 70%. Figure 11 shows the orientation maps of specimens deformed under different hot working parameters. As can be seen in Fig. 11, dynamic recrystallization occurs under most deformation conditions at this domain, and the amount of new fine recrystallized grains increase with increase of deformation temperature. For the case at low strain rate of 0.1 s−1, insufficient time for deformation may inhibit the process of dynamic recrystallization, resulting in inheritance of a few amounts of nonrecrystallized grains, as shown in Fig. 11(a). In addition, slight surface crack is detected when the specimen is deformed at 1000 °C/0.1 s−1, indicating the poor workability of the alloy at this deformation condition. When the strain rate decreases to 0.01 s−1 [Figs. 11(b), 11(d), 11(f), 11(h), and 11(j)], significant DRX is achieved owing to the sufficient time for atom diffusion and dislocation annihilation. With the progress of deformation continuing, the grain boundaries became serrated, which would serve as the nucleation source for DRX. These new grains subsequently develop into ‘necklace-like’ structure, which would proceed layer by layer until the completion of dynamic recrystallization. As shown in Fig. 11(h), fully recrystallized microstructure is detected and PPBs are nearly eliminated when the specimen is deformed to a true strain of 0.7 under 1075 °C/0.01 s−1. When the temperature increases to 1100 °C [Fig. 11(j)], completed dynamic recrystallized microstructure is observed; however, some of the grains start to grow up.
EBSD observation of microstructures for specimens deformed to a total strain of 0.7 at given strain rates and temperatures: (a), (c), (e), (g), and (i) represent the deformation temperature of 1000 °C, 1025 °C, 1050 °C, 1075 °C, and 1100 °C at a strain rate of 0.1 s−1, respectively; (b), (d), (f), (h), and (j) represent the deformation temperature of 1000 °C, 1025 °C, 1050 °C, 1075 °C, and 1100 °C at a strain rate of 0.01 s−1, respectively.

With the analyzing of the processing maps as well as the microstructures, the optimum hot working parameters can be determined as 1075 °C/0.014 s−1, at which the alloy exhibit favorable recrystallized microstructure and superior workability.
E. Surface cracks for the alloy during hot compression
When the specimens were deformed to a true strain of 0.7, surface cracks distributing on the outer circumference were observed along the direction of the compression axis. One of these samples deformed at conditions of 1000 °C/1.0 s−1 is shown in the right up corner of Fig. 12(a). The formation of compression cracks was a time correlated process. As can be seen in Fig. 12(a), four different periods for cracks are marked by arrows and numbered in order, showing the initiation and propagation of cracks. #1 represents the initial existence of PPB prior to the formation of cracking. #2 shows the micro-crack formed at the PPB which would propagate along the boundaries with further deformation. #3 demonstrates the severe cracking after cracks propagate further toward the center, which leads to a much serious fracture, as illustrated by arrow #4. Figure 12(b) shows a close-up micrograph demonstrating the cracks propagated along the PPB toward the center of the specimen. Additionally, Fig. 12(c) displays the SEM image of the fracture mode characterized by intergranular fracture, where separated powder can be seen clearly after cracks propagating along the PPBs, as indicated in Fig. 12(d).
SEM photographs showing the initiation and propagation of cracks deformed at 1075 °C/0.01 s−1: (a) four different periods of cracks and their propagation directions and (b) cracks propagate along the PPB toward the center of the specimen. (c) Fracture surface of the specimen obtained through SEM; (d) individual powder with about 50 μm in diameter.

F. Critical strain for avoiding fracture under optimum hot working parameters
The optimum hot working parameters are proposed as 1075 °C/0.014 s−1 based on the analyzing of processing maps and microstructures. However, the occurrence of macro-cracking at large strain is detrimental to the properties of the alloy. To find out the critical strain for avoiding the occurrence of cracks become necessary. The critical strain here represents the maximum strain that the specimen could reach without surface cracks.
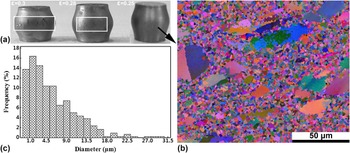
Figure 13(a) shows the macroprofile of the specimens deformed to different strains at 1075 °C/0.014 s−1. As can been seen, the peripheral crack did not emerge until the true strain reaches 0.28. The degree of fracture increases with increase of deformation, as shown in Fig. 13(a). The microstructure of the specimen deformed to a true strain of 0.25 at 1075 °C/0.014 s−1 is presented in Fig. 13(b), similar to the specimen deformed to a strain of 0.7, the specimen also exhibited significant DRX. The average grain size was determined statistically as 7.53 μm using the grain size data obtained from five different positions of the specimen, and the distribution of which is presented in Fig. 13(c).
Specimen deformed to different strains at optimum hot working conditions of 1075 °C/0.01 s−1: (a) macro-profile; (b) microstructure of specimen at a strain of 0.25; (c) distribution of grain size.

IV. CONCLUSIONS
Hot compression tests of a Ni based superalloy had been conducted over the temperature range from 1000 to 1100 °C and at strain rate range of 0.01–1.0 s−1. The processing maps together with microstructure and macroprofile of the alloy had been analyzed. The following conclusions could be drawn:
-
(1) The constitutive equations for PM-0002 at different strains have been developed based on a hyperbolic-sine model to predict the true stress with an error of 6.46%.
-
(2) The instability domain for a strain of 0.7 was located at temperatures from 1000 to 1100 °C and strain rates ranging from 0.2 to 1.0 s−1, mechanism of which could be ascribed to flow localization. Significant dynamic recrystallization was observed in two domains: one at 1005 °C/0.014 s−1 with peak efficiency of 68%: the other at 1075 °C/0.014 s−1 with efficiency higher than 70%.
-
(3) Surface cracks occur when the alloy is deformed to a true strain of 0.7 regardless of deformation conditions. The intergranular cracks initiate from the PPBs at outermost surface and propagate along these boundaries.
-
(4) The optimum processing parameters for the alloy is optimized as 1075 °C and 0.014 s−1. The maximum single-pass reduction is proposed to be 0.25 for avoiding the occurrence of cracking.
ACKNOWLEDGMENTS
The authors would like to thank the funding support of The National High-Tech Research and Development Program of China, Grant no. 2012AA03A514, The Doctoral-Independent Exploration and Innovation of Central South University, Grant no. 2015zzts031 and the outstanding graduate project of Advanced Non-ferrous Metal Structural Materials and Manufacturing Collaborative Innovation Center. The authors, Liu Feng and Huang Lan, would like to thank The Natural Science Foundation of China for their financial support under Grant nos 51401242, and 51301209, and The Postdoctoral Science Foundation of Central South University for their grant no. 74341016096. Special thanks to JIANG Hong for polishing the manuscript very carefully.