More than 14 million yak are living in the Qinghai-Tibetan plateau, whose milk contribute 80% of gross milk production in this area (Wiener et al., 2006). The yak has adapted to thrive under these harsh conditions, where few others domestic animals could survive. The yak is a crucial resource supplying milk, meat, hair, and cheese to the local people in the Tibetan plateau area. For these reasons, the yak is one of the most critical domestic animals for 6.5 million Tibetan people (He and Li, Reference He, Li, JC, XD and ZH2004). Based on the fact that yak represent the primary source of milk for the people of this region, it is important to understand the gene expression pattern of yak mammary tissue.
Colostrum immunoglobulin G (IgG) is of major importance for the newborn calf because epitheliochorial placentae do not provide transfer of immunoglobulins utero. Calves are highly dependent on the first milk (colostrum), which contains the important immunoglobulins and a high content of proteins and fat (Weaver et al., Reference Weaver, Tyler, VanMetre, Hostetler and Barrington2000). Colostrum is secreted during a colostrogenesis stage. Compared to milk, colostrum has higher concentration of immunoglobulins, specifically immunoglobulin G1 (Dang et al., Reference Dang, Kapila, Purohit and Singh2009) as well as other plasma-derived and secreted proteins. Study of genes that are differentially expressed during this period has not been done, and was the objective of our research. We compared 1 d (ELS) and 15 d postpartum (MLS) to identify the specifically up-regulated genes through the construction of suppression subtractive hybridization (SSH) library. Thereafter the differentially expressed genes were verified by qRT-PCR during the entire lactation period.
Materials and methods
Mammary tissue collection
This study was approved by the Southwest University for Nationalities Institutional Animal Care and Use Committee (permit number: 2011-3-2). The yak mammary biopsy was performed in strict accordance with the animal operations guide to minimize animal suffering. Tissue samples of yak mammary gland were collected from 4 healthy female yaks (approximately 5 years old) in the northwest plateau of Sichuan province in China.
Percutaneous biopsies were obtained alternatively from the right or left rear quarter of the mammary gland at −15, 1, 15, 30, 60, 120, 240 d following a previously developed technique (Knight et al., Reference Knight, Hillerton, Teverson and Winter1992). Briefly, blunt dissection of the mammary capsule was performed to obtain mammary parenchyma after making the skin incision. The wound was closed with catgut sutures. The incision site was sprayed with topical antiseptic (Povidone Iodine Ointment, 10%; Taro Pharmaceuticals, China). A total of approx. 300 mg tissue sample was placed into a 5 ml tube and immediately frozen and stored in liquid nitrogen.
Extraction of total RNA and preparation of cDNA
Total RNA was extracted with ice-cold Trizol reagent (Invitrogen, USA) following the manufacturer's instruction. Each RNA sample was treated with DNase I (TaKaRa, Japan) and then dissolved in RNase-free water before storage at −80°C. The purity and concentration of RNA samples was detected by ultraviolet spectrophotometer. The 260/280 ratios of the extracted RNA samples were ≥1.9 and the integrity of the RNA samples was evaluated by 1% gel electrophoresis. Two expected bands at 18S and 28S without any evidence of degraded products was found in all RNA samples. Poly-(A) RNA was purified from total RNA using the Oligo-tex-dT mRNA Midi Kit (Qiagen, Germany). The double-stranded-cDNA of each sample was synthesized via PCR cDNA synthesis Kit (TaKaRa, Japan) according to the manufacturer's instruction.
Subtractive cDNA library construction
Suppression subtractive hybridization was performed using the PCR-selected cDNA Subtraction Kit (TaKaRa, Japan) according to the manufacturer's instruction. The forward-subtraction starting material consisted of 0.5 μg of mRNA from 1 d as the tester and 0.5 μg mRNA from 15 d as the driver. All PCR products generated from forward- and reverse-subtraction were directly ligated into a pMD18-T vector (TaKaRa, Japan), and then transformed into E. coli strain JM109. Transformed E. coli were plated on Luria-Bertani-Ampicillin media. Recombinant clones were kept in Luria-Bertani broth containing 15% glycerol and 100 μg/ml ampicillin (TaKaRa, Japan). The synthesized cDNA ranged approximately from 250 to 4500 bp before Rsa I digestion and 100 to 1000 bp after digestion in gel electrophoresis. Subtractive PCR products at ELS were subsequently obtained using the SSH method.
DNA sequence analysis for the identification of gene annotation
Fifty-six clones were randomly selected from the Subtractive cDNA Library and sequenced. The expressed sequence tags (ESTs) at ELS were identified by DNAMAN software (Lynnon Corporation) and the redundancy sequences were discarded. All the identified sequences were compared with the Cow (Bos taurus) Genome Browser Gateway (http://genome.ucsc.edu) using the BLAT algorithm (Kent, Reference Kent2002) and annotated.
qRT-PCR
Twenty-one genes were selected to detect the expression level during the lactation cycle by qRT-PCR (online Supplementary File Table S1). The cDNA was synthesized from 600 ng of total RNA using a cDNA synthesis Kit (TaKaRa, Japan). The qRT-PCR was performed using the following reaction mixture: 5 μl SsoFast EvaGreen supermix (BIO-RAD, USA), 2 μl cDNA template, 2 μl ddH2O and 0.5 μl 10 μm of each forward and reverse primer (online Supplementary File Table S1) and the reaction was performed at 95°C for 5 min (initial denaturation) and followed by 40 cycles of at 95°C for 15 s and at 58.0°C for 30 s (amplification) in a BIO-RAD CFX96™ Real-Time System (BIO-RAD, USA). The no template control and samples were run in triplicate. Normalization was performed using 3 internal control genes (mitochondrial ribosomal protein S15, ribosomal protein S23 and ubiquitously expressed transcript isoform 2) previously determined to provide a reliable normalization (Jiang et al., Reference Jiang, Lee, Bionaz, Deng and Wang2016).
Data processing and statistical analysis were conducted as described by Bionaz and Loor (Bionaz and Loor, Reference Bionaz and Loor2008). Briefly, normalized qRT-PCR data are presented as n-fold change relative to −15 d before parturition. The fixed effect in the model was time (−15, 1, 15, 30, 60, 120, and 240 d) and the random effect was yak.
Statistical analysis of qPCR data
All PCR data were normalized using 3 the internal control genes (before statistical analysis; Jiang et al., Reference Jiang, Lee, Bionaz, Deng and Wang2016). Data processing and statistical analysis were conducted as described by Bionaz and Loor (Bionaz and Loor, Reference Bionaz and Loor2008). Briefly, normalized qRT-PCR data normalized data were transformed to obtain a perfect average of 1.0 at −15 d. The same proportional change was calculated at the remaining time points and is presented as n-fold change relative to −15 d before parturition. All data were log 2 transformed before statistical analysis and then analyzed using the Proc MIXED of SAS with repeated measures (v 9.4, SAS Institute Inc., Cary, USA) to evaluate the effect of time. Compound symmetry was used for analysis. The fixed effect in the model was time (−15, 1, 15, 30, 60, 120, and 240 d) relative to parturition and the random effect was caused by individual yak. The data was mentioned only if an overall time effect (P ≤ 0.05) was present. Comparison between time points was declared significant at P < 0.05.
Functional enrichment and gene network analysis
David version 6.7 (https://david.ncifcrf.gov/) was used to perform functional annotations of biological processes affected by differentially expressed genes list between ELS and MLS. Gene network pathways were evaluated using Ingenuity Pathway Analysis (IPA, Ingenuity, USA). This is a web-based application that enables the discovery, visualization, and exploration of interaction networks. The software relies on currently known relationships (i.e., published manuscripts) among human, mouse, and rat genes or proteins.
Results and discussion
Suppression subtractive hybridization results for the identification of genes which are primarily expressed at ELS in comparison to MLS
Two main subtractive PCR products l-amino acid oxidase I (LAO1) and collagen, type I, alpha I (COL1A1) at ELS were discovered in gel electrophoresis (Fig. 1). LAO1, which has never been cloned in ruminant animals, increased from −15 to 1 d in yak mammary tissue and peaked at ELS in this study (Fig. 2a). The proteins designated LAO1 and LAO2 have potent antibacterial properties associated with l-amino acid oxidase activity in snake (Stiles et al., Reference Stiles, Sexton and Weinstein1991). Therefore, the early lactation stage probably has better antibacterial properties than mature lactation stage. LAO produced H2O2 through the oxidation of sufficient free amino acids in mouse mammary tissue and the H2O2 is the active component of the antibacterial system (Green et al., Reference Green, Nocito and Ratner1944; Klebanoff et al., Reference Klebanoff, Clem and Luebke1966). Colostrum protects newborn calves from pathogens because it contains immunoglobulins (Barrington et al., Reference Barrington, Mcfadden, Huyler and Besser2001). In addition, LAO expressed in mouse milk (Sun et al., Reference Sun, Nonobe, Kobayashi, Kuraishi, Aoki, Yamamoto and Sakai2002) may also play an important role protecting the newborn. In our study, LAO1 sharply decreased during 1 to 15 d in yak mammary tissue and maintained a low expression level after 15 d. Previous research (Nagaoka et al., Reference Nagaoka, Zhang, Arakuni, Taya and Watanabe2014) suggested that mammary gland in dairy cows expressed low level of the LAO compared with that in mice, which may results in a high risk of mastitis.
Subtractive PCR products at early lactation stage. Notes: Lanes 1 and 2: 2nd PCR product; lane 3: 1st PCR product; lane M: marker.

Expression pattern of 21 identified genes.

COL1A1 is one of the main components of the extracellular matrix of mammary tissue and is believed to be involved in growth, migration, morphology, proliferation, differentiation, and biosynthetic activities (Noel and Foidart, Reference Noel and Foidart1998). Dhorne-Pollet et al. (Reference Dhorne-Pollet, Robert-Granié, Aurel and Marie-Etancelin2012) found that the expression of COL1A1 remains low in low-milk flow ewes. This observation suggested that milking ability in ewes potentially depends on the capacity of the teat sphincter to relax during mechanical milking. In our study, the high expression of COL1A1 in yak mammary gland during ELS implied the enhancement of mammary gland activities that prepare for lactation (Fig. 2b).
DNA sequence analysis for the identification of gene annotation
After multiple alignments, 25 unique ESTs were identified from the 56 clones (Table 1). Six genes among the 25 ESTs related to milk fat metabolism were as follows: fatty acid synthase (FASN), butyrophilin subfamily 1 member A1 (BTN1A1), glycerol phosphate acyltransferase (GPAM), fatty acid binding protein 3 (FABP3), xanthine oxidoreductase (XDH) and glycosylation-dependent cell adhesion molecule 1 (GLYCAM1). Three genes related to casein synthesis from the 25 ESTs were as follows: casein alpha s1 (CSN1S1), casein beta (CSN2) and casein kappa (CSN3). Both the identity of ribosomal protein S8 (RPS8) and COL1A1 were up to 100%. Protein kinase C and casein kinase substrate in neurons 2 (PACSIN2) and v-myc myelocytomatosis viral oncogene homolog (MYC) have a lower identity than others. The annotation of all genes was listed in Table 1.
Expressed sequence tags (ESTs) expressed at lactation stage and mapped to the bovine genome in GenBank

EST, expressed sequence tags.
mRNA expression pattern analysis of selected gene
9 genes were confirmed increased at ELS compared with MLS (Fig. 3). LAO1, COL1A1, protein tyrosine kinase 2 beta (PTK2B), creb regulated transcription coactivator 1 (CRTC1) and RPS8 were increased by 18.77, 3.87, 2.86, 2.84, and 1.92-fold, respectively. LAO1 and COL1A1 were the most significantly increased genes measured, which was consistent with the result from SSH. Prosaposin (PSAP) was also expressed consistently at both ELS and MLS (online Supplementary File Table S2). In contrast, the other 11 genes decreased at ELS compared with MLS. CSN1S1, GLYCAM1, CSN3, FABP3, and CSN2 decreased by 3.2, 2.3, 1.9, 1.9, and 1.6-fold, respectively (online Supplementary File Table S2).
Nine significantly up-regulated genes (X-axis) at early lactation stage relative to mature lactation stage.

mRNA expression of milk fat and casein related genes during the lactation cycle
In general (and as expected), the expression of genes related to milk fat and casein synthesis increased during −15 to 120 d (Fig. 2e). Then, these genes sharply decreased after 120 d. The six genes related to milk fat, i.e., BTN1A1, GPAM, FABP3, FASN, GLYCAM1, and XDH, increased to the highest expression during the lactation. Their expression had a larger increase during −15 to 1 d and keenly decreased after 120 d (Fig. 2c, d).
FASN and GPAM are two enzymes encoding genes playing a central role in de novo lipogenesis and esterification. Both are putative candidate genes for quantitative trait loci (QTL) affecting milk production (Roy et al., Reference Roy, Zaragoza, Rodellar, Gautier and Eggen2005). FABP3 in bovine mammary tissue is central for intracellular fatty acid trafficking and is up-regulated during the transition from the non-lactating period, and the maximum expression level appeared at 60 d post-partum (Bionaz and Loor, Reference Bionaz and Loor2008). In our study, the expression of FABP3 reached the peak at 15 d in yak mammary tissue. BTN1A1 is an acidic glycoprotein that expresses on the apical surface of secretory cells in lactating mammary tissue, which functions in the formation of milk fat droplets when milk secretion is activated (Jack and Mather, Reference Jack and Mather1990). XDH and BTN1A1 interact with each other at the protein level and are essential for lipid droplet formation and secretion (Jack and Mather, Reference Jack and Mather1990). In our study, the highest expression of XDH appeared at 30 and 120 d in yak mammary tissue. However, in Holstein dairy cows, XDH reached the peak at 60 d (Bionaz and Loor, Reference Bionaz and Loor2008). In summary, the peak of FABP3 and XDH in yak mammary tissue were reached earlier than that in Holstein dairy cows. This may be related to the length of gestation and lactation periods in yak. The length of yak lactation is shorter than the cows (Wiener et al., 2006).
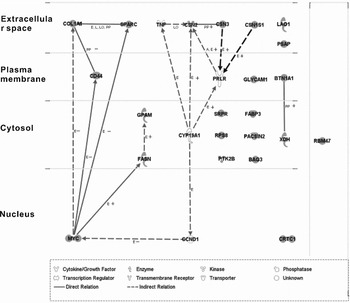
Casein genes, i.e., CSN1S1, CSN2, and CSN3, sharply increased during −15 to 30 d in the yak (Fig. 2e). Casein comprises the major protein fraction of cow milk (approximately 80%) and is associated with the casein micelle (Sazanov et al., Reference Sazanov, Malewski, Kamiński and Zwierzchowski2006). Casein synthesis in lactating mammary gland is regulated by different pathways and involves a complex set of lactogenic hormones, such as PRL and GH (Travers et al., Reference Travers, Barber, Tonner, Quarrie, Wilde and Flint1996). In addition, IPA analysis revealed that PRLR as well as CYP19A1 play roles in the up-regulation of casein gene expression (Akers, Reference Akers2006) (Fig. 5).
Functional enrichment and gene network analysis of selected genes
Top enriched Gene Ontology (GO) analysis term and ratio are shown in Table 2 and Fig. 4 respectively with three or more genes that were significantly enriched (P < 0.01); these genes were primarily involved in organ or mammary gland development (56%), lactation (13%), secretion (13%) and response to chemical stimuli (9%). The result of network analysis of the 21 differentially-expressed genes in our experiment are depicted in Fig. 5. We observed evidence of potential co-regulation among the investigated genes, perhaps stemming from MYC. In previous studies, the expression of MYC decreases between the non-lactating period and the onset of lactation in humans (Grolli et al., Reference Grolli, Accornero, Ramoni, Donofrio and Whitelaw1997) and bovine mammary tissue (Bionaz and Loor, Reference Bionaz and Loor2007). Strange et al. (Reference Strange, Li, Saurer, Burkhardt and Friis1992) reported that MYC was expressed in pregnant mouse mammary gland and then decreased to undetectable levels in lactating mammary gland, which is consistent with our results. MYC were found directly or indirectly interacting with COL1A1, CD44, and SPARC in the present study using the IPA analysis (Fig. 5). Modulation of cell surface proteins (CD44) has been implicated in the progression of mammary development (Hebbard et al., Reference Hebbard, Steffen, Zawadzki, Fieber, Howells, Moll, Ponta, Hofmann and Sleeman2000). CD44 is down-regulated as non-ruminant mammary epithelial cells differentiate into milk-producing alveolar cells (Hebbard et al., Reference Hebbard, Steffen, Zawadzki, Fieber, Howells, Moll, Ponta, Hofmann and Sleeman2000). Furthermore, CD44 takes part in the remodeling of the duct epithelium after lactation. In our study, the expression of CD44 decreased during −15 to 1 d. It seems that CD44 is down-regulated when mammary epithelial cells formed alveolar structures (Fig. 2).
Functional enrichment ratio of the genes potentially associated with in yak mammary tissue during the early lactation stage.

Gene network pathways of the genes potentially associated with in yak mammary tissue during the early lactation stage. Notes: Interactions and cellular location of genes differentially-expressed at ELS relative to MLS. Networks were developed with Ingenuity Pathway Analysis (Ingenuity Systems, Inc.). Solid lines denote direct interactions and dotted lines denote indirect interactions between genes. Edge labels denote Activation/deactivation (A), effects on gene expression (E), protein–protein interactions (PP), and effect on LO. Arrows denote the direction of the effect. Symbols denote positive activation (−) or inhibition (+). To clarify the relationships among casein genes we included known relationships with PRLR and CYP19A1.

Functional classification of the genes potentially associated with in Yak mammary tissue during the early lactation stage

Hasselaar and Sage (Reference Hasselaar and Sage1992) showed that the function of SPARC including the regulation of cell adhesion/proliferation, cell morphology, cell cycle and synthesis/assembly of ECM. Gene network analysis revealed that MYC directly regulates the expression of CD44, SPARC and indirectly regulates the expression of COL1A1. To be specific, expression of CD44, SPARC, and COL1A1 was repressed by MYC in rat c-myc-null cells (O'Connell et al., Reference O'Connell, Cheung, Simkevich, Tam, Ren, Mateyak and Sedivy2003). Up-regulation of CD44 was associated with the down-regulation of COL1A1 in a sub-line of mouse NIH3T3 fibroblast (Rompaey et al., Reference Rompaey, Dou, Buijs and Grosveld1999). Of course, the IPA analysis software is not built for cattle and yak, so we can only identify potential interactions.
In conclusion, we compared ELS and MLS in yak mammary gland and identified that the expression level of LAO1 and COL1A1 were significantly increased. Besides, during the lactation, the highest expression of FABP3 and XDH in yak mammary tissue appears earlier than those in dairy cows. These results will be helpful for further research related to yak mammary gland and its milk production.
Supplementary material
The supplementary material for this article can be found at https://doi.org/10.1017/S0022029919001006.
Acknowledgements
Financial support was provided by a grant from ‘The National Natural Science Foundation of China (31172198)’ and ‘Sichuan Youth Science & Technology foundation (09ZQ026-011)’. Key Science & Technology Projects of Ministry of Education (210265) and The Construction Project of Postgraduate Academic Degree in Southwest University for Nationalities (2011XWD-S071007) and Young Scientists Fund of the National Natural Science Foundation of China (31900586).