Why did Barack Obama win the presidential election of 2008? Many factors contributed to this result. One factor, which has received much attention, was the large number of new voters that his campaign brought to the polls. On the day after the election, for example, a front-page story on the Wall Street Journal reported:
Sen. Barack Obama was elected the nation's first African-American president, defeating Sen. John McCain decisively Tuesday as citizens surged to the polls in a presidential race that climaxed amid the worst financial crisis since the Great Depression…. In total, voter registration numbers were up 7.3% compared with the last presidential election, for a total of 153 million eligible voters.
(Weisman and Meckler Reference Weisman and Meckler2008)Similar stories were told by media outlets across the world. Indeed, a central part of the media's fascination with the Obama campaign was its ability to energize new voters.
Over 69 million Americans cast votes for Obama in the November election. This number is over 10 million more than the number who voted for fellow Democrat John Kerry four years earlier. Obama's success in attracting new voters was a visible component of his 2008 victory. But did these new voters cause Obama to win the election? If the answer to this question seems obvious, consider a simple counterfactual: suppose that the Obama campaign lured no new voters to the polls in November 2008.
Specifically, suppose that in 2008, Barack Obama earned the same number of votes that Kerry received in 2004, but not a single vote more. Suppose, moreover, that all of these votes originated from the state in which they were originally cast. At the same time, suppose that John McCain retained all of the votes that he earned in the 2008 general election. Who would be president?
In this scenario, McCain would have won the popular vote by over 850,000 votes, but Obama would still be the forty-fourth president. Figure 1 and table 1 show why. Dark-hued (blue) states are those states won by the Democratic candidate in 2004 and in the alternate version of the 2008 election described previously. Medium-hued (red) states are those states won by the Republican candidate in both 2004 and in the alternate version of the 2008 election described previously. The lightest hued states are those won by Bush in 2004 and by Obama in the alternate version of the 2008 election.
Electoral Vote Allotment, by State
Note: See table 1 for further statistical information. Dark-hued (blue) states are states for which ObamaK04′ > max(Bush04, McCain08). Medium-hued (red) states are states for which min(Bush04, McCain08) > ObamaK04′. Light-hued states are states for which Bush04 > ObamaK04′ > McCain08. Figure created by Ramy S. Farid.

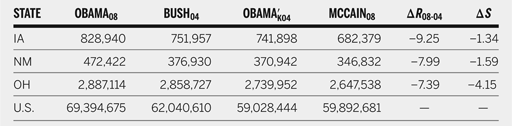
Voting Statistics for Key States

Note: ObamaK04′ is the number of Obama votes if Obama receives only Kerry's votes from 2004. Bush04, McCain08, and Obama08 are votes earned by the respective candidates in the years referenced by the subscripts. ΔR08-04 is the minimum possible percentage of Bush voters who failed to support McCain, given aggregate election statistics. ΔS is the percentage of such defections that would be sufficient for an Obama victory.
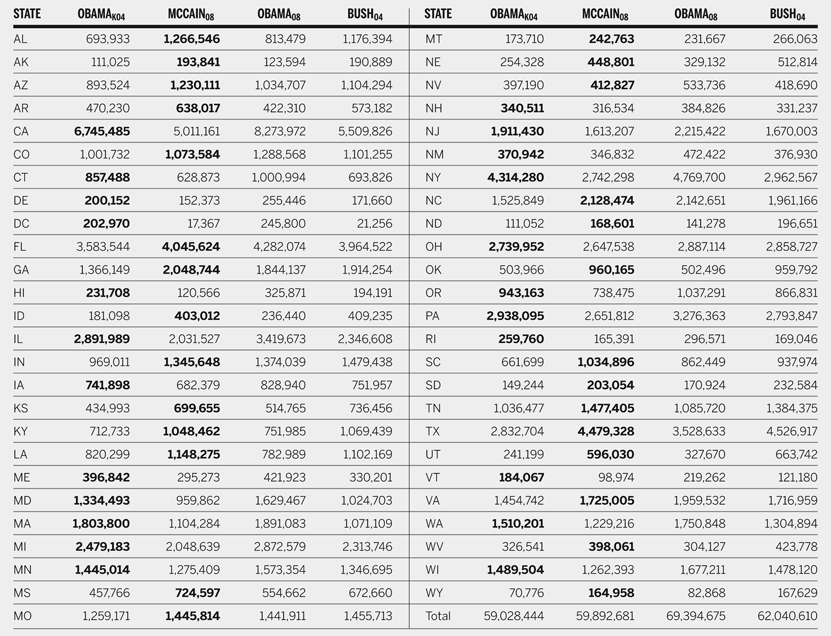
Figure 1 and table 1 reveal that if Obama in 2008 had not earned a single vote more in any state than Kerry did in 2004, Obama would have won the Electoral College vote by a margin of 284 to 254. Obama would have won all of the states that Kerry won in 2004, plus Iowa, New Mexico, and Ohio. Table 2 contains all details relevant to this calculation.
State-by-State Election Results for 2004 and 2008

Note: ObamaK04′ is the number of Obama votes if Obama receives only Kerry's votes from 2004. Bush04, McCain08, and Obama08 are votes earned by the candidates in the years referenced. Bold numbers represent the winner of a hypothetical contest between ObamaK04′ and McCain08. 2004 totals are from final official records. 2008 totals are from current official records as of May 2009. Some states may further revise their final 2008 numbers by small amounts, but such changes will not be large enough affect the claims in this article. In 2008, Nebraska awarded two of its electoral votes to McCain and one to Obama based on a calculation of popular votes by Electoral College district. In my comparison, McCain wins all three districts, so district level numbers are suppressed.
If this result comes as a surprise, it is worth remembering that although Bush scored a substantial Electoral College victory in 2004 (286 to 251) and won the 2004 popular vote by more than three million votes, his actual margin of victory was much smaller. As table 1 shows, Bush won by very small margins in several states. Therefore, if slightly more than four out of every hundred people who voted for Bush in the state of Ohio in 2004 either voted for Obama or stayed home on Election Day in 2008 (this statistic is labeled ΔS), and if all other voters across the country voted for a candidate of the same party in 2008 as they did in 2004, Obama would still have been elected the nation's forty-fourth president.
But how many Bush 2004 voters failed to vote for McCain in 2008? Although the secret ballot prevents us from ever knowing for certain, we can use state-level election returns to determine the minimum number of such voters. As table 1 shows, a minimum of seven out of every hundred Bush voters in Ohio in 2004 (labeled ΔR 08-04) must have done something other than vote for McCain in 2008. These defections from the GOP candidate were sufficiently large to allow Obama to win Ohio (i.e., |ΔR 08-04| > |ΔS|) in the scenario described previously. Winning Ohio, in turn, was sufficient for Obama to win the Electoral College. Therefore, Bush voters' decisions in Ohio were sufficient to cause Obama to win the election.
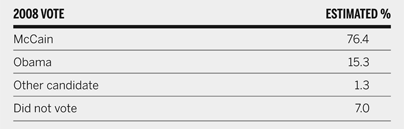
Estimates of individual-level voting behavior from survey data reinforce the role that Bush voters played in Obama's victory. The 2008 edition of the American National Election Studies Time Series (American National Election Studies 2008) asked over two thousand respondents to report whether and for whom they voted in the general elections of 2004 and 2008. Table 3 summarizes the result of this inquiry.Footnote 1 Nearly one in four respondents who self-identified as 2004 Bush voters did something other than vote for McCain in 2008. Fifteen percent of these Bush voters voted for Obama in 2008. Another 7% chose not to vote at all. This estimated national 23.6% rate of 2004 Bush voter defections is far greater than the percentage of defections that Obama needed to win Iowa, New Mexico, and Ohio (if he were otherwise able to retain Kerry's 2004 voters).Footnote 2
Estimated Election Day 2008 Actions of Respondents Who Reported Voting for Bush in 2004

Barack Obama's success in bringing millions of new voters to the polls was an impressive achievement. But these new voters were not a necessary condition for his victory. When considering whether or not to support John McCain in 2008, a number of Bush voters decided, “No We Can't.” The number of 2004 Bush voters who decided to stay at home, or to support a Democrat, in 2008 did not grab the same kinds of headlines as new voter stories, but they were a sufficient condition for Obama's Electoral College victory. Hence, future presidential hopefuls' attempts to draw lessons from the 2008 campaign should focus not only on how the Obama campaign got so many new people to the polls, but also on why so many people who voted for a Republican presidential candidate in 2004 chose to do something different in 2008. If 2008's new voters are less energized in 2012, the story of that election may turn on whether voters who once supported a Republican can be convinced to do so again.