1. Introduction
The dispersive shock wave (DSW) is a phenomenon that occurs in media where dispersion counteracts the effect of nonlinearity. This phenomenon is often observed in various physical contexts, such as fluids (Grimshaw, Zhang & Chow Reference Grimshaw, Zhang and Chow2007), optical fibres (Fatome et al. Reference Fatome, Finot, Millot, Armaroli and Trillo2014) and plasmas (Ruderman, Talipova & Pelinovsky Reference Ruderman, Talipova and Pelinovsky2008). Unlike classic shock waves, which are primarily governed by nonlinearity leading to abrupt changes or discontinuities (such as a sonic boom), DSWs involve a balance between nonlinearity and dispersion. The dispersive regularisation acts to ‘spread out’ the spatial scales over multiple wavelengths, preventing the formation of sharp discontinuities, and instead causing the appearance of fast oscillations in an expanding region (fan), facilitating a smooth transition from one state of the medium to another.
In the context of free-surface flow, the study of DSWs originates from the modulation instability of periodic gravity waves. As demonstrated by Luke (Reference Luke1967), the Lagrangian of the free-surface water-wave problem is equivalent to the vertical integration of pressure. Building on this, Whitham (Reference Whitham1967) applied the averaged variational principle within Luke’s Lagrangian framework to prove that periodic gravity waves become modulationally unstable when
 $kh_0\gt 1.36$
, where
 $k$
is the wavenumber, and
 $h_0$
is the mean depth of the fluid. This criterion was also confirmed through spectral analysis and experiments conducted by Benjamin & Feir (Reference Benjamin and Feir1967), as well as through the nonlinear Schrödinger equation by Hasimoto & Ono (Reference Hasimoto and Ono1972). Consequently, the averaged variational principle used to describe the modulation of nonlinear wavetrains in various contexts is commonly known as the Whitham modulation theory, acknowledging Whitham’s significant contributions. Gurevich & Pitayevski (Reference Gurevich and Pitayevski1974) developed a comprehensive theoretical framework based on Whitham’s theory for understanding the formation and evolution of waves with smoothing step initial data. Their work provides a theoretical prediction regarding wave evolution in the Korteweg–de Vries (KdV) equation, offering a detailed quantitative description of typical DSW structures. Then the Gurevich–Pitaevskii problem examines how a step-like initial profile evolves over time in specific equations, serving as a crucial foundation for understanding the behaviours of DSWs and wave dynamics under various initial conditions. Moreover, the modulation theory and structures of DSWs were extensively studied and applied to various nonlinear dispersive partial differential equations (PDEs), such as the nonlinear Schrödinger equation (Pavlov Reference Pavlov1987), the Benjamin–Ono equation (Jorge, Minzoni & Smyth Reference Jorge, Minzoni and Smyth1999) and the cylindrical KdV equation (Ablowitz, Demirci & Ma Reference Ablowitz, Demirci and Ma2016). It is becoming increasingly clear that deriving modulation equations based on the averaged variational principle to describe the DSW structure presents significant challenges, including the necessity for an exact, explicit travelling-wave solution to the original equation, the complexity involved in the derivation process, and the lack of Riemann invariants in the resulting modulation equations. To address these challenges, El (Reference El2005) concentrated on simplified scenarios of modulation equations at the solitary-wave and harmonic-wave edges (precise definitions will be provided later), proposing the DSW fitting method to describe edge velocities and estimate the approximate range of evolution for DSWs. The DSW fitting method serves as a powerful and efficient tool for understanding the intricate dynamics of DSWs in nonlinear dispersive systems, and has been widely applied in studies of viscous fluid conduits (Lowman & Hoefer Reference Lowman and Hoefer2013; Maiden et al. Reference Maiden, Franco, Webb, El and Hoefer2020), undular bores (El, Grimshaw & Smyth Reference El, Grimshaw and Smyth2006; Grimshaw et al. Reference Grimshaw, Zhang and Chow2007) and nonlinear optics (El et al. Reference El, Gammal, Khamis, Kraenkel and Kamchatnov2007), among others.
In addition to theoretical and numerical studies, experimental and observational investigations on DSWs are also significant. Hammack (Reference Hammack1973) conducted experiments in a water flume by vertically adjusting the local bottom topography, successfully inducing structures resembling undular bores. He used linear theory to approximate the water surface, highlighting the critical role of dispersion in the long-term evolution of the waveform. Chanson (Reference Chanson2009, Reference Chanson2010) observed undular bore structures in the laboratory by employing a fast-closing gate to change flow conditions. Lowman & Hoefer (Reference Lowman and Hoefer2013) theoretically demonstrated that DSWs could emerge in a fluid driven by viscous forces. Furthermore, Maiden et al. (Reference Maiden, Lowman, Anderson, Schubert and Hoefer2016) injected a lighter, viscous fluid from below into a column filled with a higher-viscosity liquid, observing the formation of DSWs at the interface between the two fluids. Recently, Binswanger (Reference Binswanger2019) conducted a study on a shallow-water experiment that involved generating oblique DSWs in a steady shallow-water flow. In this experiment, DSWs were generated by directing a supercritical, steady, shallow-water flow past a slender, wedge-shaped obstacle. It was observed that a smaller deflection angle resulted in a classical or KdV-type DSW, while a larger deflection angle led to the development of a non-classical DSW.
Gravity-capillary waves occur at the surface of a fluid due to the combined effects of gravity and surface tension. This topic is complex and important, impacting various scientific fields and practical applications. Gravity-capillary waves are crucial for air–sea gas exchange, and play an essential role in global climate modelling. They affect the concentration boundary layer at the gas–liquid interface, which influences gas diffusion processes (Szeri Reference Szeri1997). Additionally, these waves are fundamental to microwave remote sensing, which helps us to gather information about the ocean surface. A refined model of the gravity-capillary wave spectrum can improve the accuracy of calculations related to microwave scattering and radiation, particularly under high-wind-speed conditions (Hwang et al. Reference Hwang, Burrage, Wang and Wesson2013). Moreover, gravity-capillary waves are important for studying nonlinear wave interactions and wave turbulence, providing a vital theoretical and experimental foundation for understanding small-scale dynamic processes in the ocean (Berhanu Reference Berhanu2022). Unlike pure gravity waves, which exhibit a monotonic ‘wavenumber–phase speed’ dispersion curve, gravity-capillary waves feature a global phase speed minimum at a non-zero wavenumber when the Bond number
 $B=\sigma /\rho gh^2$
(where
 $\sigma$
is the surface tension coefficient,
 $\rho$
is the fluid density, and
 $g$
is the acceleration due to gravity) is less than
 $1/3$
. For gravity-capillary waves propagating on a liquid of finite depth, Hunter & Vanden-Broeck (Reference Hunter and Vanden-Broeck1983) derived the fifth-order KdV equation, also referred to as the Kawahara equation, from the fully nonlinear Euler equations using the method of multiple scales. This reduced model indicates that a balance between the third- and fifth-order dispersive effects can be achieved when the Bond number is close to
 $1/3$
, and the Froude number, which is defined as the ratio of a characteristic speed to the speed of long waves, is close to unity. The behaviour of DSWs under the combined influence of gravity and surface tension presents an intriguing area of research. A series of pioneering studies by Sprenger & Hoefer (Reference Sprenger and Hoefer2017, Reference Sprenger and Hoefer2020) and Hoefer, Smyth & Sprenger (Reference Hoefer, Smyth and Sprenger2019) reveals that DSWs in the fifth-order KdV equation exhibit fundamentally different characteristics compared to the classical DSW structures. The solutions to the Gurevich–Pitaevskii problem display four distinct states as the initial step height increases: radiating DSW, crossover state, travelling DSW, and radiating DSW with inverse orientation. The parameters within these DSWs, including edge velocity, amplitude and wavenumber, were analysed using the DSW fitting method (Sprenger & Hoefer Reference Sprenger and Hoefer2017). The Whitham modulation system for the fifth-order KdV equation was derived based on the Stokes expansion solution (Hoefer et al. Reference Hoefer, Smyth and Sprenger2019). This system was then utilised to investigate the stability of periodic waves and to explain the generation of crossover DSWs. Sprenger & Hoefer (Reference Sprenger and Hoefer2020) calculated the heteroclinic travelling-wave solutions for the fifth-order KdV equation. Their work provides insights into the behaviour of periodic wavetrains in the travelling DSW regime, and enables predictions of modulation parameters (such as wave mean, amplitude and wavenumber) based on the shock-rarefaction solution of the Whitham modulation equations. Additionally, Binswanger et al. (Reference Binswanger, Hoefer, Lian and Sprenger2021) applied Whitham’s modulation theory to the Whitham equation, identifying the stability regions of periodic waves in the contexts of gravity-capillary, hydroelastic and internal waves.
The most striking phenomenon observed in the Gurevich–Pitaevskii problem of the fifth-order KdV equation is the emergence of partial, non-monotonic, depression solitary waves appearing at the trailing edge of DSWs for specific parameter values. This type of solitary wave, known as a wavepacket solitary wave, was first identified by Longuet-Higgins (Reference Longuet-Higgins1989) within the deep-water scenario governed by the full Euler equations, and has been extensively studied over the past few decades. When
 $B\lt 1/3$
, wavepacket gravity-capillary solitary waves featuring oscillatory decaying tails bifurcate from infinitesimal periodic waves at the minimum of the phase speed, where the group velocity equals the phase velocity. Akylas (Reference Akylas1993) elucidated that the envelopes of gravity-capillary solitary waves near the phase speed minimum can be well described by the stationary solutions of the cubic nonlinear Schrödinger equation. While the mechanism is well understood near the bifurcation point, there are solitary waves that exist only at finite amplitudes, meaning that they do not bifurcate from zero amplitude. One specific type of finite-amplitude solution arises from mode resonance in periodic waves, which is then subjected to a limiting process by sending the wavelength to ‘infinity’ (Dias Reference Dias1994). On these branches, the solution occasionally exhibits multiple crests/troughs of similar amplitude in the solitary pulse, as illustrated in figure 4.5 of Dias & Vanden-Broeck (Reference Dias and Vanden-Broeck1996). This phenomenon reminds us of travelling DSWs in the fifth-order KdV equation, where solitary waves with oscillatory pulses can be partially embedded within DSWs. However, the fifth-order KdV equation serves as a limited model for gravity-capillary waves, applicable only when the mean water depth is approximately 0.5 cm and for small-amplitude waves. Therefore, it is important to revisit solitary waves with oscillatory pulses in the full Euler equations, focusing specifically on their generation mechanism, which is likely linked to travelling DSWs.
The purpose of this study is threefold. First, the application of the Whitham modulation theory has predominantly been restricted to simplified models, as summarised in El & Hoefer (Reference El and Hoefer2016). Its application to the fully nonlinear Euler equations, while considering the effects of gravity and surface tension, remains barely explored. To the best of the authors’ knowledge, Easwaran (Reference Easwaran1986) is the only existing work that applies the modulation theory to the stability of gravity-capillary periodic waves. Second, based on the four distinct states observed in the fifth-order KdV equation, as detailed in Sprenger & Hoefer (Reference Sprenger and Hoefer2017), one may question whether similar states can occur in the full Euler equations. Finally, while solitary waves with oscillatory pulses have been identified in the fifth-order KdV equation (Sprenger & Hoefer Reference Sprenger and Hoefer2020), their presence in the full Euler equations, while previously noted, has yet to be connected to the dynamical process of DSWs. The bifurcation and numerical stability of this type of solitary wave also deserve a thorough investigation.
The rest of this paper is structured as follows. Section 2 offers a brief overview of the application of the averaged variational principle to the full Euler equations that govern free-surface water waves. This analysis takes into account the effects of both gravity and surface tension, leading to the derivation of the Whitham modulation system. Section 3 introduces the numerical methods employed to simulate DSWs and to compute travelling-wave solutions based on the time-dependent conformal mapping technique. Section 4 presents numerical results that include the classification of DSWs, edge velocities, comparisons between solitary waves and DSWs, as well as modulation parameters in travelling DSWs. Section 5 discusses the bifurcation and stability of solitary waves with oscillatory pulses. Finally, concluding remarks are provided in § 6.
2. Formulation
2.1. Variational formulation for gravity-capillary waves
We introduce the Cartesian coordinate system, where
 $x$
is the horizontal coordinate, and
 $y$
denotes the vertical direction, with
 $y=0$
corresponding to the undisturbed free surface. We consider a two-dimensional, inviscid and incompressible fluid of finite depth
 $h_0$
that flows irrotationally. In this case, the velocity field of the fluid can be expressed as the gradient of a potential function
 $\phi (x,y,t)$
, where
 $t$
represents time. According to Luke (Reference Luke1967), the free-surface water-wave system follows completely from minimising the action
 $\iint L\,{\rm d}x\,{\rm d}t$
with the Lagrangian
 \begin{align} L=\int _{-h_0}^{\eta }\left (\phi _t+\frac 12\phi _x^2+\frac 12\phi _y^2+gy\right ){\rm d}y+\frac {\sigma }{\rho }\left (\sqrt {1+\eta _x^2}-1\right )\!, \end{align}
where
 $y=\eta (x,t)$
is the free-surface displacement,
 $\sigma$
is the surface tension coefficient,
 $\rho$
is the fluid density, and
 $g$
is the acceleration due to gravity. Perturbing the Lagrangian action by
 $\delta \phi$
yields
 \begin{align} \begin{aligned} \phi _{xx}+\phi _{yy}=0\quad &\text{for}\ {-h_0}\lt y\lt \eta ,\\ \eta _t+\eta _x \phi _x-\phi _y=0\quad &\text{at}\ y=\eta ,\\ \phi _y=0\quad &\text{at}\ y=-h_0. \end{aligned} \end{align}
On the other hand, taking the variational derivative with respect to
 $\eta$
gives
 \begin{align} \phi _t+\frac 12\big (\phi _x^2+\phi _y^2\big )+g\eta -\frac {\sigma }{\rho }\partial _x\left (\frac {\eta _x}{\sqrt {1+\eta _x^2}} \right )=0\quad \text{at}\ y=\eta . \end{align}
The governing equation and boundary conditions in (2.2) and (2.3) constitute a complete system for the two-dimensional free-surface water-wave problem, with gravity and surface tension as the restoring forces. For ease of notation, we define
 $\tau =\sigma /\rho$
as the ratio of the surface tension coefficient to fluid density in the subsequent analyses. We introduce two important dimensionless numbers: the (inverse) Bond number
 $B$
, and the Froude number
 $ \textit{Fr} $
. These parameters will be referenced throughout the remainder of this work. They are defined as
 \begin{align} B=\frac {\tau }{gh_0^2},\quad \textit{Fr} = \frac {c}{\sqrt {gh_0}}, \end{align}
where
 $c$
represents the wave speed.
2.2. The averaged variational principle for periodic waves
The Whitham modulation theory provides a powerful analytic tool for investigating slowly varying periodic wavetrains (Whitham Reference Whitham1967, Reference Whitham1999). It can be derived generically by averaging dispersive hydrodynamic conservation laws for nonlinear periodic travelling waves to generate first-order dispersionless PDEs of hyperbolic or elliptic type. The averaged Lagrangian approach is standard, and its application to gravity-capillary waves can be partly found in Easwaran (Reference Easwaran1986). For the completeness of the paper, we briefly describe the derivation of the Whitham modulation equations. Interested readers are referred to Whitham (Reference Whitham1967) and Easwaran (Reference Easwaran1986) for more details.
The essence of the averaged Lagrangian approach is that the amplitude, frequency or wavenumber of modulated waveforms varies on a scale that is significantly larger than the wavelength of the oscillations. Therefore, by averaging over the rapid oscillations, we can derive governing equations for the slowly varying parameters. The most general form for a periodic wavetrain can be expressed as
 \begin{align} \phi =\psi +\varPhi (\theta ,y),\quad \eta =N(\theta ), \end{align}
where
 $\varPhi$
and
 $N$
are periodic functions of
 $\theta$
. In this context,
 $\theta$
and
 $\psi$
are the fast phases that satisfy
 \begin{align} \theta _x=k,\quad \theta _t=-\omega ,\quad \psi _x=\beta ,\quad \psi _t=-\gamma , \end{align}
where
 $k$
,
 $\omega$
,
 $\beta$
and
 $\gamma$
are slowly varying quantities. Specifically,
 $k$
represents the wavenumber,
 $\omega$
indicates the frequency,
 $\beta$
denotes the mean horizontal velocity, and
 $\gamma$
relates to absorbing the Bernoulli constant into the potential. It follows immediately that
 \begin{align} \frac {\partial k}{\partial t}+\frac {\partial \omega }{\partial x}=0,\quad \frac {\partial \beta }{\partial t}+\frac {\partial \gamma }{\partial x}=0. \end{align}
In the expression of the wave profile
 $N$
, two additional parameters must be specifically considered: the mean amplitude of the wave,
 $a$
, and the mean height,
 $b$
, defined respectively as
 \begin{align} a=\frac {1}{\pi }\int _0^{2\pi }N(\theta )\cos (\theta )\,{\rm d}\theta ,\quad b=\frac {1}{2\pi }\int _0^{2\pi }N(\theta )\,{\rm d}\theta . \end{align}
The Stokes expansion for a uniform wavetrain is expressed in powers of
 $ka$
. While the series is not uniformly valid as
 $kh_0\rightarrow 0$
,
 $ka$
must remain small compared to
 $(k h_0)^3$
in that limit. This expansion is derived from the Fourier series
 \begin{align} \begin{aligned} &N(\theta )=b+a\cos \theta +\sum _{n=2}^{\infty }a_n\cos (n \theta ),\\&\varPhi (\theta ,y)=\sum _{n=1}^{\infty }\frac {A_n}{n}\cosh \left (nk(h_0+y)\right )\sin (n\theta ). \end{aligned} \end{align}
Under the short-wave assumption, it requires that
 $ka_n$
and
 $kA_n$
are
 $O(\epsilon ^n)$
, with
 $\epsilon$
representing a typical value of
 $ka$
.
The quantities
 $k$
,
 $\omega$
,
 $\beta$
,
 $\gamma$
,
 $a$
,
 $b$
,
 $a_n$
and
 $A_n$
are all considered to be slowly varying functions of space and time, and the relations among these quantities can be derived from an averaged form of the variational principle. The general approach involves replacing the averaged Lagrangian over one wavelength in (2.1), then using the variational principle to derive the modulation equations, namely
 \begin{align} 0=\delta \int _{t_1}^{t_2}\int _{-\infty }^{\infty }\mathscr{L}\,{\rm d}x\,{\rm d}t,\quad \text{with}\ \mathscr{L} = \frac {1}{2\pi }\int _0^{2\pi }L\,{\rm d}\theta . \end{align}
The variations with respect to
 $A_1$
and
 $A_2$
,
 $\mathscr{L}_{A_1}=\mathscr{L}_{A_2}=0$
, provide expressions for
 $A_1$
and
 $A_2$
in terms of other unknown quantities, while the variation with respect to
 $a_2$
yields the relation between
 $a_2$
and
 $a$
. Therefore, we can rewrite the average Lagrangian expression, valid up to
 $O(\epsilon ^4)$
, as
 \begin{align} \mathscr{L}=\left (\frac {1}{2}\beta ^2-\gamma \right )h+\frac {g}{2}b^2+\frac {E}{2}\left [1-\frac {(\omega -\beta k)^2}{kT \! \left(g+\tau k^2 \right)}\right ]+\frac {E^2k^2D_0}{2 \!\left (g+\tau k^2\right )}+O(\epsilon ^6), \end{align}
where
 \begin{gather} h=h_0+b,\quad E=\frac {1}{2}\big(g+\tau k^2 \big)a^2,\quad T=\tanh (k h),\quad T_0=\tanh (k h_0),\nonumber \\ D_0=\frac {g^2 \!\left (9 T_0^4-10 T_0^2+9\right )+gk^2\tau \! \left (15 T_0^4-44 T_0^2+30\right )+k^4\tau ^2 \! \left (6T_0^4-25 T_0^2+21\right )}{8T_0\big(g+\tau k^2 \big)\left [gT_0^2+k^2\tau \left (T_0^2-3\right )\right ]}. \end{gather}
The variation with respect to
 $a$
, or equivalently
 $E$
, enables the approximation of the nonlinear dispersion relation up to
 $O(\epsilon ^2)$
:
 \begin{align} \omega =\omega _0+k\beta +k\left [c_g-\frac 12\left (1+\frac {2k^2\tau }{g+k^2\tau }\right )c_p\right ]\frac {b}{h_0}+D_0\frac {k^2 E}{c_p}+O(\epsilon ^4), \end{align}
where
 $b$
and
 $\beta$
are taken to be
 $O(\epsilon ^2)$
, and
 \begin{align} \omega _0^2=k \tanh (kh_0)\,\big(g+\tau k^2 \big), \quad c_p=\frac {\omega _0}{k},\quad c_g=\frac {c_p}{2}\left [1+\frac {2\tau k^2}{g+\tau k^2}+\frac {2kh_0}{\sinh (2kh_0)}\right ]\!. \end{align}
Furthermore, the variation with respect to the mean surface height
 $b$
,
 $\mathscr{L}_b=0$
, illustrates the relationship between
 $\gamma$
,
 $\beta$
and
 $b$
, expressed as
 \begin{align} \gamma =\frac {1}{2}\beta ^2+gb+\frac 12\left [\frac {2c_g}{c_p}-\left (1+\frac {2k^2\tau }{g+k^2\tau }\right )\right ]\frac {E}{h_0}+O(\epsilon ^4). \end{align}
Finally, taking the variational derivatives of the action with respect to
 $\theta$
and
 $\psi$
yields
 \begin{align} \frac {\partial }{\partial t}\left (\frac {E}{\omega _0}\right )+\frac {\partial }{\partial x}\left (c_g\frac {E}{\omega _0}\right )=0,\quad \frac {\partial h}{\partial t}+\frac {\partial }{\partial x}\left (\beta h+\frac {E}{c_p}\right )=0. \end{align}
Equations (2.7) and (2.16) form a closed first-order PDE system, where
 $\omega$
and
 $\gamma$
are given by (2.13) and (2.15), respectively. It is important to note that the first equation in (2.16) corresponds to the physical principle of wave action conservation. In this context,
 $E/\omega _0$
represents the wave action, as described by Grimshaw (Reference Grimshaw1975).
As suggested by Whitham (Reference Whitham1999), we can rearrange (2.7) and (2.16) using Noether’s theorem to reveal their deeper physical significance. This system encompasses the consistency condition and the conservation laws for mass, momentum and energy, which are represented as
 \begin{gather} k_t+\omega _x=0,\quad h_t + (h U)_x = 0,\nonumber \\ (hU)_t+\left ( \frac {1}{2}g h^2 + S\right )_x=0,\quad E_t+\left (c_gE \right )_x=0, \end{gather}
where
 $U=\beta +({E}/{c_p h})$
is the mass transport velocity, and
 $S$
is the radiation stress taking the form
 \begin{align} S=\left [\frac {2 c_g}{c_p}-\frac {1}{2}\left (1+\frac {2 k^2 \tau }{g+k^2 \tau }\right )\right ]E, \end{align}
which was initially defined by Longuet-Higgins & Stewart (Reference Longuet-Higgins and Stewart1960, Reference Longuet-Higgins and Stewart1961). It is worth noting that the form of the governing equations hinges on the chosen reference level for the potential energy in the Lagrangian. Whitham (Reference Whitham1999) defined the zero level at the bottom of the fluid as
 $y=0$
, positioning the mean surface level at
 $y=h_0+b$
. In our derivation, however, we set the mean surface level at
 $y=b$
, and the bottom at
 $y=-h_0$
. By transforming the coordinate system and neglecting surface tension, our results align with the findings for pure gravity waves presented by Whitham (Reference Whitham1999).
3. Numerical method
3.1. Numerical method for time-dependent DSW simulations
Since gravity and surface tension are both considered in the present problem, we can non-dimensionalise the system by choosing
 $h_0$
,
 $\sqrt {h_0/g}$
and
 $\sqrt {gh_0^3}$
as the units of length, time and velocity potential, respectively. Consequently, the fluid occupies the domain defined by
 $-1\lt y\lt \eta (x,t)$
. After rescaling, the governing equations (2.2) remain the same, but the Bernoulli equation (2.3) is transformed to
 \begin{align} \phi _t+\frac {1}{2}\big (\phi _x^2+\phi _y^2\big )+\eta -\frac {B\eta _{xx}}{\big(1+\eta _x^2 \big)^{3/2}}=0, \end{align}
where
 $B=\tau /(gh_0^2)$
is the Bond number. The DSWs typically occur when the Froude number
 $ \textit{Fr} $
defined in (2.4) is close to unity. To analyse this phenomenon more effectively, we introduce a reference frame that moves to the right at speed
 $ \textit{Fr}=1$
. Specifically, we define
 $\hat {x}=x-t$
and
 $\hat {\phi }=\phi -x+( {1}/{2})t$
. By omitting the hats, the governing equations retain their form as given in (2.2) and (3.1).
We introduce the time-dependent conformal mapping method (for more details, see Ovsjannikov Reference Ovsjannikov1974; Dyachenko, Zakharov & Kuznetsov Reference Dyachenko, Zakharov and Kuznetsov1996) to solve the two-dimensional fully nonlinear Euler equations. Under the conformal transformation
 $z=x(\xi ,\zeta ,t)+\mathrm{i} y(\xi ,\zeta ,t)$
that converts the physical domain – bounded vertically by the free surface and flat bottom – into a stripe defined by
 $-h_c(t)\lt \zeta \lt 0$
, the Euler equations can be reduced to a closed system of exact evolution equations, expressed as
 \begin{align} Y_t &=Y_\xi \boldsymbol{C}\left [\frac {\varPsi _\xi }{J}\right ]-X_\xi \left (\frac {\varPsi _\xi }{J}\right )\!, \\[-28pt] \nonumber \end{align}
 \begin{align} \varphi _t =\frac {\varPsi _\xi ^2-\varphi _\xi ^2}{2J}&+\varphi _\xi \boldsymbol{C}\left [\frac {\varPsi _\xi }{J}\right ]-Y+B\frac {Y_{\xi \xi }X_\xi -Y_\xi X_{\xi \xi }}{J^{3/2}},\\[-12pt] \nonumber \end{align}
together with
 $X_\xi =1-\boldsymbol{C}[Y_\xi ]$
and
 $\varphi _\xi =\mathcal{U}-\boldsymbol{C}[\varPsi _\xi ]$
, where
 $\boldsymbol{C}$
is a pseudo-differential operator with the Fourier symbol
 $\mathrm{i}\coth (kh_c)$
,
 $J=X_\xi ^2+Y_\xi ^2$
is the Jacobian of the transformation, and
 $\mathcal{U}$
represents the mean horizontal velocity of the flow. It is noted that
 $Y$
and
 $\varphi$
are quantities on the free surface, namely
 $Y(\xi ,t)=y(\xi ,0,t)$
and
 $\varphi (\xi ,t)=\phi (x(\xi ,0,t),y(\xi ,0,t),t)$
, and the stripe thickness in the transformed plane,
 $h_c$
, is a function of time, ensuring that the
 $x$
-period is equal to that in the
 $\xi$
domain. Interested readers are referred to Dyachenko et al. (Reference Dyachenko, Zakharov and Kuznetsov1996) and Li, Hyman & Choi (Reference Li, Hyman and Choi2004) for the derivation of (3.2), and we omit the details here.
Choosing suitable initial conditions is crucial in numerical studies of DSWs using the fully nonlinear Euler equations. According to Sprenger & Hoefer (Reference Sprenger and Hoefer2017), DSWs arise from initial conditions that ultimately lead to gradient catastrophe or shock waves in the dispersionless limit. The canonical Gurevich–Pitaevskii Riemann problem involves examining the evolution of step-like initial data:
 \begin{align} \eta (x,0)= \begin{cases} 0,& x\lt 0,\\ \epsilon \bar {\eta },& x\geqslant 0, \end{cases} \end{align}
where
 $\bar {\eta }$
is constant. In numerical calculations using the pseudo-spectral method, we often transform the step-like initial condition into a plateau-like profile. This allows us to use a modified hyperbolic tangent function to approximate this piecewise constant function:
 \begin{align} \eta (x,0)=\frac {1}{2}\epsilon \bar {\eta }\left [\tanh \left (\frac {x+m}{w}\right )-\tanh \left (\frac {x}{w}\right )\right ]\!, \end{align}
where we set
 $m$
sufficiently large to minimise the impact of wave evolution near the left step. The corresponding velocity potential
 $\phi$
also requires careful consideration. We apply the shallow-water approximation
 $\phi _x=\eta$
to derive the expression for the potential function in the moving frame as follows:
 \begin{align} \phi (x,0,0)=\frac {1}{2}\epsilon \bar {\eta }w\left [\ln \left (\cosh \left (\frac {x+m}{w}\right )\right )-\ln \left (\cosh \left (\frac {x}{w}\right )\right )\right ]-x. \end{align}
For the time integration of (3.2), we employ the fourth-order Runge–Kutta scheme in conjunction with the pseudo-spectral method. In the subsequent simulations, we set the following parameters:
 $\epsilon =0.05$
,
 $\bar {\eta }=1$
,
 $m=1500$
and
 $w=10$
. Following Li et al. (Reference Li, Hyman and Choi2004), we incorporate an artificial dissipation term to reduce aliasing errors in the computations. The length of the computational domain is chosen to be
 $L=5000$
, with the number of grid points as
 $n=25\,000$
. We simulate the evolution of surface waves from
 $t=0$
to
 $t=5000$
, using time step
 ${\rm d}t=0.04$
. The initial condition is well proposed, as the relative error of the platform height during time evolution compared to the initial setting remains below 1 %, demonstrating the reliability of the shallow-water approximation. The time evolution waveforms of DSWs presented in the following text are obtained using this numerical scheme.
3.2. Numerical method for travelling-wave solutions
In the subsequent analyses, we will demonstrate that solitary waves play a significant role in the dynamics of gravity-capillary DSWs, possibly being partially embedded within them. To seek solitary-wave solutions that translate at a speed
 $c$
within the fully nonlinear Euler equations (2.2) and (3.1), we assume that all functions depend on the variable
 $x-ct$
. As a result, (3.2) simplifies to
 \begin{align} \frac {(\mathcal{U}-c)^2}{2 J}-\frac {c^2}{2}+Y-B\frac {Y_{\xi \xi }X_\xi -Y_\xi X_{\xi \xi }}{J^{3/2}}=0 \end{align}
and
 $\varPsi _\xi =cY_\xi$
. We approximate
 $Y$
by the truncated Fourier series
 \begin{align} Y(\xi ,t) = \sum _{n=-N}^{N-1}Y_n(t)\,{\rm e}^{{\mathrm i}2\pi n\xi /L}. \end{align}
The Newton–Raphson method is employed to find the solution of the nonlinear integrodifferential equation (3.6). The solution is considered converged when the residual error is less than
 $10^{-10}$
. After successfully converging to a solution of (3.6) within the specified tolerance, we employ a numerical continuation method to explore additional solutions along the same branch. This is accomplished by slightly perturbing the previously determined solution, which serves as the initial guess for the numerical algorithm. The wave speed and amplitude are used as bifurcation parameters to establish the bifurcation curves. In our computations, we employ a large number of Fourier modes, typically 2048, to ensure the accuracy of the results, especially when dealing with wavepacket solitary waves. A solution is considered exact if there is no noticeable change in the wave within graphical precision, even when we increase the number of Fourier modes or adjust the length
 $L$
during the Newton–Raphson method. This algorithm is used to obtain all travelling-wave solutions presented later in the text.
4. Numerical results and key characteristics of DSWs
4.1. Classification of DSWs
We illustrate various types of DSWs with different Bond numbers in figure 1. According to El & Hoefer (Reference El and Hoefer2016), classical DSWs describe the modulation process from periodic to solitary waves, as shown in figures 1(a) and 1(b). This phenomenon involves two distinct scales: a fast oscillatory wave scale and a slow modulation scale. The DSW displays a periodic wavetrain over a small region in both space and time, while wave parameters – such as amplitude, wavelength and frequency – exhibit a slow modulation process over a large region. As noted by Sprenger & Hoefer (Reference Sprenger and Hoefer2017), we refer to this type of DSW as a radiating DSW (RDSW), as the waveform transitions from small periodic waves to larger solitary waves, resembling the shape of a horn as a whole. This behaviour can also be observed in the KdV equation.
(a–h) Snapshots of wave profiles at
 $t=5000$
for the Bond numbers 0, 0.1, 0.2, 0.25, 0.3, 0.35, 0.5 and 0.6, respectively. Distinct structures are observed in the diagrams: RDSWs in (a) and (b), crossover solutions in (c) and (d), TDSWs in (e) and (f), and IRDSWs in (g) and (h). The red dashed lines illustrate the initial profiles, while the blue solid lines depict the waveforms at
 $t=5000$
, obtained using the numerical scheme outlined in § 3.1.

As the Bond number increases to 0.17, instability manifests in the DSW. This transition process is illustrated in figure 2(a–c), where small-amplitude waves emerge on the lower platform for
 $B\geqslant 0.17$
. As illustrated in figures 1(c) and 1(d), the RDSW characteristics disappear at this stage. The oscillations on the high platform become chaotic, and the range of these oscillations decreases as the Bond number rises. In parallel, a series of small-amplitude fluctuations travels across the step and rapidly propagates onto the lower platform, where the wavepackets also exhibit signs of instability. This unstable transitional waveform is referred to as the ‘crossover region’, as suggested by Sprenger & Hoefer (Reference Sprenger and Hoefer2017).
The DSW structures near the critical Bond number: (a–c) the transition from the RDSW region to the crossover region; (d–f) the transition from the crossover region to the TDSW region; (g–i) the transition from the TDSW region to the IRDSW region. All DSW structures are obtained using the numerical scheme described in § 3.1.

The wave profile begins to exhibit modulation stability again when the Bond number increases to approximately 0.29, as illustrated in figure 2(d–f). A key aspect of this process is the loss of oscillations on the high platform, which is followed by the emergence of a uniform periodic wavetrain before the wave amplitude diminishes to zero. As depicted in figures 1(e) and 1(f), as the Bond number continues to rise, the region of periodic waves is gradually overtaken by a modulation process, resulting in an increase in the amplitude of the periodic waves, which eventually approaches the height of the initial step. Following Sprenger & Hoefer (Reference Sprenger and Hoefer2017), we refer to this particular type of DSW as the travelling DSW (TDSW).
As the Bond number exceeds approximately 0.41, constant-amplitude periodic wavetrains disappear; instead, the transition from the high platform to the lower platform is bridged by oscillations that show gradually decreasing amplitude, as illustrated in figure 2(g–i). The characteristics of RDSW re-emerge, but in an inverse orientation. Unlike classical RDSW, the wavetrain transitions from solitary to periodic waves from left to right, as illustrated in figures 1(g) and 1(h). Its waveform resembles the RDSW rotated
 $180^\circ$
. Thus we define this type of DSW as an inverse radiating DSW (IRDSW) to distinguish it from the classical RDSW.
As reported in Sprenger & Hoefer (Reference Sprenger and Hoefer2017), the effects of varying
 $\epsilon \bar {\eta }$
were studied within the framework of the fifth-order KdV equation. In line with this, we also analysed the numerical results for
 $\epsilon \bar {\eta }=0.01$
using the Euler equations, and found consistent results. Specifically, the DSW exhibits four distinct regions: RDSW, crossover region, TDSW and IRDSW, with three corresponding transition thresholds at Bond numbers 0.28, 0.31 and 0.35. In comparison to the scenario with
 $\epsilon \bar {\eta }=0.05$
, a decrease in
 $\epsilon \bar {\eta }$
results in a shorter Bond number range for both the crossover region and the TDSW region, while broadening the range for the classical DSW.
4.2. Edge velocities of DSWs
As we categorise the gravity-capillary DSWs into four states, the regions associated with each state are illustrated in figure 3. We perform numerical simulations on 61 sets of DSW structures with Bond numbers ranging from 0 to 0.6. Following the description in § 4.1, we classify these structures, resulting in the region division illustrated in figure 3. It should be noted that the boundaries separating the different regions are approximately determined based on our numerical results, and the transition characteristics of different DSWs near the critical Bond number are illustrated in figure 2. A more precise definition of these boundaries will require further investigation. The RDSW and IRDSW demonstrate the modulation process that transforms a periodic wavetrain into solitary waves, highlighting the importance of edge velocity in the DSW research. According to Sprenger & Hoefer (Reference Sprenger and Hoefer2017), the solitary-wave edge is defined as the boundary where the solitary wave exhibits a vanishing wavenumber, and we denote by
 $V_s$
the evolution velocity of this edge. In contrast, the harmonic-wave edge refers to the boundary at which the harmonic wavepacket shows a vanishing amplitude, with its evolution velocity defined as
 $V_h$
. Additionally, within the TDSW region, the travelling-wave edge is defined as the position where the amplitude of the wavepacket begins to gradually decrease, and we designate its evolution velocity as
 $V_t$
. In this subsection, we will focus on the velocities of both the solitary-wave and harmonic-wave edges to describe the regions of DSWs during the time-dependent process.
The solitary-wave edge velocity (
 $V_s$
), harmonic-wave edge velocity (
 $V_h$
) and travelling-wave edge velocity (
 $V_t$
) for different types of DSWs (with
 $\epsilon \bar {\eta }=0.05$
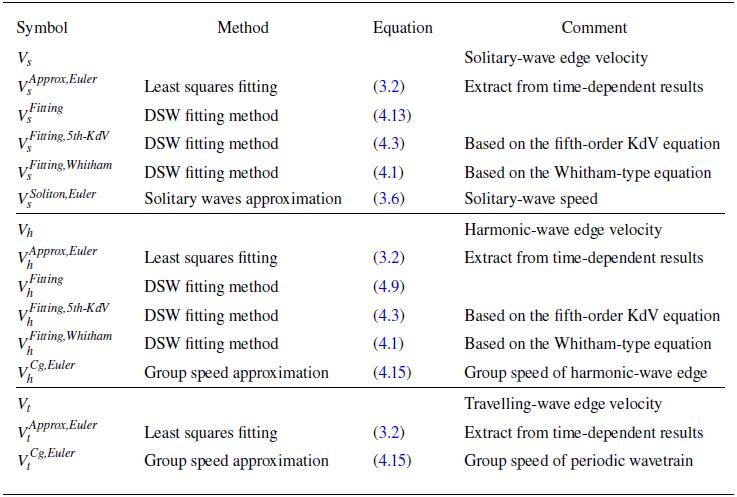
fixed). The meanings of the velocity symbols can be found in table 1.

Methods, equations and comments for different velocity symbols.

In the subsequent subsections, we will adopt multiple methods to investigate the edge velocities of DSWs. To clarify the definitions and prediction methods of these velocities, we present a symbol table (table 1) for convenient reference. The naming convention follows a specific rule: the subscript indicates the category of the edge, the first superscript denotes the method used to obtain this physical quantity, and the second superscript represents the equation upon which it is based.
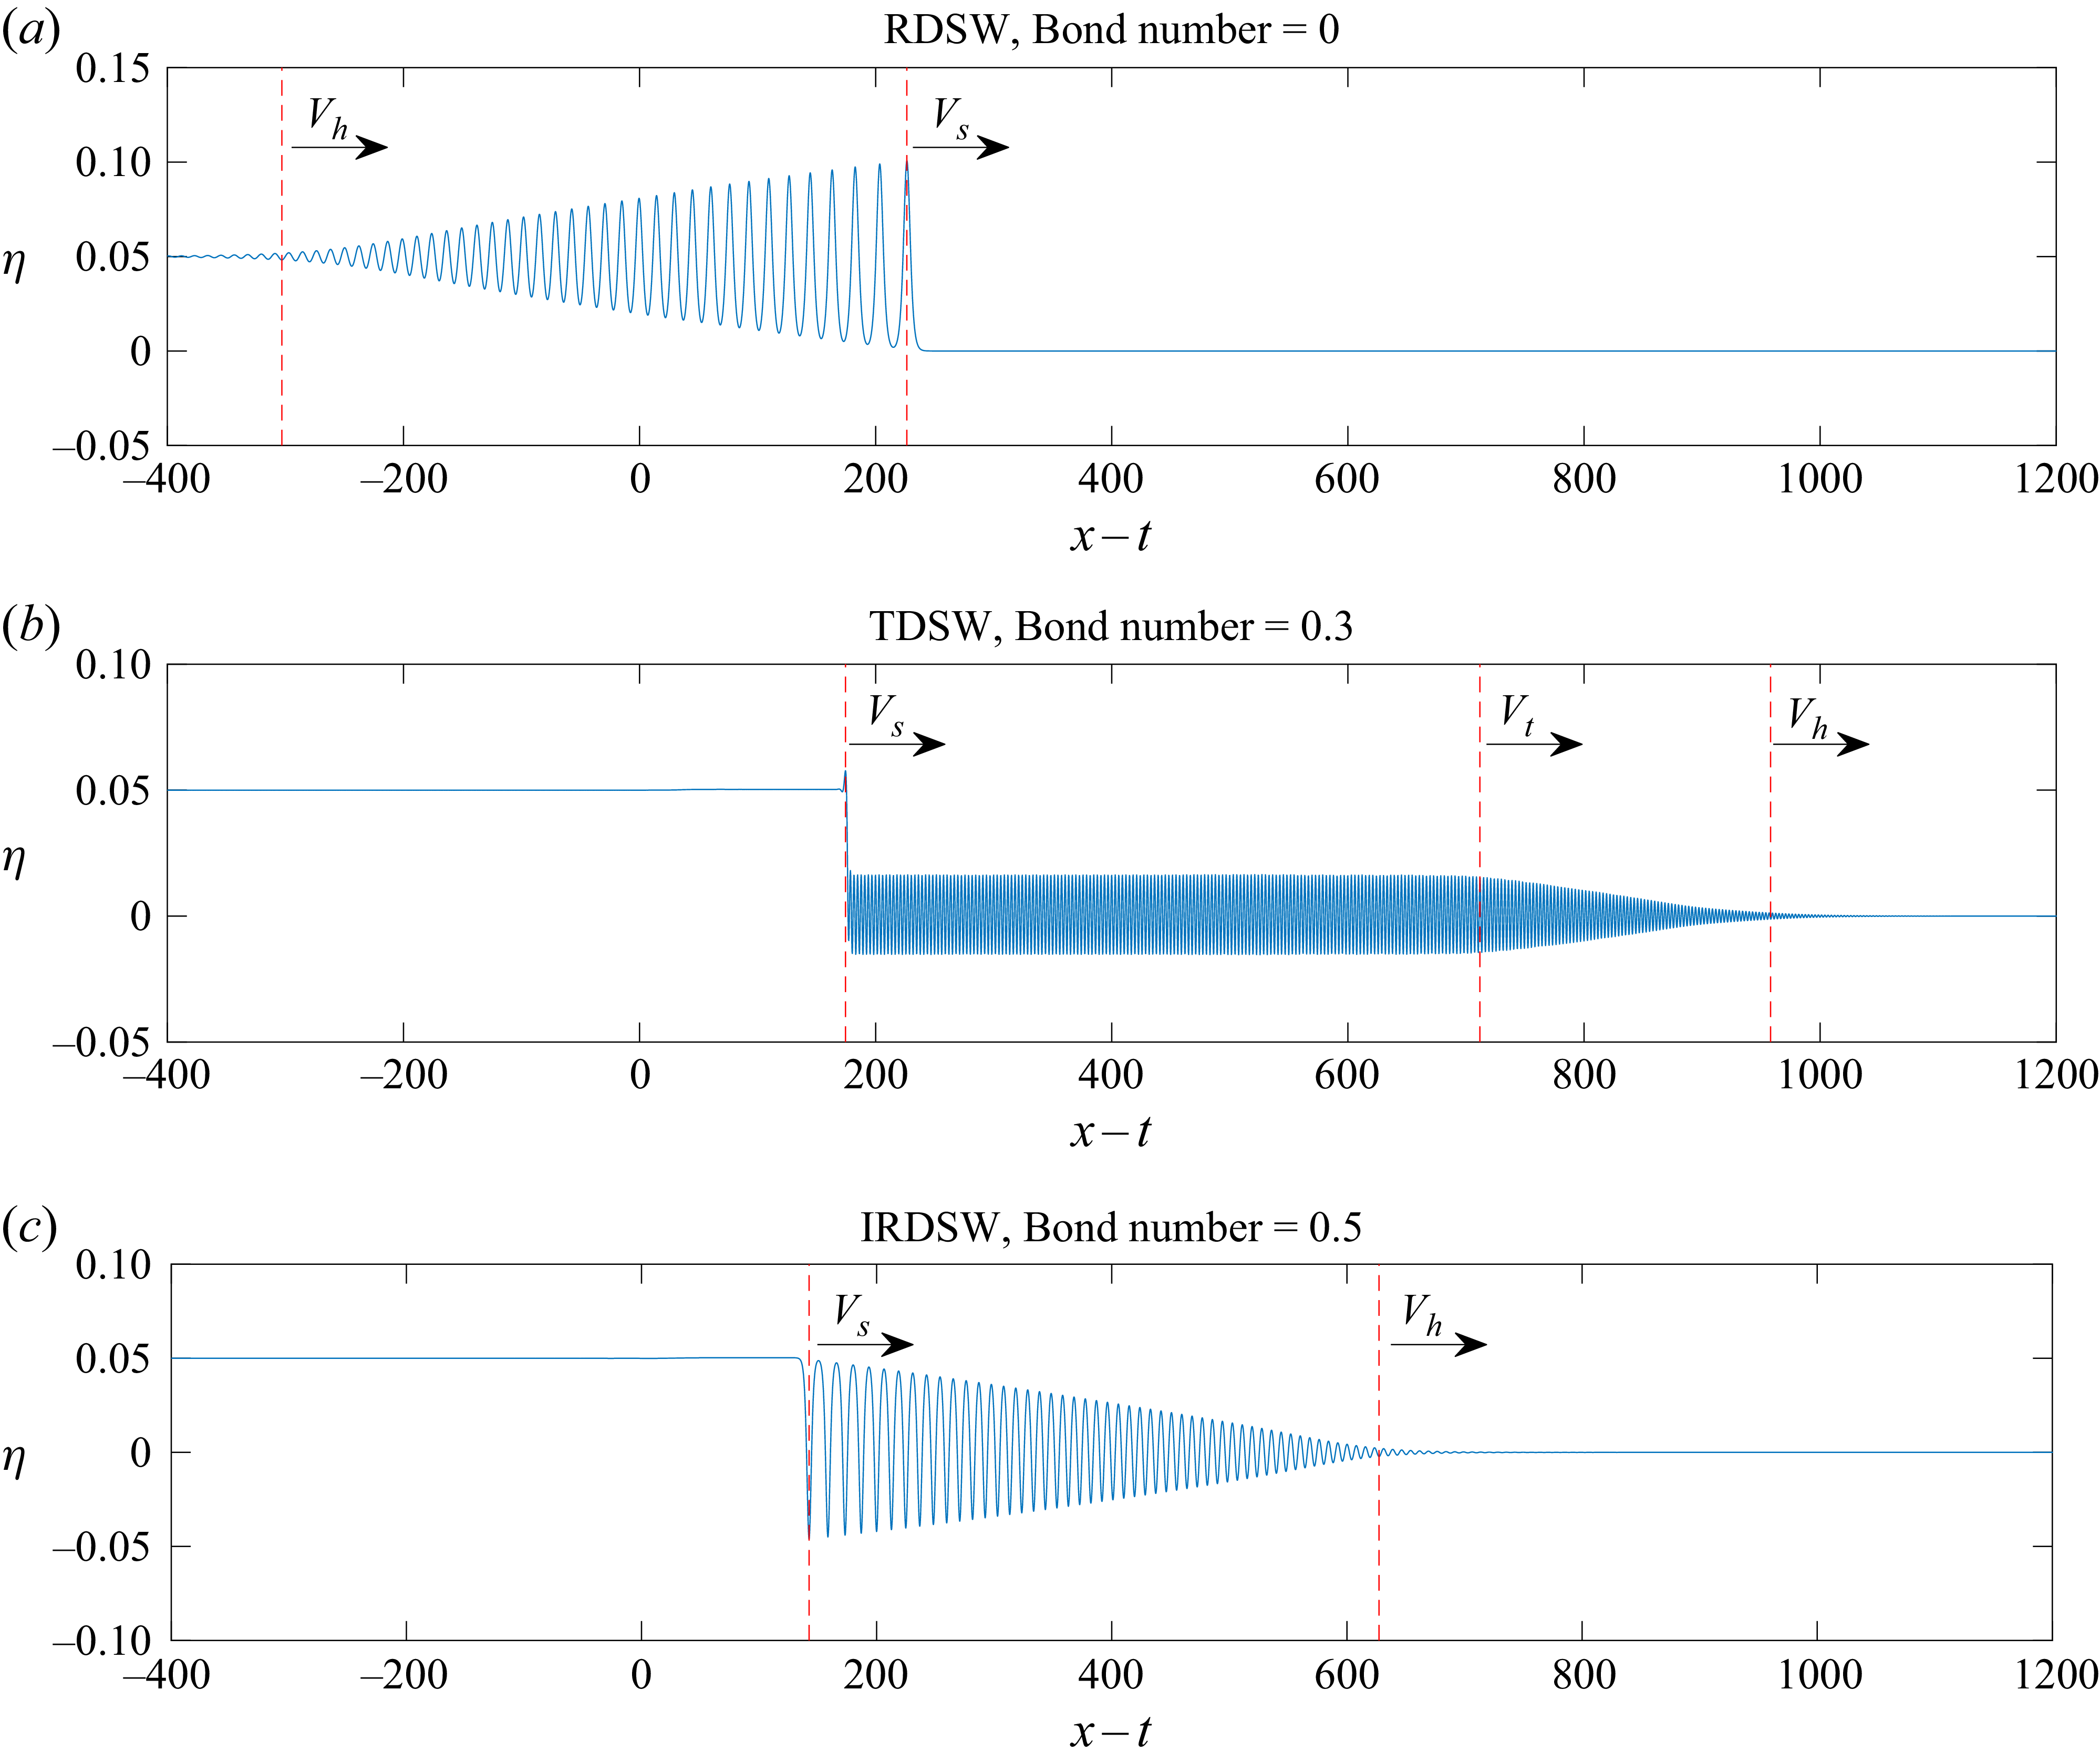
We begin by extracting the positions of solitary-wave and harmonic-wave edges from the numerical results, and the schematic diagram is shown in figure 4. In numerical terms, the harmonic-wave edge is defined as the location where the crest/trough amplitude reaches 5 % of the maximum amplitude in the horn-shaped wavepacket. In contrast, the solitary-wave edge can be identified differently depending on the case: it is represented by the leading wave crest in the RDSW case, the trailing wave crest in the TDSW case, or the trailing wave trough in the IRDSW case. Additionally, in the TDSW region, the travelling-wave edge marks the position where the crest/trough value in the horn-shaped region attains 95 % of the amplitude of the uniform wavetrain. Next, we apply the least squares method to fit the slope of the time–position curve and determine the numerical velocities of the solitary-wave edge (
 $V_s^{\textit{Approx,Euler}}$
), harmonic-wave edge (
 $V_h^{\textit{Approx,Euler}}$
) and travelling-wave edge (
 $V_t^{\textit{Approx,Euler}}$
). These velocities, derived by numerically solving the full Euler equations, are represented by circles, triangles and diamonds in figure 3. In the RDSW and IRDSW regions,
 $V_s^{\textit{Approx,Euler}}$
shows only slight variations with changes in the Bond number. However, in the RDSW region, as the Bond number increases,
 $V_h^{\textit{Approx,Euler}}$
approaches the Froude number
 $ \textit{Fr}=1$
, whereas
 $V_h^{\textit{Approx,Euler}}$
remains stable in the IRDSW region. In the TDSW region,
 $V_s^{\textit{Approx,Euler}}$
is greater than in the IRDSW region, while
 $V_h^{\textit{Approx,Euler}}$
experiences significant changes as the Bond number varies. The characteristic of the trailing edge disappears in the crossover region, therefore we do not present its edge velocity in figure 3.
Schematic diagrams illustrating the edge velocities, including the solitary-wave edge velocity (
 $V_s$
), harmonic-wave edge velocity (
 $V_h$
) and travelling-wave edge velocity (
 $V_t$
): (a) RDSW with
 $V_s\gt V_h$
, (b) TDSW with
 $V_h\gt V_t\gt V_s$
, (c) IRDSW with
 $V_h\gt V_s$
. The red dashed lines are determined by the solitary-wave, travelling-wave and harmonic-wave edge locations calculated from the procedure outlined in § 4.2. The waveforms are derived from (3.2) using various Bond numbers.

El (Reference El2005) pointed out that the Whitham modulation equations become degenerate at the edges of DSWs in certain limiting cases. The edge velocity can be predicted using the nonlinear term and the dispersion relation of the system, without requiring a global integration of the modulation equations. This technique is known as the DSW fitting method, which we will use to predict the edge velocities in the subsequent analyses. Interested readers may refer to El & Hoefer (Reference El and Hoefer2016) and Sprenger & Hoefer (Reference Sprenger and Hoefer2017) for more details about the DSW fitting method. For this purpose, we focus on the Whitham equation, which is a fully dispersive and weakly nonlinear model originally proposed by Whitham to describe the wave breaking and peaking phenomena. According to Whitham (Reference Whitham1999), the nonlinear term
 $(3\sqrt {1+\eta }-2)\eta _x$
and the linear dispersion relation
 $\omega ^2=(1+B k^2)k\tanh (k)$
from (2.2) and (3.1) lead to the Whitham equation, which can be reformulated in the moving frame
 $x-t$
as
 \begin{align} \eta _t+3\left (\sqrt {1+\eta }-1\right )\eta _x+\int _{-\infty }^{\infty }K(x-\xi )\,\eta _\xi (\xi ,t)\,{\rm d}\xi =0, \end{align}
with the kernel
 \begin{align} K(x)=\frac {1}{2\pi }\int _{-\infty }^{\infty }\frac {\sqrt {(1+Bk^2)k\tanh (k)}-k}{k}\,{\rm e}^{{\mathrm i}kx}\,{\rm d}k. \end{align}
In the long-wave limit, (4.1) simplifies to the fifth-order KdV equation, which is a classical model used to describe gravity-capillary waves in shallow water:
 \begin{align} \eta _t+\frac {3}{2}\eta \eta _x+\frac {1}{6}\left (1-3B\right )\eta _{xxx}+\frac {1}{360}\big (19-30B-45B^2\big )\eta _{xxxxx}= 0. \end{align}
It is noted that considering the weakly nonlinear assumption, (4.1) can be rewritten in a more appealing form as
 \begin{align} \eta _t+\frac {3}{2}\eta \eta _x+\int _{-\infty }^{\infty }K(x-\xi )\,\eta _\xi (\xi ,t)\,{\rm d}\xi =0, \end{align}
commonly known as the Whitham equation, as referenced in Binswanger (Reference Binswanger2019). Thus to distinguish clearly, we refer to (4.1) as the Whitham-type equation. We apply the DSW fitting method to (4.1), offering a more precise dispersion relation than the fifth-order KdV model.
Following El (Reference El2005), we define the dispersion relation for (4.1) by introducing an infinitesimal perturbation around a mean level
 $\eta _0$
:
 \begin{align} \eta =\eta _0+\eta _1\,{\rm e}^{{\mathrm i}(k_hx-\omega _ht)},\quad \eta _1\ll \eta _0. \end{align}
Therefore, the leading-order dispersion relation of (4.1) can be recast to
 \begin{align} \omega _h(\eta _0,k_h)=N_h(\eta _0)\,k_h+f_h(k_h), \end{align}
with
 \begin{align} N_h(\eta _0)=3\big (\sqrt {1+\eta _0}-1\big ),\quad f_h(k_h)=\sqrt {\left (1+B k_h^2\right )k_h \tanh (k_h)}-k_h. \end{align}
If we assume that
 $k_h$
is a function related to the average height
 $\eta _0$
, and notice that the wavenumber
 $k_h$
vanishes at the solitary-wave edge, then we can determine the wavenumber by solving the ordinary differential equation (ODE)
 \begin{align} \frac {{\rm d}k_h}{{\rm d}\eta _0}=\frac {\partial \omega _h/\partial \eta _0}{N_h(\eta _0)-\partial \omega _h/\partial k_h},\quad k_h(\eta _s)=0,\ \eta _0=\eta _s, \end{align}
where the average level of the solitary-wave edge is represented by
 $\eta _s$
. Additionally,
 $V_h$
can be determined using the dispersion relation (4.6), which is associated with the wavenumber at the harmonic-wave edge, denoted as
 \begin{align} V_h^{\textit{Fitting}}=\frac {\partial \omega _h(\eta _0,k_h)}{\partial k_h},\quad k_h=k_h(\eta _h),\quad \eta _0=\eta _h, \end{align}
where
 $\eta _h$
stands for the average height of the harmonic-wave edge.
On the other hand, the velocity of the solitary-wave edge necessitates an analogy to the dispersion relation that applies to periodic waves. El (Reference El2005) demonstrates that this can be derived from
 \begin{align} \omega _s(\eta _0,k_s)=-\mathrm{i} \omega _h(\eta _0,\mathrm{i} k_s)=N_s(\eta _0)\,k_s+f_s(k_s), \end{align}
with
 \begin{align} N_s(\eta _0)=3\big (\sqrt {1+\eta _0}-1\big ),\quad f_s(k_s)=\sqrt {(1-B k_s^2)k_s\tan (k_s)}-k_s. \end{align}
In the same way, we assume that
 $k_s$
is a function related to the average height
 $\eta _0$
, and apply the condition that
 $k_s$
equals zero at the harmonic-wave edge. Consequently, the ODE that we need to solve can be expressed as
 \begin{align} \frac {{\rm d}k_s}{{\rm d}\eta _0}=\frac {\partial \omega _s/\partial \eta _0}{N_s(\eta _0)-\partial \omega _s/\partial k_s},\quad k_s(\eta _h)=0,\ \eta _0=\eta _h. \end{align}
The solitary-wave edge velocity can be inferred from the special situation of (4.10), given by
 \begin{align} V_s^{\textit{Fitting}}=\frac {\omega _s(\eta _0,k_s)}{k_s},\quad k_s=k_s(\eta _s),\ \eta _0=\eta _s. \end{align}
For the RDSW case, we set
 $\eta _h=\epsilon \bar {\eta }$
and
 $\eta _s=0$
. In contrast, for the IRDSW case,
 $\eta _h=0$
and
 $\eta _s=\epsilon \bar {\eta }$
are established based on figure 1. Finally, we recover the velocity in the original frame by adding the reference speed
 $ \textit{Fr}=1$
.
The DSW fitting method can also be applied to the fifth-order KdV equation (4.3) and the Whitham equation (4.4) using a similar procedure, and interested readers are referred to Sprenger & Hoefer (Reference Sprenger and Hoefer2017) and Binswanger (Reference Binswanger2019) for more details. In numerical simulations, we first solve the ODEs (4.8)–(4.13) within the framework of the fifth-order KdV equation to determine the wavenumbers at both the solitary-wave and harmonic-wave edges. These results provide initial estimates for the Newton–Raphson method, which is employed to find the roots of the ODEs (4.8) and (4.12) in the context of the Whitham-type equation (4.1). Ultimately, the velocity predictions of the DSW edges are deduced from (4.9) and (4.13).
Figure 3 demonstrates that the DSW fitting method effectively predicts the edge velocities in both the RDSW and IRDSW regions. The velocity of the solitary-wave edge (
 $V_s^{\textit{Fitting}}$
) changes slightly, while the harmonic-wave edge velocity (
 $V_h^{\textit{Fitting}}$
) approaches
 $ \textit{Fr}=1$
in the RDSW region, and remains consistent in the IRDSW region. The fifth-order KdV equation (4.3) and the Whitham-type equation (4.1) produce similar results for predicting
 $V_s^{\textit{Approx,Euler}}$
. While the fifth-order KdV equation fails to predict
 $V_h^{\textit{Approx,Euler}}$
accurately, the Whitham-type equation provides a more reliable estimate. However, the DSW fitting method encounters difficulties in the TDSW region. For the variable
 $V_s^{\textit{Fitting}}$
, within the framework of the fifth-order KdV equation (4.3), the predicted wavenumbers of the solitary-wave edge, as described by (4.13), become complex numbers when the Bond number is less than 0.380. Additionally, for the Whitham-type equation (4.1), the Newton–Raphson method fails to converge when the Bond number is below 0.398. The values of
 $B$
predicted by the fifth-order KdV equation (
 $B=0.380$
) and the Whitham-type equation (
 $B=0.398$
) provide estimates for the critical threshold for the transition from TDSW to IRDSW. This transition corresponds to the critical value of
 $B=0.41$
in the full Euler equations, as illustrated in figure 3. In regard to
 $V_h^{\textit{Fitting}}$
, although both simplified equations can indicate the general trend of
 $V_h^{\textit{Approx,Euler}}$
, the error increases as the Bond number approaches the crossover region. The limitations of theoretical predictions in the TDSW region are attributed to the special structure of this type of solution: the ODE system (4.8)–(4.13) depicts the continuous change in wavenumber, yet there exists a shock connecting the solitary edge and the periodic wavetrain, which creates a discrepancy that the DSW fitting method is unable to address.
In contrast to the RDSW or IRDSW region, the edge velocities in the TDSW region exhibit distinct characteristics: (i) the velocity of the harmonic-wave edge significantly decreases from
 $V_h^{\textit{Approx,Euler}}=1.224$
to
 $1.137$
as the Bond number increases; (ii) the velocity of the solitary-wave edge is greater than that observed in the IRDSW region. These differences require an explanation that goes beyond the classical DSW theory, which we will address in future investigations. In § 4.3, we will present the velocity prediction for the TDSW region, and in § 4.4, we will present the prediction of the TDSW envelope.
4.3. The analogy between solitary waves and DSWs
The analogy between solitary waves and DSWs elucidates their distinct yet interconnected dynamics. Solitary waves are permanent, isolated waveforms that retain their shape due to a balance between nonlinearity and dispersion, allowing them to travel at a constant speed. In contrast, DSWs arise from resolving an initial discontinuity in a medium and are characterised by a rapidly oscillating series of waveforms that bridge two distinct states. The analogy between solitary waves and DSWs, which we will discuss below, underscores the relationship between the fields of travelling waves and transient waves.
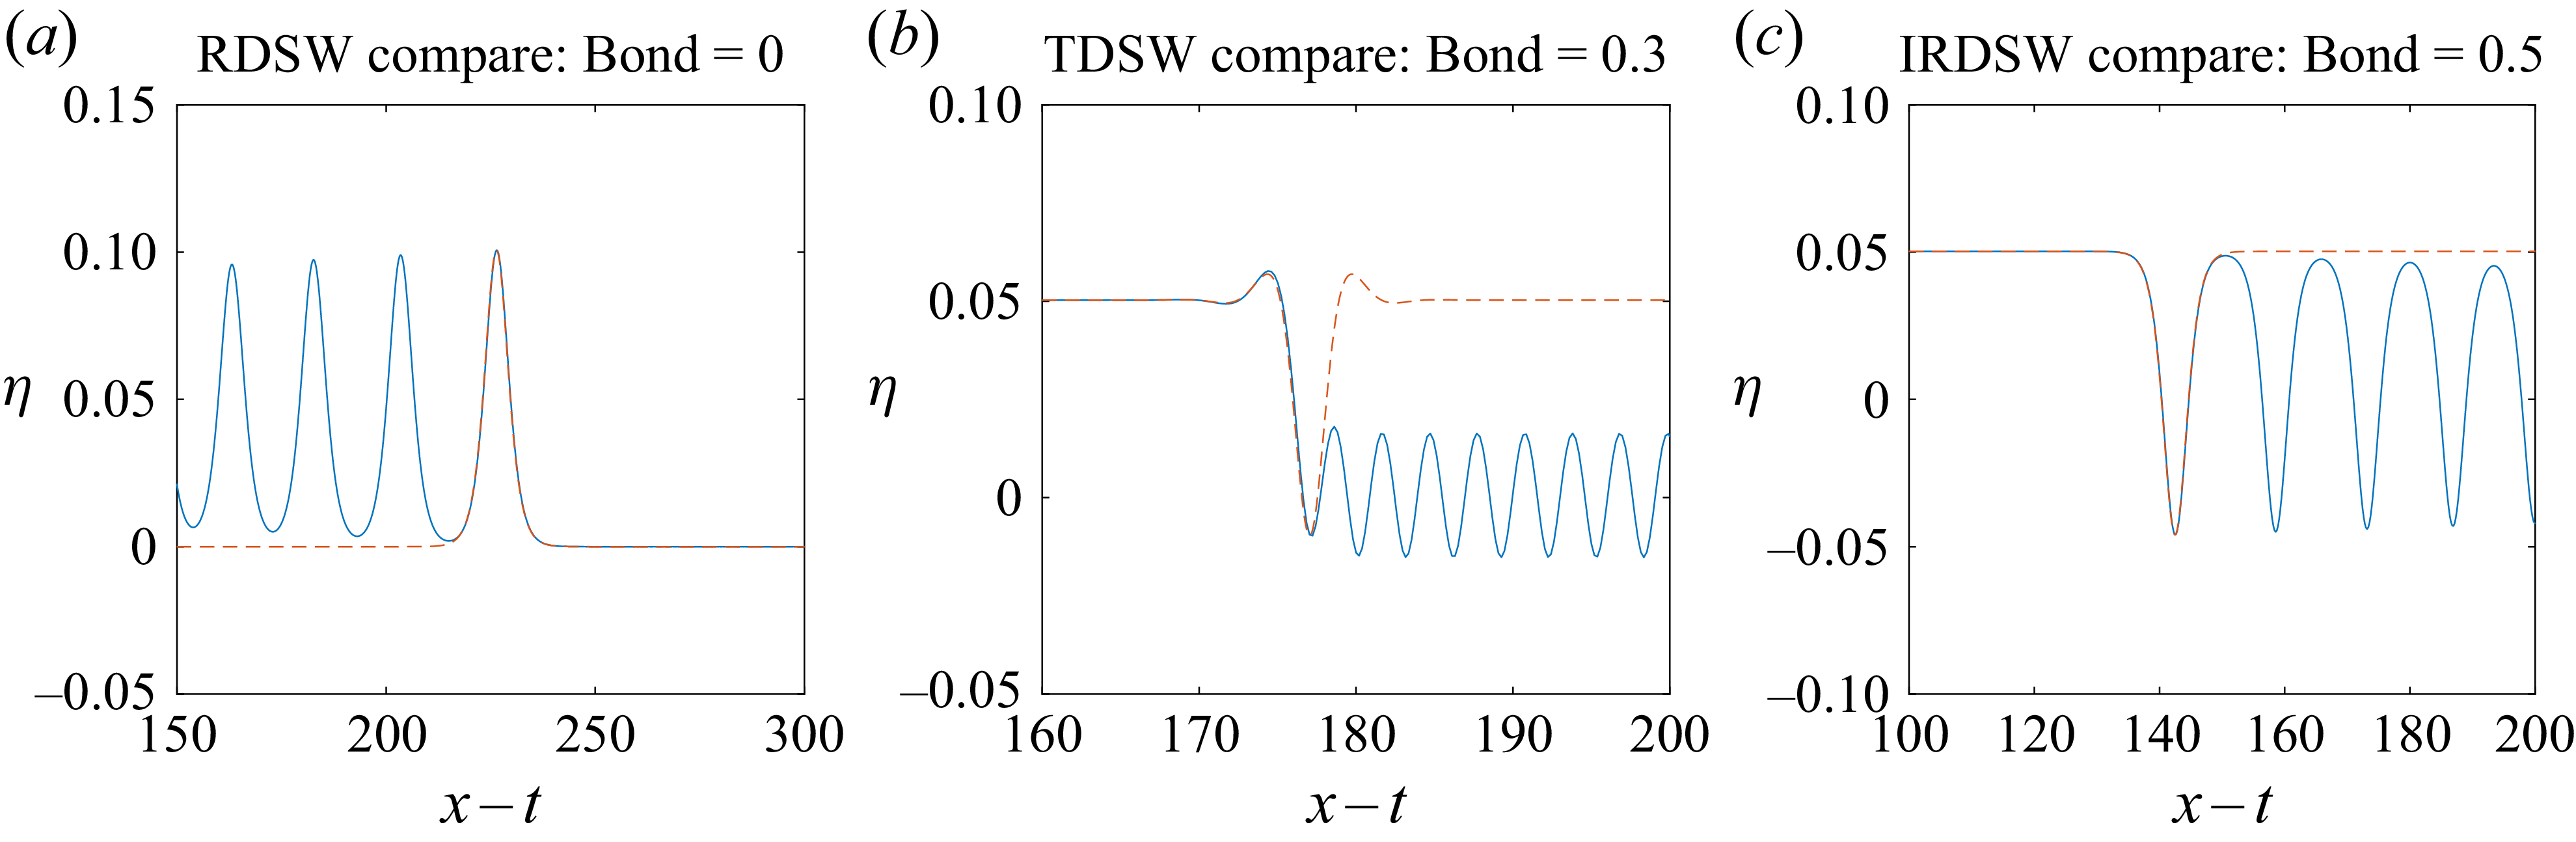
The structures of RDSWs and IRDSWs demonstrate the transition from solitary waves to periodic waves. Figures 5(a) and 5(c) emphasise the resemblance between the solitary-wave edges of DSWs and solitary waves, as illustrated in figures 1(a) and 1(g). In contrast, the TDSW structure exhibits a distinct pattern: it starts as a solitary wave, then evolves into a uniform periodic wavetrain, and ultimately the amplitude of the periodic wave decreases to zero, forming a horn-shaped wavepacket. This observed pattern suggests the need for further exploration into the mechanisms behind the generation and evolution of TDSWs.


Next, we explore the analogy between solitary waves with oscillatory pulses and TDSWs, aiming to generalise conclusions drawn from RDSWs and IRDSWs to the realm of TDSWs. First, in this paper, we define a ‘solitary wave with an oscillatory pulse’ as a solitary wave that incorporates a periodic wavetrain within its pulse, without displaying significant oscillations in the tails. The gravity-capillary solitary waves with oscillatory pulses were initially computed by Dias (Reference Dias1994) within the framework of the Euler equations, specifically examining structures that include two, three and five pendant-shaped bubbles. In Dias & Vanden-Broeck (Reference Dias and Vanden-Broeck1996), solutions with two troughs are illustrated in figures 4.3(a) and 4.3(b), corresponding to
 $B=0.2444$
and
 $B=0.3747$
, respectively. Additionally, solutions with three troughs are presented in figures 4.5(a) and 4.5(b), with
 $B=0.2769$
and
 $B=0.3665$
, respectively. As the Bond number approaches
 $1/3$
, the fifth-order KdV equation has been confirmed to approximate the full Euler system effectively. The relationship between this type of solitary wave in the Euler equations and the fifth-order KdV model was demonstrated by Dias & Vanden-Broeck (Reference Dias and Vanden-Broeck1996). They also showed that there are an infinite number of homoclinic orbits in the reduced model. In the field of dynamical systems, a homoclinic orbit is defined as a trajectory in phase space that connects a saddle equilibrium point back to itself. Specifically, within the fifth-order KdV model, a homoclinic orbit represents a form of solitary wave. As a result, the presence of an infinite number of homoclinic orbits suggests that an infinite variety of solitary waves can be anticipated in this model. Sprenger & Hoefer (Reference Sprenger and Hoefer2020) calculated solitary waves with oscillatory pulses in the fifth-order KdV equation, and superimposed these travelling waves on the TDSW structure, emphasising the link between steady and unsteady solutions. Our subsequent calculations will extend the above conclusions to the full Euler equations, shedding light on the relationship between solitary waves with oscillatory pulses and TDSWs.
To achieve this goal, the first step is to rescale the full Euler equations (refer to (2.2) and (3.1)). This rescaling is necessary because the amplitude of the solitary wave decreases to a value of
 $\epsilon \bar {\eta }$
, rather than to zero, at the edge of the TDSW. We define the scales for length, time and potential as
 \begin{align} h_0(1+\epsilon \bar {\eta }),\quad \sqrt {\frac {h_0(1+\epsilon \bar {\eta })}{g}},\quad \sqrt {g h_0^3\left (1+\epsilon \bar {\eta }\right )^3}, \end{align}
respectively, and set the corresponding Bond number as
 $\widetilde {B}= {B}/{(1+\epsilon \bar {\eta })^2}$
. Consequently, we normalise the mean height to
 $h_0=1$
, and ensure that the amplitude of the solitary wave with an oscillatory pulse matches that of the TDSW at infinity for comparison purposes.
We present a comparison of the TDSW illustrated in figure 1(e) with solitary waves that contain between two and nine troughs, as shown in figure 6. From this comparison, we deduce that the number of periodic oscillations in the central part may increase indefinitely to align with the solitary-wave edge of the TDSW. Additionally, figure 7 displays a comparison of TDSWs across a Bond number range from 0.29 to 0.40, alongside solitary waves featuring five troughs in the pulse. This suggests that solitary waves with oscillatory pulses can occur across a wide range of Bond numbers. As the Bond number increases, the amplitude of the uniform wavetrain progressively rises, peaking at
 $\eta =0.05$
, while the wavelength becomes longer. At the same time, the solitary-wave edge of the TDSW closely resembles that of the IRDSW, reflecting a gradual transition from TDSW to IRDSW.
(a–h) Comparisons between the TDSW (
 $\epsilon \bar {\eta }=0.05$
and
 $B=0.3$
) and solitary waves that have oscillatory pulses with varying numbers of oscillations. The blue solid lines represent the TDSW at
 $t=5000$
predicted by (3.2), while the red dashed lines depict the solitary waves with oscillatory pulses derived from (3.6), showcasing troughs ranging from two to nine.

The TDSWs with various Bond numbers (
 $\epsilon \bar {\eta }=0.05$
) compared to solitary waves with oscillatory pulses. (a–l) The comparisons between solitary waves featuring five troughs and TDSWs with Bond numbers ranging from 0.29 to 0.40. The blue solid lines represent TDSWs at
 $t=5000$
predicted by (3.2), while the red dashed lines depict solitary waves with five troughs derived from (3.6).

To further explore the relationship between TDSWs and solitary waves with oscillatory pulses, it is essential to compare their velocities. It is found that the DSW fitting method does not accurately predict the solitary-wave edge velocity in the TDSW region. To address this issue, we derive the velocity directly from numerical solutions of solitary waves with five troughs in pulse. The calculations for travelling-wave solutions assume a still-water condition; therefore, we reintegrate the reference velocity into the analysis, applying a shallow-water assumption with
 $\phi _x=\epsilon \bar {\eta }=0.05$
. The results presented in figure 8(a) demonstrate a satisfactory fit, indicating that the solitary-wave edge velocity of the TDSW coincides with the propagation speed of a solitary wave featuring an oscillatory pulse.
Predictions of edge velocities for TDSWs with
 $\epsilon \bar {\eta }=0.05$
: (a)
 $V_s^{\textit{Approx,Euler}}$
(circles) and the solitary wave speed
 $V_s^{\textit{Soliton,Euler}}$
(triangles); (b)
 $V_t^{\textit{Approx,Euler}}$
(circles) and the group velocity of the periodic wavetrain
 $V_t^{\textit{Cg,Euler}}$
(triangles); and (c)
 $V_h^{\textit{Approx,Euler}}$
(circles),
 $V_h^{\textit{Fitting,Whitham}}$
(solid line), and the group velocity
 $V_h^{\textit{Cg,Euler}}$
(squares). (d) A time-dependent progression of TDSW with
 $B=0.32$
, obtained from (3.2). For definitions of the velocity symbols, please refer to table 1.

In figure 8(b), the travelling-wave edge velocity is predicted based on the group velocity of the periodic wavetrain appearing in the pulse, denoted as
 $V_t^{\textit{Cg,Euler}}$
. The dimensionless group velocity is expressed as follows:
 \begin{align} C_g = \frac {\left (k + B k^3\right ) \text{sech}^2(k)+\left (1 + 3 B k^2\right ) \tanh (k)}{2 \sqrt {k \left (1 + B k^2\right ) \tanh (k)}}, \end{align}
where
 $k$
is extracted from the periodic wavetrain. Although the predicted velocity is slightly higher than the actual velocity, it effectively captures the trend of velocity variation in response to changes in the Bond number. According to Whitham (Reference Whitham1999), in a non-uniform wavetrain, different wavenumbers propagate with their respective group velocities. On the left-hand side of the travelling-wave edge, the wavenumber remains constant, while on the right-hand side, it increases continuously. When one moves with the group velocity at the travelling-wave edge, the same local wavenumber and frequency can be observed. Meanwhile, the wave crests continue to pass, suggesting that the region of the uniform periodic wavetrain is expanding. This may provide an understanding that
 $V_t^{\textit{Approx,Euler}}$
is approximately equal to the local group velocity
 $V_t^{\textit{Cg,Euler}}$
.
In figure 8(c), the velocity of the harmonic-wave edge is analysed using the DSW fitting method applied to (4.1), although the validity of this method was not thoroughly examined in the TDSW region. The prediction becomes less accurate near the crossover region (as
 $B\rightarrow 0.29$
). Nevertheless, as the Bond number increases, the prediction generally provides a reasonable approximation, particularly as the solution gradually transitions from TDSW to IRDSW. Additionally, we extract the wavenumber at the harmonic-wave edge and calculate the corresponding group velocity,
 $V_h^{\textit{Cg,Euler}}$
, according to (4.15), which closely matches
 $V_h^{\textit{Approx,Euler}}$
.
The analyses and comparisons indicate that the high platform and its extended uniform wavetrain within the TDSW represent a part of a solitary wave characterised by an oscillatory pulse. In other words, the TDSW illustrates the modulation process that transitions from a solitary wave with an oscillatory pulse to smaller periodic waves through a horn-shaped wavepacket that gradually lengthens over time. In this regard, the observed patterns are fundamentally similar to those found in the RDSW and IRDSW regions.
4.4. Modulation parameters in TDSWs
Recall that the Whitham modulation equations (2.7) and (2.16) are essentially derived using the Stokes expansion. Considering the variety of periodic waves present in the TDSW structure, this approach aids in predicting the modulation parameters in the TDSW process. These parameters include the wavenumber
 $k$
, the amplitude of the periodic wave
 $a$
, and the wave mean
 $b$
.
It is noted that the rescaled modulation equations can be obtained by simply setting
 $h_0=g=1$
and replacing
 $\tau$
with
 $B$
. By utilising the shallow-water assumption, where
 $\phi _x=\eta$
, we establish a relationship between the mean flow and the wave mean, given by
 $b=\beta$
. The remaining parameters in this problem are
 $a$
,
 $k$
and
 $b$
. The first equations in (2.7) and (2.16) describe the modulation of the wavenumber
 $k$
and the amplitude
 $a$
. On the other hand, the changes in the wave mean
 $b$
can be explained by the second equations in (2.7) and (2.16), which are identical when considering the higher-order terms in the modulation. We combine the second equations in (2.7) and (2.16) into a single equation by applying appropriate weights in our numerical simulations. This operation aims to maintain the average value of the wave mean
 $b$
at the desired level. It should be noted that relying solely on either the second equation in (2.7) or the second equation in (2.16) would result in a discontinuity at
 $x=0$
, leading to incorrect results. To facilitate comparison, we present our findings in the moving reference frame
 $x-t$
. Thus the governing modulation equations can be rewritten as
 \begin{align} \begin{aligned} &\frac {\partial }{\partial t}\left (\frac {E}{\omega _0}\right )+\frac {\partial }{\partial x}\left [(c_g-1)\frac {E}{\omega _0}\right ]=0,\\&\frac {\partial k}{\partial t}+\frac {\partial (\omega -k) }{\partial x}=0,\\ &\frac {\partial b}{\partial t}+\frac {1}{\alpha _1+\alpha _2}\frac {\partial }{\partial x}\left [\alpha _1bh+\alpha _1\frac {E}{c_p}+\alpha _2\gamma -(\alpha _1+\alpha _2)b\right ]=0, \end{aligned} \end{align}
where
 $\alpha _1$
and
 $\alpha _2$
are the weights to be determined later. We extract the values of
 $a$
,
 $k$
and
 $b$
from the TDSW numerical results, using parameters
 $\epsilon =0.05$
,
 $B=0.32$
and
 $t=5000$
. We establish the initial condition for (4.16) as follows:
 \begin{align} (a,k,b)(x,t=0) = \begin{cases} (a_l,k_l,b_l), & x\lt 0,\\ (0,k_r,0), & x\geqslant 0, \end{cases} \end{align}
where
 $a_l$
,
 $k_l$
and
 $b_l$
represent the mean values of the corresponding parameters within the region
 $x\in (220,320)$
in the simulation at
 $t=5000$
, and
 $k_r$
denotes the maximum value of the wavenumber extracted from the TDSW numerical result. We employ an algorithm inspired by the Roe scheme to numerically solve (4.16) with the initial condition (4.17):
 \begin{align} \begin{aligned} &u_j^{n+1}=u_j^{n}-\frac {\Delta t}{\Delta x}\left (\hat {f}_{j+\frac {1}{2}}^n-\hat {f}_{j-\frac {1}{2}}^n\right )\!,\\&\hat {f}_{j+\frac {1}{2}}^n= \begin{cases} f(a_j,k_j,b_j),&\theta _{j+\frac {1}{2}}\geqslant 0,\\ f(a_{j+1},k_{j+1},b_{j+1}),&\theta _{j+\frac {1}{2}}\lt 0, \end{cases}\\ &\theta _{j+\frac {1}{2}}=\frac {f(a_{j+1},k_{j+1},b_{j+1})-f(a_j,k_j,b_j)}{u(a_{j+1},k_{j+1},b_{j+1})-u(a_j,k_j,b_j)}\!, \end{aligned} \end{align}
where
 $u$
represents the parameters
 $E/\omega _0$
,
 $k$
and
 $b$
, while
 $f$
denotes the corresponding fluxes. The notation
 $j$
refers to the value at the discrete point
 $x_j$
, and
 $n$
indicates the
 $n$
th time step. This scheme effectively eliminates most of the non-physical oscillations caused by the discontinuous initial data. In our simulations, we set
 $\alpha _1=3$
and
 $\alpha _2=8$
in (4.16), and present the results for the amplitude squared
 $a^2$
, which is proportional to the energy
 $E$
.
The comparison between the solutions to the modulation (4.16) and the parameters derived from the full Euler simulations using smoothed step initial data is presented in figure 9(a–c), demonstrating excellent agreement. High-order modulation theory is essential when considering small oscillations in wave parameters and minor discrepancies between the modulation solutions and the full Euler results; however, this topic is beyond the scope of this discussion. As we derive predictions for the key wave parameters (
 $a$
,
 $k$
and
 $b$
), we can also forecast wavepacket behaviour in the TDSW region using
 $a+b$
and
 $-a+b$
, as illustrated in figure 9(d). The results indicate a remarkable alignment, suggesting that TDSWs may be viewed as the modulation process of periodic wavetrains in these cases.
Numerical results for the TDSW compared with the predictions from the Whitham modulation equations under the conditions
 $\epsilon \eta =0.05$
,
 $B=0.32$
and
 $t=5000$
. The comparison includes: (a) amplitude squared
 $a^2$
, (b) wavenumber
 $k$
, (c) wave mean
 $b$
, and (d) wavepacket as predicted by the Whitham theory and observed in the TDSW simulation. The blue circles/line represent the results from the TDSW simulation using (3.2), while the red solid lines correspond to the Whitham modulation theory for (4.16).

5. Bifurcation and stability of solitary waves with oscillatory pulses
As previously discussed, there is a significant relationship between solitary waves with oscillatory pulses and TDSWs. Therefore, further investigation into the bifurcation mechanism of this type of solitary wave is worthwhile. Our study begins at the Bond number
 $B=1/3$
, where the third-order term in the Taylor expansion of the linear dispersion relation
 $\omega ^2=(1+Bk^2)k\tanh k$
vanishes, making the fifth-order term the primary dispersive effect. In classical studies of gravity-capillary solitary waves, a pendant-shaped bubble forms when the amplitude of the solitary wave approaches unity, which occurs at a low velocity
 $c=0.161$
, as illustrated in figures 10(a) and 10(b). However, the situation differs when examining solitary waves with oscillatory pulses. The bifurcation diagrams for solitary waves featuring three, five, seven and nine troughs in the pulses, along with typical wave profiles, are depicted in figure 10(c–j). As the wave amplitude increases, the crests in the solitary pulse approach the zero level. Finally, we found it challenging to continue the bifurcation branch using the Newton–Raphson method when multiple, nearly identical, and well-separated oscillations appear at the core centre. At this stage, the solutions become very sensitive (presumably because the waves are far apart, making their separation sensitive to perturbations), and achieving more accurate computations becomes impractical. Notably, these bifurcation curves, although ending at slightly different points, can overlap, indicating that the number of periodic oscillations in the centre can increase while maintaining the same amplitude and speed.
Solitary waves derived from (3.6), which have a varying number of troughs at the core, for
 $B=1/3$
. (a,c,e,g,i) Bifurcation diagrams with one, three, five, seven and nine troughs, respectively. (b,d,f,h,j) Wave profiles corresponding to the red dots on the bifurcation curves.

Another intriguing issue to consider is whether the bubble structure persists in the case of solitary waves with oscillatory pulses, and indeed, it does. A bubble forms if the self-intersecting structure develops before the wave crest reaches the horizontal level, as illustrated in figure 11. Notably, the central bubble forms before the adjacent bubbles at the Bond number
 $B=0.04$
. Further analysis reveals that as many as eleven bubbles can emerge, forming a multi-bubble surface profile at the Bond number
 $B=0.1$
, as depicted in figure 12. It is noteworthy that a similar overhanging structure in periodic waves is also observed in the low Bond number regime, as reported by Shelton, Milewski & Trinh (Reference Shelton, Milewski and Trinh2021).
Solitary waves derived from (3.6), which contain multiple trapped bubbles, examined for Bond number
 $B=0.04$
. (a) The bifurcation curve of solitary waves featuring three troughs at the core, along with typical profiles (
 $\eta (0)=-0.3195$
and
 $\eta (0)=-0.3285$
). The phase speed minimum
 $c=0.6324$
is indicated by a vertical dashed line, and the bifurcation branch exists below this threshold. (b,c) The wave profiles at
 $c=0.6200$
and
 $c=0.4678$
, respectively.

Solitary waves obtained from (3.6), which contain multiple trapped bubbles, analysed for Bond number
 $B=0.1$
. (a) The bifurcation curve of solitary waves with eleven troughs, providing details regarding the overhanging structure. Solitary waves exist at speeds below the minimum phase speed
 $c=0.7937$
(indicated by the vertical dashed line). (b,c) The wave profiles at
 $c=0.7700$
and
 $c=0.4919$
, respectively.

The fifth-order KdV equation can effectively describe the behaviours of small- to moderate-amplitude gravity-capillary waves within the full Euler system as the Bond number approaches
 $1/3$
. Sprenger & Hoefer (Reference Sprenger and Hoefer2020) demonstrated the existence of solitary waves with oscillatory pulses in the context of the fifth-order KdV equation. However, findings from the Euler equations indicate that these wave structures can exist over a broader range of Bond numbers, not just near
 $1/3$
. It is well known that the existence of wavepacket solitary waves requires a global extremum in the linear dispersion relation at a finite wavenumber, where the group velocity equals the phase velocity. This evidence highlights the significance of
 $B=1/3$
in the study of gravity-capillary waves. In the case of solitary waves with oscillatory pulses, as shown in figure 13, the relationship between the Bond number and
 $1/3$
is not a definitive criterion for determining the existence of this type of solitary wave. However, there is a distinction in the bifurcation behaviour associated with different Bond numbers. In figures 10 and 13, solitary waves bifurcate from a zero amplitude, and the wave profile exhibits a uniform wavetrain in the pulse for all speeds. As the wave speed approaches the limiting point of the bifurcation curve, the oscillations in the central region appear to separate from each other while keeping their trough amplitudes consistent. In contrast, for
 $B\lt 1/3$
, as shown in figures 11 and 12, solitary waves with oscillatory pulses bifurcate from a finite amplitude, and the wave profile features a non-uniform wavetrain at the centre. As the amplitude increases, a series of bubbles forms; however, the trough amplitude varies along the wavetrain.
(a) The ‘speed–amplitude’ bifurcation diagram of solitary waves with three troughs at the core centre, obtained from (3.6) with
 $B=0.35\gt 1/3$
. (b,c) The wave profiles for
 $c=0.9947$
and
 $c=0.7943$
, respectively.

(a) Monotonic ‘speed–energy’ bifurcation curves of solitary waves with one (blue line), two (red line), three (yellow line), four (purple line) and five (green line) troughs, predicted by (5.2). (b) A comparison between solitary waves with one to five troughs with
 $\min \eta =-0.05$
, obtained from (3.6) for
 $B=1/3$
.

Based on the Hamiltonian formulation of free-surface water waves established by Zakharov (Reference Zakharov1968), Saffman (Reference Saffman1985) demonstrated that the stability exchange of periodic waves in deep water can occur only at stationary points of total energy when considering superharmonic perturbations. A similar conclusion was reached by Zufiria & Saffman (Reference Zufiria and Saffman1986) for periodic gravity waves on water of finite depth. As pointed out in Saffman’s pioneering work, this argument can be easily extended to include the surface tension term without significant modifications.
The total energy for the gravity-capillary wave system is the sum of kinetic and potential energies, expressed as
 \begin{align} E=\frac {1}{2}\int _{-\infty }^{\infty }{\rm d}x\int _{-1}^{\eta }\big (\phi _x^2+\phi _y^2\big ){\rm d}y+\frac {1}{2}\int _{-\infty }^{\infty }\eta ^2\,{\rm d}x+B\int _{-\infty }^{\infty }\Big (\sqrt {1+\eta _x^2}-1\Big ){\rm d}x. \end{align}
In the transformed plane, the total energy is represented as
 \begin{align} E=\frac {1}{2}\int _{-\infty }^{\infty }\left [\varPsi \varphi _\xi +Y^2X_\xi +2B\left (\sqrt {X_\xi ^2+Y_\xi ^2}-X_\xi \right )\right ]{\rm d}\xi . \end{align}
We calculate the total energy in the original static coordinate frame rather than in the moving frame. Figure 14(a) illustrates the monotonic relationship between wave speed and energy for solitary waves with one to five troughs in the pulses when
 $B=1/3$
, suggesting that there is no stability exchange for solitary waves with oscillatory pulses. Figure 14(b) demonstrates that the number of oscillations at the centre can grow indefinitely without affecting the waveform at the edge. A linear stability analysis is conducted to assess the stability property of the entire monotonic branch. This involves linearising the full Euler equations around a solitary-wave solution, and numerically solving the matrix eigenvalue problem after discretisation. Details regarding the linearisation process and the eigenvalue problem can be found in Appendix A. For those interested in further information, please refer to Wang (Reference Wang2016). For all the waves that we tested (
 $B=1/3$
), no instability was detected; the maximum value of the real part of the eigenvalue is less than
 $6.368\times 10^{-4}$
.
Time evolutions of solitary waves with oscillatory pulses, simulated with (3.2) and
 $B=1/3$
: (a) evolution of an exact solitary wave with ten troughs from
 $t=0$
to
 $t=200$
; (b) evolution of a perturbed solitary wave (with 10 % amplitude decrease initially) from
 $t=0$
to
 $t=200$
; (c) a head-on collision between solitary waves with three and seven troughs from
 $t=30$
to
 $t=70$
. (d,e,f) Snapshots at
 $t=500$
corresponding to (a,b,c), respectively.

The dynamics of solitary waves, including the long-term evolution of unstable waves and collisions between stable ones, is another important topic related to water-wave instability, which has been studied recently e.g. by Wilkening (Reference Wilkening2015, Reference Wilkening2020). Figure 15 illustrates the dynamic results of direct numerical simulations of solitary waves with oscillatory pulses. It shows the evolution of a single wave, how it responds to a perturbation, and its behaviour during a collision. The results indicate that the primary structure of the wave can be sustained over an extended period, suggesting that these waves are stable travelling-wave solutions.
In summary, we examine the stability and dynamics of solitary waves with oscillatory pulses by employing Saffman’s theory, conducting linear stability analysis, and performing time-dependent simulations. For
 $B=1/3$
, our research covers the evolution of three scenarios: an undisturbed travelling wave, a perturbed solitary wave, and a head-on collision. Given the stable nature of solitary waves with oscillatory pulses near
 $B=1/3$
, our analyses yield indirect evidence explaining the manifestation of TDSWs in the Gurevich–Pitaevskii problem of the gravity-capillary water-wave equations. This finding also emphasises the necessity for further research to enhance our understanding of the resonance mechanism between solitary and periodic waves.
6. Conclusion
In this paper, we explored DSWs in free-surface water waves while considering the effects of both gravity and surface tension within the framework of the fully nonlinear Euler equations. The Whitham modulation theory was applied to the fully nonlinear Euler equations to predict modulation parameters (wavenumber, amplitude and wave mean) in the TDSW region. To validate the Whitham modulation theory, we performed numerical simulations of DSWs using a time-dependent conformal mapping technique for the full Euler equations.
The DSWs were classified into four categories based on their structural characteristics: RDSW, crossover region, TDSW and IRDSW, each associated with distinct Bond numbers. We began by numerically extracting and predicting the velocities of both the harmonic-wave and solitary-wave edges using the DSW fitting method in the RDSW and IRDSW regions. We then compared the classical solitary waves with the solitary-wave edges of DSWs to gain a deeper understanding of the potential connection between these two nonlinear dispersive wave phenomena. To explain the formation of infinitely extended periodic wavetrains in the TDSW structure, we computed solitary waves with oscillatory pulses. The numerical results indicate that DSWs undergo a modulation process that transitions from solitary waves to periodic waves in the RDSW, IRDSW and TDSW regions. Among these, the TDSW is particularly noteworthy since it features a special type of gravity-capillary solitary wave. Specifically, the TDSW structure is effectively modulated from solitary waves with oscillatory pulses into periodic waves, and the oscillation in the central part of the solitary wave can extend infinitely, which helps to elucidate the formation of periodic wavetrains in the TDSW region. We also theoretically predicted edge velocities in the TDSW region by drawing an analogy with the velocities of solitary waves with oscillatory pulses for solitary-wave edges, as well as calculating group velocity with a specific wavenumber for both the travelling-wave and harmonic-wave edges. Finally, we investigated the bifurcation behaviour and linear stability of solitary waves with oscillatory pulses, identifying a series of bubbles that appears in the limiting cases for relatively small Bond numbers.
Acknowledgements
The authors would like to thank M. Ahmat (Xinjiang University) and X. Cai (Beijing Normal University) for their assistance with the WENO scheme for dispersion-type equations.
Funding
This work was supported by the National Science Foundation of China (nos 12325207, 42450111), and the International Partnership Programme of the Chinese Academy of Sciences (no. 025GJHZ2024047GC).
Declaration of interests
The authors report no conflict of interest.
Appendix A. Linear stability analysis of gravity-capillary solitary waves
The linear stability of solitary waves has been a subject of investigation since the work of Tanaka (Reference Tanaka1986), which focused on the stability of pure gravity waves in deep water within the framework of the full Euler equations. Following this, Calvo & Akylas (Reference Calvo and Akylas2002) extended this study by examining gravity-capillary solitary waves in deep water. In more recent research, Deconinck & Oliveras (Reference Deconinck and Oliveras2011) and Deconinck & Trichtchenko (Reference Deconinck and Trichtchenko2014) employed the Floquet theorem to analyse the stability of gravity-capillary periodic waves. For these studies, they leveraged travelling-wave solutions derived from the non-local formulation of the Euler equations, initially introduced by Ablowitz, Fokas & Musslimani (Reference Ablowitz, Fokas and Musslimani2006). Wang (Reference Wang2016) applied perturbation equations to explore the stability and dynamics of gravity-capillary solitary waves in deep water, including those that are asymmetric.
Following Tanaka (Reference Tanaka1986), Calvo & Akylas (Reference Calvo and Akylas2002) and Wang (Reference Wang2016), we consider small perturbations of a travelling-wave solution in the moving frame of reference, and express the free-surface displacement
 $\eta$
and the velocity potential
 $\phi$
as
 \begin{align} \eta (x,t)=\widetilde {\eta }+\widehat {\eta }(x)\,{\rm e}^{\lambda t},\quad \phi (x,y,t)=\widetilde {\phi }(x,y)+\widehat {\phi }(x,y)\,{\rm e}^{\lambda t}, \end{align}
where
 $\widetilde {\eta }(x)$
and
 $\widetilde {\phi }(x,y)$
represent an exact solitary-wave solution, and the hat terms denote small perturbations that are added to the solitary wave. After linearising the kinematic and dynamic boundary conditions, we obtain the following equations for
 $\widehat {\eta }$
and
 $\widehat {\phi }$
:
 \begin{align} \begin{aligned} \lambda \widehat {\eta }=&\left (\widetilde {\phi }_{yy}-\widetilde {\eta }_x\widetilde {\phi }_{xy}\right )\widehat {\eta }-\widetilde {\phi }_x\widehat {\eta }_x-\widetilde {\eta }_x\widehat {\phi }_x+\widehat {\phi }_y ,\\ \lambda \widehat {\phi }=&-\left (\widetilde {\phi }_{x}\partial _x+\widetilde {\phi }_{y}\partial _y\right )\widetilde {\phi }_{y}\widehat {\eta }-\left (\widetilde {\phi }_{x}\partial _x+\widetilde {\phi }_{y}\partial _y\right )\widehat {\phi }-\widehat {\eta }+\frac {B}{(1+\widetilde {\eta }_x^2)^{3/2}}\widehat {\eta }_{xx}-\frac {3B\widetilde {\eta }_x\widetilde {\eta }_{xx}}{(1+\widetilde {\eta }_x^2)^{5/2}}\widehat {\eta }_{x}. \end{aligned} \end{align}
Following Wang (Reference Wang2016), we rewrite the linear eigenvalue problem in the conformal domain as
 \begin{align} \begin{aligned} \lambda \widehat {\eta }=&\frac {c_0}{X_\xi }\frac {{\rm d}}{{\rm d}\xi }\left (\frac {X_\xi }{J} \right )\widehat {\eta }+\frac {c_0}{J}\frac {{\rm d}\widehat {\eta }}{{\rm d}\xi }-\frac {1}{X_\xi }\frac {{\rm d}\boldsymbol{T}[\widehat {\phi }]}{{\rm d}\xi },\\ \lambda \widehat {\phi }=&-\left [\frac {c_0^2}{J}\frac {{\rm d}(Y_\xi /J)}{{\rm d}\xi }+1\right ]\widehat {\eta }+\frac {B}{X_\xi } \frac {{\rm d}}{{\rm d}\xi }\left (\frac {X_\xi ^2}{J^{3/2}}\frac {{\rm d}\widehat {\eta }}{{\rm d}\xi }\right )+\frac {c_0}{J}\frac {{\rm d}\widehat {\phi }}{{\rm d}\xi }, \end{aligned} \end{align}
where
 $c_0=c-\mathcal{U}$
denotes the translating speed of the undisturbed solitary wave relative to the mean horizontal velocity of the flow,
 $Y(\xi )=\widetilde {\eta }(x(\xi ,0))$
,
 $X_\xi =1-\boldsymbol{C}[Y_\xi ]$
and
 $J=X_\xi ^2+Y_\xi ^2$
. The pseudo-differential operators
 $\boldsymbol{C}$
and
 $\boldsymbol{T}$
are defined as
 \begin{align} \begin{aligned} &\boldsymbol{C}[f]=\mathcal{F}^{-1}\left [\mathrm{i}\coth (kh_c)\mathcal{F}[f]\right ]|_{k\neq 0},\\ &\boldsymbol{T}[f]=\mathcal{F}^{-1}\left [\mathrm{i}\tanh (kh_c)\mathcal{F}[f]\right ]|_{k\neq 0}, \end{aligned} \end{align}
where
 $\mathcal{F}$
and
 $\mathcal{F}^{-1}$
are the Fourier and inverse Fourier transforms, respectively. This eigenvalue problem is discretised at uniform grid points within a periodic domain to ensure consistency. The derivative operator, the
 $\boldsymbol{C}$
-transform and the
 $\boldsymbol{T}$
-transform are approximated using discrete spectral matrices. According to Tanaka (Reference Tanaka1986), the eigenvalues of this problem always appear in pairs
 $(\lambda ,-\lambda ,\lambda ^*,-\lambda ^*)$
, where the asterisk denotes complex conjugation. Therefore, we can consider the solitary wave to be temporally stable if the real parts of all eigenvalues are below a specified threshold.
To validate our numerical algorithm, we compared the results generated by our program with those reported by Calvo & Akylas (Reference Calvo and Akylas2002) and Wang (Reference Wang2016) for the deep-water case. Under the assumption of deep water, the
 $\boldsymbol{C}$
-transform reduces to the Hilbert transform, which is characterised by the Fourier symbol
 $\mathrm{i}\,\text{sgn}(k)$
, while
 $\mathcal{U}=0$
. For the values of
 $c$
, specifically 1.4004, 1.3512 and 1.2574, the growth rates of the most unstable mode are 0.009, 0.0154 and 0.01095 after conversion to the scaling used in Calvo & Akylas (Reference Calvo and Akylas2002). In contrast, Calvo & Akylas (Reference Calvo and Akylas2002) reported growth rates 0.009, 0.0153 and 0.0077, while Wang (Reference Wang2016) presented growth rates 0.009, 0.0154 and 0.01096.
(a) The bifurcation diagram of the elevation branch and a typical wave profile, calculated using (3.6) with
 $B=0.22$
. (b) The linear growth rate curve derived from (A3). (c) The most unstable eigenmode (
 $\widehat {\eta }, \widehat {\phi }$
) for the wave indicated by a red circle in (a). (d,e) Comparisons between linear theory (dashed lines) and nonlinear evolution (solid lines) at
 $t=126$
and
 $t=165$
. The unsteady simulation is based on (3.2), with the reference frame moving to the right at the speed of the undisturbed solution.

To validate our code for water of finite depth, we tested it using an elevation solitary wave with Bond number 0.22, as illustrated in figure 16. In figure 16(a), the bifurcation diagram of the elevation branch for
 $B=0.22$
is presented, with a vertical dashed line marking the bifurcation point corresponding to the minimum phase speed
 $c=0.9487$
. The inset displays a typical wave profile associated with the red circle on the bifurcation curve, under the parameters
 $\eta (0)=0.024$
and
 $c=0.9243$
. Figure 16(b) shows the linear growth rate curve, which directly indicates the instability of elevation solitary waves, while figure 16(c) gives the most unstable eigenmode corresponding to the red circle in figure 16(a):
 $\widehat {\eta }$
and
 $\widehat {\phi }$
. Figure 16(d,e) compare the linear theory (dashed lines) and nonlinear evolution (solid lines) at times
 $t=126$
and
 $t=165$
, respectively. For the elevation solitary wave identified by the red circle in figure 16(a), the linear growth rate is
 $\lambda =0.0181$
. The initial amplitude of
 $\widehat {\eta }$
is set to 0.001, and by
 $t=126$
and
 $t=165$
, the perturbation amplitude is increased by a factor of 10 and 20, respectively. All snapshots in figure 16(d,e) are shown in a reference frame moving rightwards at the speed of the undisturbed solitary wave. The comparison between the predictions from linear theory and the results from nonlinear evolution supports the validity of our linear stability analysis.
The linear growth rate
 $\mathrm{Re}(\lambda )$
as a function of wave speed for solitary waves with (a) three, (b) five and (c) seven troughs, obtained by solving (A3) with
 $B=1/3$
. (d) A solitary wave with three troughs along with its time evolution. (e) Mass error as a function of
 $t/T$
. (f) Energy error as a function of
 $t/T$
. The unsteady simulation is conducted using (3.2).

Figure 17 examines the linear stability and long-term evolution characteristics of solitary waves with oscillatory pulses. The linear growth rate of solitary waves when
 $B=1/3$
, represented as
 $\mathrm{Re}(\lambda )$
, is displayed in figure 17(a–c) for three different mesh sizes: 512 (circles), 1024 (squares) and 2048 (triangles). This analysis examines three types of solitary waves: (a) the three-trough wave, (b) the five-trough wave, and (c) the seven-trough wave, with propagating speeds ranging from 0.824 to 0.988. The results from the linear stability analysis indicate that the growth rates remain below
 $6.368\times 10^{-4}$
, suggesting that the solitary waves with oscillatory pulses for
 $B=1/3$
are linearly stable against small longitudinal perturbations. Additionally, figure 17(d) compares the time-dependent results with the solitary-wave solution at an evolution time
 $t=100T$
, where
 $T=L/c$
, with
 $L=160$
the length of the simulation domain, and
 $c=0.972$
the solitary wave speed. To assess the numerical conservation of the scheme, the corresponding mass and energy errors during the simulation are presented in figures 17(e) and 17(f). Throughout the entire evolution process, both the mass and energy errors remain low, confirming the stability of solitary waves with oscillatory pulses.
Finally, we numerically solved the eigenvalue problem for the solitary waves illustrated in figure 7. The growth rates of these waves are all below
 $1.285\times 10^{-4}$
, which indicates that the solitary waves with oscillatory pulses remain stable over a wide range of Bond numbers.