When one party gains control of the US national government – controlling the presidency and both chambers of Congress – it is more likely to be able to implement its policy agenda, either by passing legislation or via unilateral action by the president. In the American system of federalism, this partisan context can have important implications for state politics. Unlike the national government, which often experiences stretches of divided partisan control punctuated by occasional but brief instances of unified government, states are often fully controlled by one party or the other (Greenblatt Reference Greenblatt2019). With their national party counterparts no longer able to meaningfully control the policy agenda and the majority having little incentive to consider the policy goals of those in the minority, state governments controlled by the national out-party face a threatening scenario. Not only are their party's policies no longer being pursued at the national level, but counterpartisan actions by the majority may threaten their own policy priorities. This scenario provides an impetus for aggressive state-level action, along partisan lines, by those state governments with the ability to respond.
Tensions between the national government and the states are nothing new, as American federalism allows – if not openly invites – these clashes. Intergovernmental conflict is common in the United States because the constitution is purposely ambiguous in the division of powers between national and state government (Olson, Callaghan and Karch Reference Olson, Callaghan and Karch2017; Robertson Reference Robertson2012). State resistance to federal policy has often been bipartisan and occurs on issues that produce natural tensions between the national and state levels, such as the nationalization of state policies (such as Medicare and Medicaid, No Child Left Behind) and unfunded mandates (for example, food stamps) (Olson, Callaghan and Karch Reference Olson, Callaghan and Karch2017). However, over the last decade, national–state policy clashes have heightened in both volume and intensity (Olson, Callaghan and Karch Reference Olson, Callaghan and Karch2017). Increased polarization, policy variation and party control of government have contributed to greater state policy activism (Grumbach Reference Grumbach2018). States have responded to the policy actions of the federal government in a number of ways, including most prominently with legal challenges to the passage of the 2010 Affordable Care Act (‘Obamacare’) and to enforcement of immigration laws (Krane Reference Krane2007).
In this article, we examine how the balance of national partisan control influences state policy activism. Specifically, do states with unified partisan control pursue their policy agendas more forcefully when the opposing party exercises tighter control over the levers of national power in Washington? While a sizable literature has examined the effects of state partisan control on ideological policy outcomes (Caughey, Warshaw and Xu Reference Caughey, Warshaw and Xu2017; Lax and Phillips Reference Lax and Phillips2011), these studies have not explored how national politics may condition these effects. Furthermore, previous work on federal–state relations has largely focused on states' responses to specific federal policies (for example, Barrilleaux and Rainey Reference Barrilleaux and Rainey2014; Rigby Reference Rigby2012; Shelly Reference Shelly2008) rather than broader changes to a state's overall policy orientation.
We argue that state governments controlled by the national out-party should be more active in pushing state policy in their preferred ideological directions during periods of partisan misalignment, when the threat of counterpartisan action at the national level is highest. To test our expectation, we examine whether the national political context conditions the policy making of states with unified partisan control. Thus we examine policy liberalism in the aggregate and posit that the misalignment in partisan control between national and state government influences the behavior of state policy makers, leading to a bottom-up response to enact more ideologically distinct policies during these periods of tension. Specifically, we expect states with unified partisan control to produce more ideologically liberal (conservative) policies during periods of partisan misalignment and less ideologically liberal (conservative) policies during periods of non-misalignment, when the national government implements favored policies or mitigates actions the party opposes.
To test these expectations, we use Caughey and Warshaw's (Reference Caughey and Warshaw2016) dynamic measure of state policy liberalism to examine changes in the ideological variation of state policy from 1974 to 2019, a period during which the national government began shifting between unified and divided partisan control. We find that both Republican- and Democratic-controlled states have pushed state policy further in their preferred ideological directions when the opposing party has greater control over the national policy agenda in Washington, particularly when the opposing party has unified control of the presidency and both chambers of Congress. This is primarily a contemporary phenomenon, emerging in the more politically polarized era since the mid-1990s. Given that state governments are far more likely to operate under unified government than their national counterparts, these findings have important implications. Not only do they increase our understanding of state policy making; they also tap into the relationship between the federal and state governments, and enhance our understanding of how party competition and the changing context of American politics influence states’ motivation and ability to pass their preferred policies.
Previous Work on Federal–State Relations
Previous research on federal–state interactions has examined different aspects of the relationship, including how states – or citizens of states – react to national policies (Nicholson-Crotty Reference Nicholson-Crotty2012; Soss et al. Reference Soss2001). Others have focused on how states have become more active in formulating policies in response to federal actions, as well as why tensions between the state and federal government have increased. Arguably, the inflection point of contemporary tension between the national government and the states occurred during the presidency of George W. Bush. President Bush brought an end to the ‘Devolution Revolution’ that had returned much power and discretion to the states. Instead, the Bush administration's expansive use of the federal government to centralize and nationalize policies such as No Child Left Behind, the REAL ID Act, and Temporary Assistance for Needy Families motivated states to respond with both legal and legislative action (Krane Reference Krane2007; Shelly Reference Shelly2008). However, scholars who have examined federal–state relations during the Bush presidency found that state resistance was not necessarily partisan; both Republican- and Democratic-controlled states opposed policies like No Child Left Behind and the REAL ID Act on the grounds of federal intrusion into state domains rather than due to purely partisan or ideological disagreements (Krane Reference Krane2007).
Moreover, some scholars predicted that states would be hesitant to take such measures in the future and would only do so in exceptional situations (for example, Shelly Reference Shelly2008). However, heightened polarization and policy overlap are two important trends that have led to greater tensions between the national government and the states, and thus to an increase in the number of state challenges to federal policy (Bulman-Pozen Reference Bulman-Pozen2014; Olson, Callaghan and Karch Reference Olson, Callaghan and Karch2017). The current era of federal–state relations is portrayed as ‘partisan federalism’ because states have become a forum for partisan fights, since those governed by the opposite party to that of the national government offer an avenue to address federal policy grievances (Bulman-Pozen Reference Bulman-Pozen2014; Olson, Callaghan and Karch Reference Olson, Callaghan and Karch2017). Under this condition, federalism provides an institutional framework for partisan identification when a party is out of power at the national level, and allows political actors to augment competition between the political parties (Bulman-Pozen Reference Bulman-Pozen2014).
As the literature on ‘partisan federalism’ indicates, partisanship has become a dominant force in federal–state relations. This is most attributable to the emergence of ideologically cohesive, polarized parties at both levels of government. At the national level, the two main parties have become more internally cohesive but more differentiated from each other. These factors, along with increased party competition for the presidency and control of Congress, have amplified the level of conflict (Layman, Carsey and Horowitz Reference Layman, Carsey and Horowitz2006; Lee Reference Lee2015). Some studies contend that ideological polarization has increased equally in both parties, based on factors such as more partisan candidates, increased power of party leaders, greater influence of activists in party affairs, and a lack of attentiveness or indifference by uninformed voters (Cox and McCubbins Reference Cox and McCubbins2005; Layman, Carsey and Horowitz Reference Layman, Carsey and Horowitz2006). However, other work posits that the process is asymmetric – that the Republican Party is primarily responsible for increased ideological polarization. This is due to the growing strength of the ideological conservative movement and the disproportionate pressure placed on elected Republicans to adhere to conservative principles (Grossman and Hopkins Reference Grossman and Hopkins2016).
While similar factors explain hyperpolarization at both the state and federal levels, past research has also focused on theories related to voters, interest groups and institutional incentives to explain the effects of partisanship on state policies (Grumbach Reference Grumbach2018). Some research has noted the diverging preferences of the median voter due to polarizing attitudes in the mass public (Abramowitz Reference Abramowitz2010) and geographical sorting among the electorate (Bishop Reference Bishop2009). Other work, though, gives little credence to voters affecting polarization because state elected officials are unlikely to be responsive to voters who they believe pay little attention to state politics in favor of focusing on a national political agenda (Grumbach Reference Grumbach2018; Hopkins Reference Hopkins2018). Institutional incentives also speak to changing state policies and most directly ties the consequences of state-level hyperpartisanship to national-level events. Grumbach (Reference Grumbach2018, 418) notes that national-level polarization may increase state policy polarization because states act as ‘safety valves’ for special interests when their demands are unsuccessful in Washington, and observes that ‘this safety valve grows more valuable as polarization increases.’
Changing institutional incentives because of polarization have also redefined governors’ roles and perceptions. Jensen (Reference Jensen2017) argues that governors' role in the federal arena has traditionally been bipartisan, but that the era of partisan polarization has not spared the main state executive. Governors are increasingly partisan, focusing on decisions that benefit their party and cannot be easily undone by Washington. Research has shown this to be the case for specific policy positions and public perceptions (Barrilleaux and Rainey Reference Barrilleaux and Rainey2014; Brown Reference Brown2010).
Many studies have explored the ability to govern and implement policies at the national level, either via unified party control or in the context of divided government (for example, Krehbiel Reference Krehbiel1996; Mayhew Reference Mayhew2005). Moreover, as noted above, research on state responses to federal action has often focused on specific policy areas or particular decisions. Largely missing from the federalism literature is work that more broadly captures the behavior of state governments – particularly those with unified partisan control – in response to party control of the national government. Certainly, states have used their own discretion when implementing federally mandated policies. For instance, they have refused to recognize or enforce federal law, nullified federal laws (such as Obamacare) or filed lawsuits to stop the implementation of federal policies. While legal challenges or non-enforcement action against federal policy is often immediate, dramatic and newsworthy, state legislative action may be a more effective and durable response.
Partisan Misalignment and State Policy Making
When one party gains unified control of the country's national governing institutions, controlling the presidency and both chambers of Congress, partisan interests increase the prospects of actually carrying out their policy agenda. While legislative gridlock can still occur during these periods of unified government (Krehbiel Reference Krehbiel1996; Krehbiel Reference Krehbiel1998), it is less likely to occur than under divided government (Binder Reference Binder1999; Binder Reference Binder2014).
For the minority party, however, this scenario is deeply threatening. Not only are their policy priorities no longer being meaningfully pursued by Congress and the president, but existing programs that they support are at risk of being scaled back or repealed (Berry, Burden and Howell Reference Berry, Burden and Howell2010; Ragusa Reference Ragusa2010). For states controlled by the national out-party, these periods of what we refer to as ‘partisan misalignment’ – when one party has unified control at the state level while the other party maintains control at the national level – are especially problematic. As discussed above, key policy initiatives at the federal level often require the co-operation of states; the federal government has adopted more coercive tactics in recent decades to ensure compliance (Kincaid Reference Kincaid1990; Posner Reference Posner2007). States controlled by the national out-party are thus at increased risk of being pushed in a policy direction that cuts against their own partisan policy agenda.
We argue that states with unified partisan control, perhaps counterintuitively, will not arbitrarily push policy as far as they can in their preferred ideological direction. Instead, the effect of unified government is conditional on the balance of national partisan control, as the threat of counterpartisan action from Washington should provide an impetus for state policy activism. The extent of this activism is driven primarily by the mobilization of out-party voters and interest groups. As recent research has shown, voters have come to view the opposing party in an increasingly negative light (Abramowitz and Webster Reference Abramowitz and Webster2016; Iyengar, Sood and Lelkes Reference Iyengar, Sood and Lelkes2012). Thus when the opposing party gains unified control over the levers of national power, well-attuned and informed out-party voters and affiliated groups are likely to be angry, fearful and highly mobilized in response to the threat of federal action from the opposing party (for example, see Mason Reference Mason2013; Mason Reference Mason2018). This mobilization has been evident in congressional midterm elections. For instance, since 1974, four of the five largest net House losses for the president's party in midterm elections came during periods of unified government (1994, 2006, 2010 and 2018); all four of these elections broke the majority's unified control.Footnote 1 These elections have also often translated into sizable state legislative losses for the president's party (for example, see Daigneau Reference Daigneau2010; Rogers Reference Rogers2018).
This mobilization, in turn, puts pressure on legislators and executives in states where the out-party has control of government to act aggressively in resisting federal action and using their majorities to take bold action on the party's policy agenda, which might include codifying existing policy achievements as well as pursuing policies that have typically not been pursued at the state level. This motivation from state lawmakers can be observed with the following quote, taken from a joint statement by California legislative leaders, Senate President Pro Tempore Kevin de León (D-Los Angeles) and Assembly Speaker Anthony Rendon (D-Paramount), immediately following the 2016 election, in which the Republican Party took unified control of the federal government:
…California has long set an example for other states to follow. And California will defend its people and our progress. We are not going to allow one election to reverse generations of progress at the height of our historic diversity, scientific advancement, economic output, and sense of global responsibility… While Donald Trump may have won the presidency, he hasn't changed our values. America is greater than any one man or party. We will not be dragged back into the past. We will lead the resistance to any effort that would shred our social fabric or our Constitution… (de León and Rendon Reference de León and Rendon2016).
Thus Democratic lawmakers in California, who had held unified government since 2011, sent more bills to the governor's desk in 2018 than they had in over a decade. These bills included many ambitious steps on key Democratic policy issues, such as net neutrality, climate change, gun control, labor protections and gender equality (Myers Reference Myers2018).
Furthermore, state legislators are likely motivated to enact ambitious policy initiatives in response to interest groups and party activists who expect such a response to the change in partisan control at the national level. In this group-centric view of political parties, scholars argue that elected representatives are more beholden to the coalition of interest groups that have selected them to advance their policy goals than they are to constituents who often pay little attention to policy or ideological positions (Bawn et al. Reference Bawn2012). These interest groups are more extreme than average voters (Moon Reference Moon2004), and thus are likely to push state policy in a more ideological direction when their agenda is threatened.
Research has also demonstrated that both policy variation and policy polarization in the states have increased over the last 40 years. This policy variation is a consequence of the more divergent policy positions that states have staked out, which are specifically dependent on what party has control of government (Grumbach Reference Grumbach2018). As Grumbach (Reference Grumbach2018, 417) notes, ‘greater polarization implies greater distance between the policy preferences of Democrats and Republicans, and thus increasing polarization of policy outcomes in the states’. The result of both polarization and policy divergence is that there are greater incentives for interest groups to seek recourse at the state level and ‘venue shop’ for friendlier institutional settings for their policy priorities when they are stymied by gridlock at the national level or when the opposing party controls the levers of the federal government (Baumgartner and Jones Reference Baumgartner and Jones2010).
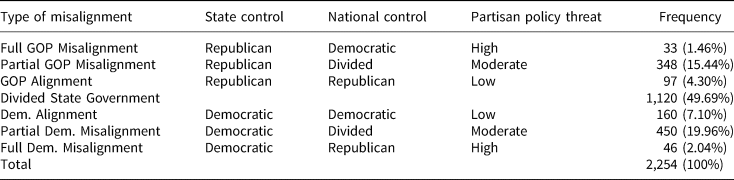
We posit that there are varying degrees of partisan misalignment, and that some scenarios are more threatening to state lawmakers than others. Table 1 outlines these different partisan arrangements. Partisan alignment presents a low policy threat for state lawmakers. In this scenario, unified state governments are working with a national government controlled entirely by co-partisans. Since their national counterparts maintain considerable control over the national policy agenda, the national government is pursuing policies that they, for the most part, are aligned with politically. This is unlikely to generate any meaningful co-partisan mobilization by their electoral constituencies. As a result, this low-threat scenario should not provoke a significant legislative response from state-level co-partisans, as they can cede much or some of the policy agenda to their national counterparts and use their state majorities to support federal policy changes (for example, Vock Reference Vock2016).
Types of partisan contexts, 1974–2019

Other scenarios, however, present the states with a far greater threat of partisan policy change from Washington. While full partisan misalignment is undoubtedly the most threatening scenario for state lawmakers and creates the ripest environment for state policy activism by generating an intense out-party mobilization, partial misalignment also presents a moderate threat. With both parties sharing control of the national policy agenda, divided government in Washington is largely marked by legislative gridlock (Binder Reference Binder1999; Binder Reference Binder2014). This arrangement enables party lawmakers to protect signature policies, as well as block the opposing party from enacting key elements of their legislative agenda. Examples in recent years include Senate Democrats and President Obama blocking congressional Republicans' repeated attempts to repeal the 2010 Affordable Care Act (Riotta Reference Riotta2017), as well as congressional Republicans preventing the passage of President Obama's legislative agenda after taking back the House in 2010 (Grunwald Reference Grunwald2016).
Nevertheless, partial partisan misalignment can still be potentially threatening for state lawmakers, as the need for compromise – particularly on pieces of must-pass legislation – can force them to make concessions to the opposing party, many of which have implications for state governments (for example, see Thiess Reference Thiess2013). Moreover, even during periods of divided government, the president can still act on his party's policy agenda with unilateral action, through executive orders, policy directives and even the creation of new government agencies (Howell Reference Howell2003; Howell and Lewis Reference Howell and Lewis2002). In sum, more threatening scenarios are more mobilizing for the national out-party and should produce greater motivation for state-level partisan action by the party that has control of government. This logic of policy threat informs our first hypothesis:
Hypothesis 1: States with unified partisan control will produce more ideological policies, ceteris paribus, when the threat of counterpartisan action at the national level is greater.
As previously discussed, American politics has become both increasingly polarized and competitive. These factors create an incentive for states governed by the national out-party to respond to the actions of the national government – a response that is possible because a state-level majority offers a viable alternative to the platform of the national majority party (Olson, Callaghan and Karch Reference Olson, Callaghan and Karch2017). The national minority party is less able to extract demands from the majority via compromise, thereby making the state policy arena an even more lucrative option (Grumbach Reference Grumbach2018). The increased focus on national politics incentivizes state lawmakers to offer clear policy alternatives (Hopkins Reference Hopkins2018).
A more polarized political environment exacerbates the effects of partisan misalignment because, as the parties drift further apart in terms of their policy prescriptions for the nation's problems (Layman, Carsey and Horowitz Reference Layman, Carsey and Horowitz2006), the prospect of the opposing political party having control of the national government becomes more threatening. Not only does the other party have control; their policy agenda is also antithetical to that of the minority party. Moreover, as the parties drive further apart ideologically, it reduces the ability of the national minority party to extract demands from the majority party via compromise, thereby making the state policy arena an even more lucrative option (Grumbach Reference Grumbach2018). This motivates our second hypothesis:
Hypothesis 2: States controlled by the national out-party will be more responsive to partisan misalignment, ceteris paribus, during periods of heightened polarization at the national level.
Methodology
The dependent variable in our analysis is the first difference of Caughey and Warshaw's (Reference Caughey and Warshaw2016) annual measure of state policy liberalism, which captures the year-over-year change in the ideological orientation of state policy. These estimates are derived from state policy outputs on roughly 150 policies between 1936 and 2019, covering issues such as abortion, criminal justice, education and gun control, among many others.Footnote 2 Caughey and Warshaw (Reference Caughey and Warshaw2016) used a Bayesian latent-variable model to develop annual ideology estimates of each state's policies, with higher values indicating more liberal policy and lower values signifying more conservative policies. We use this measure because it is the most complete measure available in terms of capturing broad changes in a state's ideological orientation over time. Other measures of state policy liberalism are cross-sectional, not time varying, and thus not suitable for a comprehensive examination of our research question (for example, Gray et al. Reference Gray2004; Sorens, Meudini and Ruger Reference Sorens, Meudini and Ruger2008; Wright, Erikson and McIver Reference Wright, Erikson and McIver1987).Footnote 3
Our full analysis covers the period from 1974 to 2019. We examine these decades for a number of reasons. Prior to this period, national politics was largely uncompetitive; the Democratic Party enjoyed an extended period of political dominance. From 1937 to 1973, Democrats enjoyed 22 years of unified national government across twelve Congresses, while Republicans only attained unified control for two brief years during the 83rd Congress (1953–1955), at the onset of the Eisenhower administration. By comparison, 1974 to 2019 was a period of intense party competition at the national level, with frequent stretches of divided government punctuated by occasional but brief instances of unified control. For instance, from 1974 to 2019, there were 32 years of divided government, 8 years of unified Democratic control (1977–1980, 1993–1994, 2009–2010) and 6 years of unified Republican control (2003–2006, 2017–2018).Footnote 4 Hence, the decades preceding the 1970s simply provide too little national-level variation to offer any real leverage for testing our hypotheses. We also limit our analysis to these years due to data restrictions, as the available data for a number of important covariates do not cover earlier years.Footnote 5
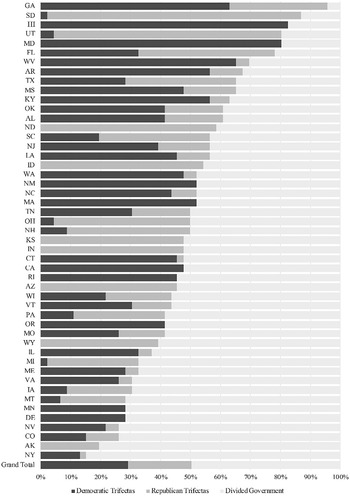
Though unified partisan control has become relatively rare in Washington, it is quite common among state governments. From 1974 to 2019, there were 1,134 trifectas out of 2,254 total state-years (excluding Nebraska), which means that roughly 50 per cent of all state-years over these more than four decades were unified (compared to 30 per cent of the time at the national level). Some states, however, have experienced partisan trifectas much more often than others. Figure 1 demonstrates that Georgia, South Dakota, Hawaii, Utah and Maryland have had unified government more than 80 per cent of the time, while New York, Alaska, Colorado, Nevada, Delaware, Minnesota and Montana have seen one party gain full control less than 30 per cent of the time. Moreover, the Democratic Party has been dominant in some states, such as Maryland and Hawaii, while the Republican Party has almost entirely controlled others, such as South Dakota and Utah.Footnote 6
Frequency of partisan trifectas, 1974–2019.

Each of these instances is captured by our main independent variable, which accounts for each type of partisan misalignment listed in Table 1. Though this variable is organized along a scale that denotes the level of partisan threat, from Republican misalignment to Democratic misalignment, we take a conservative approach and code this item as a categorical variable, with divided state government serving as the reference category.Footnote 7 We also control for a number of covariates that may influence state policy liberalism. For instance, the demand for policy activism may be stronger in states where each party maintains more robust political support. We control for variations in party strength by including the Democratic margin of victory from each state in the most recent presidential election, which is simply the difference in the two-party vote share between the Democratic and Republican presidential candidates. These data were retrieved from the CQ Voting and Elections Collection (Congressional Quarterly 2018).
Short of having full unified control, state lawmakers may also be likely to enact more ideological policy change if their party enjoys veto-proof majorities in the state legislature. Thus we include two dichotomous variables to control for partisan veto-proof majorities. Legislative professionalism is also an important factor to account for, as state legislatures with more staff and resources may have a greater institutional capacity to act on a wider range of policy proposals. To control for these differences, we include the first dimension of Bowen and Greene's (Reference Bowen and Greene2014) measure of legislative professionalism.Footnote 8 State policy should also generally reflect the ideology of a state's citizens (Erikson, Wright and McIver Reference Erikson, Wright and McIver1993). In other words, states that are more liberal should generally be more likely to enact more ideologically liberal policies. Since previous work has found evidence that citizen ideology influences state policy liberalism (Barrilleaux Reference Barrilleaux1997; Witko and Newmark Reference Witko and Newmark2005), we control for this by including Berry et al.'s (Reference Berry1998) measure of state citizen ideology.Footnote 9 Finally, union activity may also play a role in the enactment of liberal policies, as unions can organize for greater state spending, particularly on social welfare programs (Radcliff and Saiz Reference Radcliff and Saiz1998), as well as push back against business interests lobbying for more conservative economic policies (Witko and Newmark Reference Witko and Newmark2005). To account for this possibility, we rely on Hirsch, Macpherson and Vroman's (Reference Hirsch, Macpherson and Vroman2011) estimates of state union density.
We use these variables to estimate a series of dynamic panel models to test our hypotheses about how national partisan control influences ideological policy making in the states. This approach serves a number of methodological purposes. Primarily, we use a dynamic specification because we cannot assume that the relationship between our predictors and policy liberalism is static. Rather, the effect of these variables on policy liberalism in year t should influence policy liberalism in year t + 1. If a state legislature, for example, moves to make abortion rights less restrictive or makes social welfare programs more generous, these policy decisions – unless reversed – will shift the state's overall policy orientation well into the future. Therefore, including a lag of the dependent variable allows us to account for this temporal dependence, while state fixed effects account for any time-invariant state characteristics that may influence policy liberalism (such as political culture).
This model specification, however, does present some methodological hurdles. First, the use of fixed effects with a lagged dependent variable leads to biased coefficients (Nickell Reference Nickell1981). Yet this bias is not problematic for our analysis given the sufficiently long periods being captured (Beck and Katz Reference Beck and Katz2011). A second concern involves the potential nonstationarity of the dependent variable, which would make the inclusion of a lagged dependent variable methodologically problematic (Keele and Kelly Reference Keele and Kelly2006). While Caughey, Warshaw and Xu (Reference Caughey, Warshaw and Xu2017) did not find nonstationarity to be an issue with Caughey and Warshaw's (Reference Caughey and Warshaw2016) state policy liberalism measure, diagnostic tests did not allow us to reject the null hypothesis of nonstationarity.Footnote 10 Thus, to ensure stationarity, we examine the change in state policy liberalism between years t and t − 1. We demonstrate in the Appendix that our results are robust even when using the Caughey, Warshaw and Xu (Reference Caughey, Warshaw and Xu2017) approach.
Results
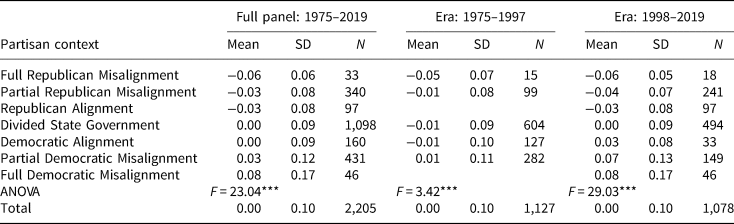
Before examining the panel results, we first calculated the average change in state policy liberalism across each type of partisan misalignment (see Table 2). In addition to examining the full panel, we also split the dataset in half and calculated averages for each era to account for heightened polarization in more recent decades. Overall, these averages provide initial support for our hypotheses. Looking first at the full panel, the mean changes in state policy liberalism are consistently in a conservative (negative) direction during Republican trifectas and in a liberal (positive) direction during Democratic trifectas. However, these average changes appear to be more or less pronounced depending on the political context: the most sizable shifts occur during periods of partisan misalignment, when the threat of counterpartisan policy action from Washington is most significant.
Mean annual change in state policy liberalism by partisan context

Note: positive values indicate state policy becoming more liberal, negative values indicate state policy becoming more conservative. *p < 0.1; **p < 0.05; ***p < 0.01.
As expected, there are also noticeable differences across eras. From 1975 to 1997, the lack of variation in national politics only produced five of the seven possible scenarios. Nevertheless, the mean changes in policy liberalism still exhibit the trend we would expect. For instance, the average change in policy liberalism in states with Democratic alignment is only −0.009, a very weak shift in the conservative direction. During periods of partial Democratic misalignment, however, the average change in policy liberalism is 0.013, which is considerably further in the liberal direction. The same is true for Republican control. During periods of partial misalignment, the mean change in policy liberalism was only −0.008, while the average change during periods of full misalignment was roughly five times larger at −0.054.
This effect becomes stronger in the more recent (and more polarized) era. With both Republican and Democratic trifectas, the mean changes in policy liberalism, as hypothesized, gradually strengthen as the partisan threat increases, and the most significant changes occur during periods of misalignment. For example, the mean change in policy liberalism during periods of Democratic alignment is 0.025, while the average change during periods of partial misalignment and full misalignment are 0.067 and 0.082, respectively. Moreover, the ANOVA F-statistics for each set of averages indicate that there are statistically significant within-mean changes in policy liberalism between the types of misalignment in each era.
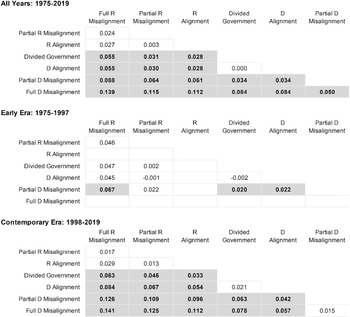
Figure 2 presents the pairwise difference of means between each political context, which measures the extent to which these mean changes in Table 2 are statistically distinguishable from each other. With regards to Democratic control, the pairwise comparisons show that Democratic misalignment is statistically distinguishable from all other categories, including both Democratic alignment and partial misalignment, in the full time period, and is distinguishable from all but partial misalignment in the contemporary era. By comparison, Democratic alignment – the least threatening scenario – is not statistically different from divided government in any specification. This does not appear to be the case, however, with Republican control. Though the mean changes in policy liberalism increase further in the conservative direction as the context grows more threatening, the effects of Republican control are not distinguishable from each other, either in the full panel or when broken down by era.
Pairwise comparisons of mean change in policy liberalism by political context.

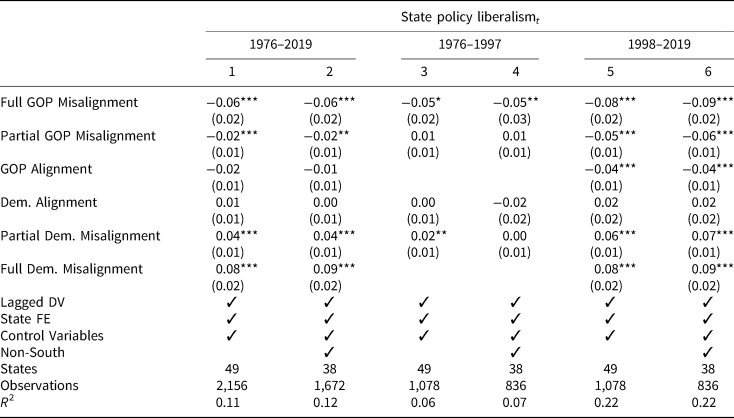
Table 3 contains the results of our panel models, which estimate the effect of partisan trifectas on changes in state policy liberalism across each political context. We again split the data into two roughly equal periods, the first from 1976–1997 and the second from 1998–2019.Footnote 11 This approach allows us to examine how these effects differ across eras, particularly in the latter, more polarized period. Models 1, 3 and 5 include all states in our dataset, excluding Nebraska due to its unicameral legislature, while models 2, 4 and 6 exclude the South, defined as states that were part of the Confederacy. This abridged set of states allows us to account for the South's political realignment from solid Democratic control and towards the Republican Party, which could potentially distort the results.
Political context and changes in state policy liberalism

Note: Panel-corrected standard errors in parentheses. *p < 0.1; **p < 0.05; ***p < 0.01.
We acknowledge that there are undoubtedly countless other ways to cut these data. Indeed, this is what Gelman and Loken (Reference Gelman and Loken2013) refer to as the ‘garden of forking paths’ problem, in which the results of an analysis are often contingent on the underlying data with which they are conducted. Nevertheless, considering the range of available data, we believe these subsets provide for the most theoretically consistent and methodologically robust examination of our hypotheses.
Table 3 shows that the politics of each partisan context are notably different.Footnote 12 Consider first the politics of partisan alignment, in which the national government is controlled entirely by co-partisans. As noted above, this scenario is the least threatening for majority-party state lawmakers and thus provides the least impetus for partisan action at the state level. The results support this expectation. Though there was not enough variation at the national level to generate results for the early era among Republicans (that is, there were no instances of unified Republican control), Models 1, 2, 5 and 6 show that Republican trifectas during periods of partisan alignment, on average, produced conservative policy shifts relative to divided government (the reference category). The coefficients are strongest and statistically significant in the contemporary era. During periods of Democratic control, nearly all of the coefficients are positive, indicating policy shifts in the liberal direction, though none reach statistical significance.
Partisan divisions become more pronounced during periods of partial misalignment, when there is divided government in Washington. Though this political context is not as problematic as full misalignment, it is still moderately threatening for state lawmakers. Amid partial misalignment, Republican state control leads to consistent and sizable policy shifts in a conservative direction across the full time period and contemporary era. Each of these effects, which range from −0.02 to −0.06, is statistically significant. However, because of the lack of variation at the national level in the early era, this is almost exclusively a contemporary phenomenon. Democratic state lawmakers appear to behave in a similar fashion when faced with divided government in Washington. The contemporary aspect of this finding provides strong support for our second hypothesis. In the early era, Democratic trifectas led to relatively weak, inconsistent shifts in policy liberalism. Yet in the contemporary era, Democratic control leads to sizable and statistically significant changes in policy liberalism of 0.06 to 0.07.
Full partisan misalignment, the most threatening scenario for state lawmakers, presents the strongest prospects for counterpartisan policy action in response to Washington. As our first hypothesis suggests, this should lead to the most significant policy activism by states controlled by the national out-party. The results strongly support this expectation. Beginning with Republican control, the coefficients are very strong and in the conservative direction across all specifications, ranging from −0.05 in the early era to −0.09 in the contemporary non-South. These effects are statistically significant in all but Model 3; the strongest effects, as expected, are observed in the contemporary period. Remarkably, the coefficients are even stronger with Democratic control, which produced liberal policy shifts ranging from 0.08 to 0.09. The effect of Democratic control in the contemporary non-South yielded the largest specification. All of these effects are statistically significant at the 0.01 level.
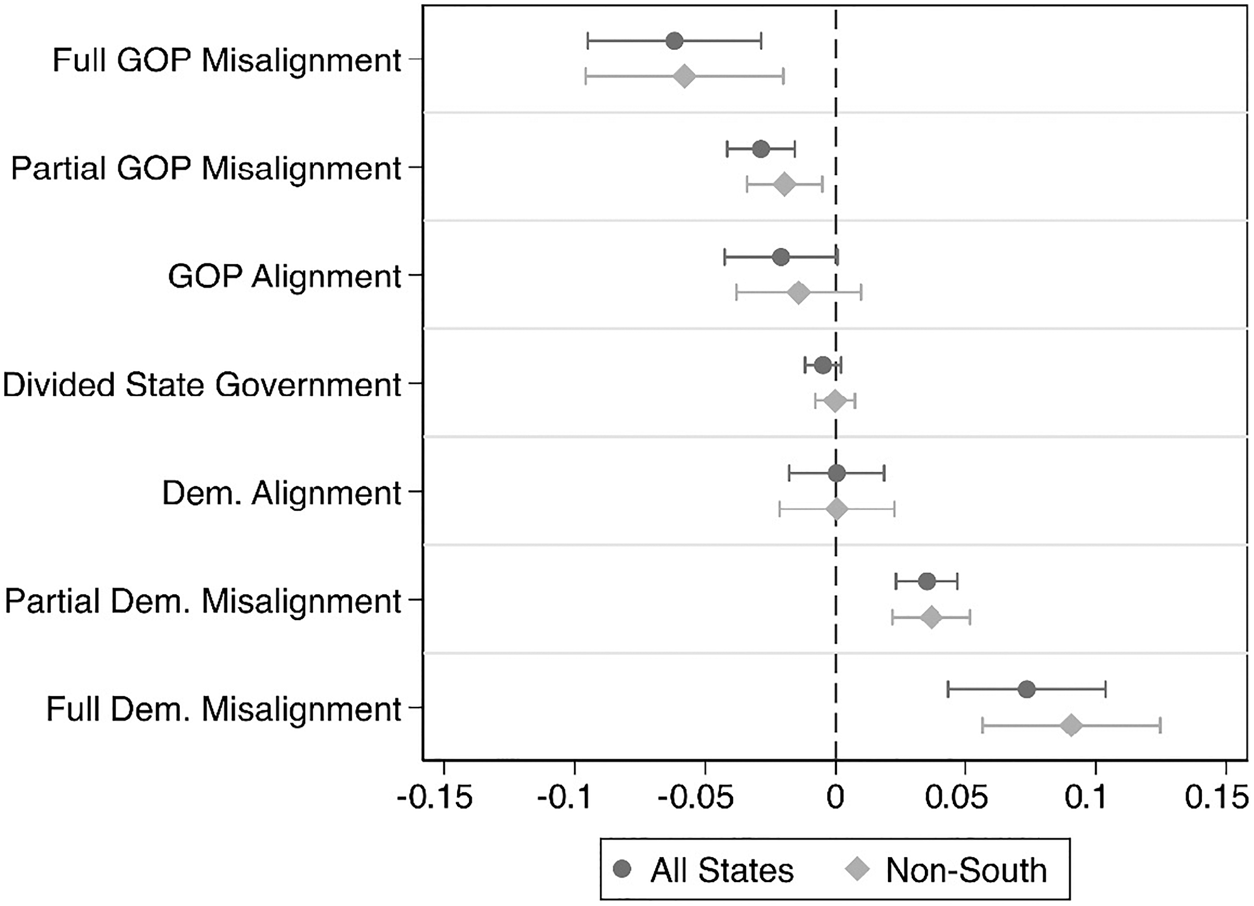
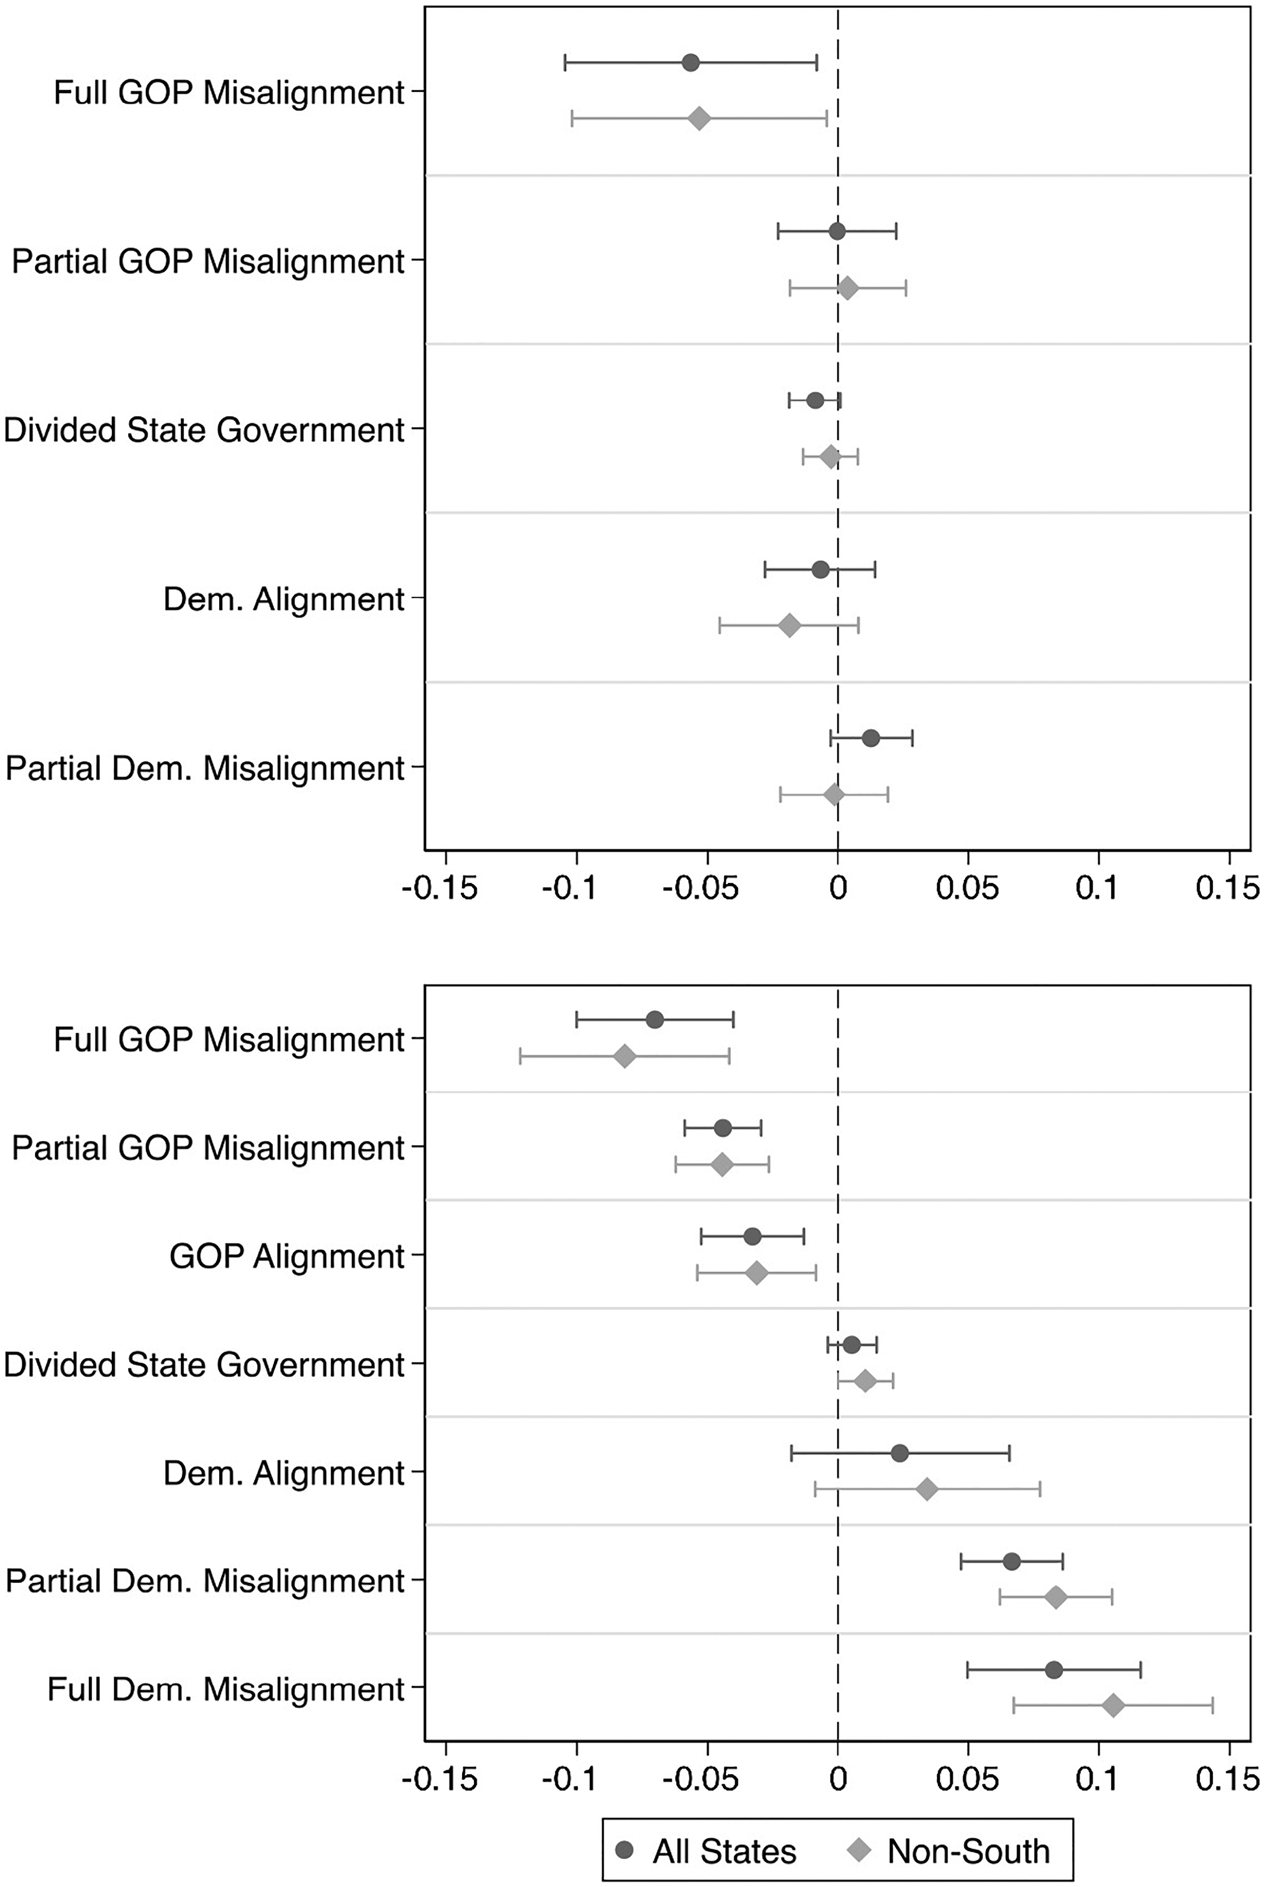
To visualize these effects, as well as examine how these effect sizes differ by era, Figures 3 and 4 plot the predicted changes in state policy liberalism across political contexts, using the model results from Table 3 and holding other covariates at their mean values. Looking first at the full time period, the effects in Figure 3 show that the main findings are robust when pooling across the entire time period. Consistent with our first hypothesis, there is a clear progression in the effect sizes: the magnitudes grow noticeably more pronounced and reach statistical significance as the policy threat from Washington increases. The top panel of Figure 4 shows that there is only weak evidence to support our first hypothesis in the 1976–1997 era. Though the strongest predicted shift in the conservative direction comes during periods of full Republican misalignment, the rest of the results are more or less constant, which suggests that the policy effect of partisan control in the early era does not appear to be heavily influenced by the national partisan context.
Predicted changes in state policy liberalism by political context, 1976–2019.
Note: 95 per cent confidence intervals calculated using panel-corrected standard errors.

Predicted changes in state policy liberalism by era and political context.
Note: 95 per cent confidence intervals calculated using panel-corrected standard errors.

As the bottom panel in Figure 4 illustrates, however, there is strong evidence to support our hypotheses concerning contemporary state policy making. First, there is a clear progression in the predicted effects: the magnitudes increase considerably in the respective ideological directions as we move from the least to the most threatening scenario. For instance, as the political context shifts from Republican alignment to partial Republican misalignment, the predicted shift in state policy liberalism is nearly 35 per cent further in the conservative ideological direction across all states and roughly 40 per cent more conservative in the non-South. Amid the more dramatic shift from Republican alignment to full Republican misalignment, the effect roughly doubles among all states and shifts 1.5 times further in the conservative direction in the non-South. Overall, this suggests that the extent to which Republican control of state government matters for ideological policy change depends, at least in part, on the national partisan context: more dramatic policy shifts occur during more threatening periods.
The effect of Democratic control appears to be even more responsive to national politics than Republican control. Like Republican-controlled states, there is a clear progression in the predicted changes in state policy liberalism as the prospect of counterpartisan action from Washington grows. For instance, as the political context shifts from Democratic alignment to partial Democratic misalignment, the predicted change in state policy liberalism is more than twice as far in the liberal direction. Amid the more dramatic shift from Democratic alignment to full Democratic misalignment, the predicted policy shifts are more than three times as liberal across both all states and the non-South, significantly outpacing the effect among Republican-controlled states.
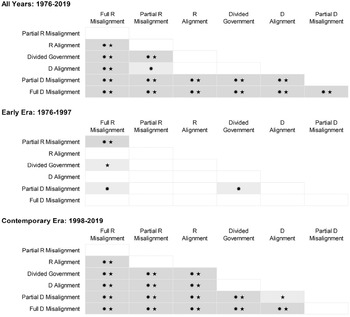
Finally, Figure 5 presents levels of significance for pairwise comparisons between the predictive margins displayed in Figures 3 and 4. These tests take the difference between each of the predicted values and then calculate 95 per cent confidence intervals around each difference, which allows us to determine whether the predicted changes across political contexts are different from each other. As these comparisons show, not only are the predicted changes in state policy liberalism strongest during periods of full partisan misalignment, but they are also statistically distinguishable from less threatening political contexts. Beginning with Republican-controlled states, full partisan alignment is not statistically different from divided government across all years, though partial and full misalignment are. Although full Republican misalignment is not distinguishable from partial misalignment, it is statistically different from alignment, which indicates that there is a clear difference between the high- and low-threat scenarios, both among all states and the non-South. Yet, as expected, the pairwise comparisons differ across eras. In the early period, most of the predictive margins are not statistically different from one another. In the contemporary period, however, the results are quite distinct. Indeed, Republican alignment, partial misalignment and full Republican misalignment are all statistically different from divided government. Moreover, while full Republican misalignment is, again, not statistically distinguishable from partial misalignment, it is distinguishable from full alignment.
Pairwise comparisons of predicted changes in state policy liberalism.
 : statistically significant among all states at 0.05 level.
★: statistically significant among non-Southern states at 0.05 level.

The results are even clearer among Democratic-controlled states. Across all years, the predictive margins of all three political contexts for Democratic-controlled states are statistically distinguishable from each other. Only full alignment, the least threatening scenario, is not distinguishable from divided government. There are stark differences, however, when broken down by era. In the early period, there is hardly any separation between the predictive margins. The pairwise comparisons for the contemporary era, meanwhile, look more like the results from the full panel. Once again, the more threatening scenarios are statistically distinguishable from divided government, while Democratic alignment is not. Between contexts, partial Democratic misalignment and alignment are only distinguishable in the non-South, while partial and full misalignment are not statistically distinct. Like Republicans, however, there is a clear distinction between the least and most threatening scenarios, as full misalignment is statistically distinguishable from alignment.
The contrast between Democratic- and Republican-controlled states during periods of partisan misalignment may be the result of a lack of national partisan competition for much of the mid-twentieth century. As described above, between 1936 and 1973, Democrats held unified control of the federal government for 23 years while Republicans only held full control for two years. Relegated to national minority status with such frequency, Republicans have relied heavily on the state apparatus to steer policy. Therefore state policy may already be in a more acceptable ideological position. Thus while Democratic-controlled states may move to codify federal policy gains that are at risk of being rolled back, Republican-controlled states may not need a more ideological response when returning to this position. Instead, they may be more inclined to defend the status quo and resist federal action by other means, such as lawsuits, bureaucratic resistance or simply refusing to cooperate with liberal policy initiatives at the federal level, rather than by adding new laws to the books.
The strength of our results should be considered in light of some additional factors. First, our model specifications, which include lagged dependent variables, bias the coefficients downward and make finding statistical significance more difficult (Achen Reference Achen2000). Thus the results presented in this analysis should represent fairly conservative estimates. Secondly, and perhaps more importantly, the key findings are robust to a wide variety of alternative specifications. As we demonstrate in the Appendix, our results remain largely unchanged when using the levels of our outcome variable rather than the first differences, omitting our control variables and extending the analysis to include additional decades, and treating our main independent variable as an ordinal variable (this last specification actually strengthens our results considerably). Moreover, our findings are also robust when omitting California and Texas, which represent the largest and, arguably, the most active liberal and conservative states, respectively. This suggests that our results are not simply driven by one or two particularly ideological states.
Conclusion
The American federal system of government not only permits, but also promotes the actions of state governments, either as a direct response to specific national policies or as part of a broader agenda that may be in stark contrast to the platform being pursued at the national level. Federal–state relations have varied throughout US history. However, as a result of increased partisanship, polarization and party competition in recent decades, the current era is characterized as ‘partisan federalism’. In this era, federalism offers an institutional framework for partisan fights. Hyperpolarization creates consequences that tie policies at the federal level to those of the states: states governed by the party opposite that of the national government have become outlets for federal policy grievances. State actions in response to national policy can take a number of forms, including filing lawsuits against the federal government, or a state's outright refusal to help enforce federal laws. A less visible, but perhaps more durable, action is the ability of state governments to enact legislation in response to the balance of power in Washington.
In this article, we argue that state governments controlled by the national out-party should be more active in pushing state policy in their preferred ideological directions during periods of partisan misalignment, as the heightened threat of counterpartisan policy change from Washington should provide an impetus for partisan action by state governments that have the ability to act. Our results provide strong support for this expectation. Examining changes in state policy liberalism from 1974 to 2019, we found that both Republican- and Democratic-controlled states have pushed state policy further in their preferred ideological directions when the opposing party has tighter partisan control over the national policy agenda. This is particularly the case during periods when the opposing party has unified control of the presidency and both chambers of Congress. We also find noticeable differences between the two parties. While the effect of Republican partisan control becomes modestly stronger as Democrats gain power at the national level, Democratic-controlled states have shown dramatically larger shifts in policy liberalism during periods of Republican national control, especially in the non-South, where the party maintains its deepest bases of political support. This phenomenon, however, appears to be largely a contemporary one, emerging in the more polarized political environment since the mid-1990s.
This dynamic has important implications for our understanding of state policy making and federal–state relations. Unlike national politics, in which divided government has become the norm, states are more likely to operate under unified government. As we have shown above, unified government occurred roughly half of the time over the four decades from 1974 to 2019. In some states, unified control occurred upwards of anywhere from 70 to 90 per cent of the time, often almost entirely by one political party. Thus, understanding state policy making in this context means exploring whether and how parties respond with unified control over the levers of state power when they are no longer able to cede elements of the policy agenda to their co-partisans in Washington.
However, the overall partisan orientation of state policies is the end product of more micro-level motivations and actions. This article does not speak to these motivations, beyond acknowledging the potential forces, such as interest groups and other actors, that may pressure politicians (individually or collectively) to act on their preferred policy priorities. For example, research has shown that in a hyperpartisan environment (such as our current form of federalism) political parties are less responsive to voter preferences in favor of fulfilling group-centric policy goals such as those of interest groups that support candidates based on loyalty to their agenda (Bawn et al. Reference Bawn2012). The ability of interest groups to select states in which their policies are best received (that is, venue shopping) is likely to create more extreme policies. Future work should examine which policy demanders are most responsible for shaping states’ liberal or conservative policy directions.
Certainly, the relationship between the federal government and the states is complex. States, to varying degrees, often rely on the federal government for both monetary and logistical support, and thus cannot simply counter all federal policies just because they have the ability to do so. For example, states that are larger and economically influential may have a far greater capacity to respond to national policies and withstand the consequences of such actions than smaller, less populous states. It may also be important to consider different types of policies where states have a clearer boundary from federal policies or a need to respond due to federal (in)action, and where they can pursue a more ideologically liberal (conservative) agenda in a less consequential manner.
Supplementary material
Online appendices are available at https://doi.org/10.1017/S0007123420000745.
Data availability statement
Replication data sets are available in Harvard Dataverse at: https://doi.org/10.7910/DVN/KRAUZP
Acknowledgements
The authors thank Frances Lee, Patrick Wohlfarth, Kris Miler, Chris Warshaw, James Garand, Nicholas Napolio, Douglas Kriner, Nathan Lovin, Charles Hunt, and the participants of the American Politics Workshop at the University of Maryland for helpful feedback on earlier versions of this article. Comments from BJPS editor Rob Johns and the anonymous reviewers significantly improved this manuscript. A previous version of this article was presented at the 2018 State Politics and Policy Conference.