


Introduction
Sea ice is a significant component of local, regional and perhaps global climate via reflection of incoming solar radiation and modification of atmospheric and oceanic boundary-layer processes. Sea ice also affects human activities in the polar regions. Both these roles – climate and operational – necessitate careful monitoring of the spatial and temporal evolution of the ice cover. However, the focus differs depending on the application. For climate, the view is long-term and large-scale. Thus, for climate studies, long-term consistent data products that provide wide coverage are most useful. In contrast, operational monitoring requires timely and detailed information. Thus, for operational use, the most useful are high spatial resolution data that can be delivered and analyzed quickly.
These different requirements lead to different approaches to sea-ice monitoring. For climate studies, long-term satellite records that are processed consistently provide the best utility, even if the data are not as detailed and accurate as shorter-term sources. Passive microwave sensors on satellite-borne platforms have provided consistent input for sea-ice concentration fields since late 1978, yielding a consistent long-term record of sea-ice extent and area that now spans over 35 years.
Operational analyses have used the best, highest-resolution imagery available to map sea ice as accurately as possible at any given time. Passive microwave data were once one of the few satellite sources of information and were a significant resource for the production of ice charts. Over the years, remote-sensing capabilities have expanded substantially, with the launch of higher-resolution optical, synthetic aperture radar (SAR) and scatterometer sensors. Ice charts created today are far more accurate than those produced in the 1970s. However, because the input imagery has changed over time, the ice-chart accuracy is not consistent over time. Even from chart to chart, the quality varies depending on the available imagery. Another factor is that in pursuit of the goal of greater accuracy, human expertise is used to manually analyze and merge data from different sources. This injects subjectivity and inconsistency over time.
Physical models of sea ice are also important tools in our understanding of sea ice, both in terms of understanding the physical processes involved and for forecasting future sea-ice states. Such forecasting occurs on timescales from daily for tactical operational support, to seasonal (1–3 months) for operational planning, to decadal and centurial for studying climate variability and change. Evaluation of models is frequently conducted via comparisons with remote-sensing fields. Our work is motivated by a need to better understand sea-ice extent fields that may find a use in model initialization or assimilation as well as in model validation.
In this paper, we compare sea-ice fields in the Arctic from two sources: (1) passive microwave sensors that provide consistent and complete daily coverage; and (2) a daily operational sea-ice extent estimate based on a human analysis of many near-real-time datasets. The higher-resolution input data from multiple sources used by MASIE (Multisensor Analyzed Sea Ice Extent) provide a nearly completely independent product with which to compare the passive microwave fields. The MASIE analysts may use Advanced Microwave Scanning Radiometer (AMSR) data, but almost always rely on other sources. Conversely, the passive microwave data can yield insights into the consistency of the MASIE product. Here we compare the two products to illustrate differences in their behavior that have ramifications for how MASIE and passive microwave products might be used in models, either for initialization, assimilation or validation. Our comparison is not meant to be an extensive validation of either product, but to illustrate as guidance for future use how the two products behave in different regimes. We discuss potential rationales for the differences based on the known characteristics of each dataset published in earlier peer-reviewed studies. A detailed investigation of the causes of the differences shown here is the subject of future research.
Data
Passive microwave
Several methods have been developed to estimate sea-ice concentration from passive microwave brightness temperatures, generally via empirically derived algorithms based on differences or ratios between the signatures of ice and open water at different microwave frequencies and polarizations. In addition to the basic algorithm, quality control procedures are implemented to remove errors. A key procedure is the use of ‘weather filters’ to remove erroneous ice due to wind roughening of the ocean and other weather factors. The filters typically remove most ice below 15% concentration, though higher concentrations can be removed during strong atmospheric events. Another quality control filter (Reference Cavalieri, Parkinson and GloersenCavalieri and others, 1999) removes false ice that can occur along the coast, especially during summer, when a sensor footprint contains a mixture of snow-free land and open water. The algorithms can interpret this water-land mixture in the footprint as sea ice. The automated filter removes some of the false ice, but some may remain.
Two such algorithms, the NASA Team (Reference Cavalieri and GloersenCavalieri and others, 1984, Reference Cavalieri, Parkinson and Gloersen1999) and Bootstrap (Reference ComisoComiso, 1986; Reference Comiso and NishioComiso and Nishio, 2008), were developed at the NASA Goddard Space Flight Center. These algorithms have been applied to a series of multichannel microwave radiometers, beginning in October 1978 with the scanning multichannel microwave radiometer (SMMR) on the NASA Nimbus-7 platform. The record was then continued by a series of Special Sensor Microwave Imagers (SSM/I) and Special Sensor Microwave Imager/Sounders (SSMIS) on US Defense Meteorological Satellite Program (DMSP) platforms. SSMIS sensors continue to operate and provide data, yielding a >35year record of sea-ice concentration and extent. Algorithm adjustments are made via intersensor calibration, to optimize consistency throughout the record. These data, from both NASA Team and Bootstrap algorithms, are calculated on a 25 km resolution polar stereographic grid, although the effective resolution based on the sensor field of view (footprint) is as low as 70 km x 45 km for some input brightness temperatures. The US National Snow and Ice Data Center (NSIDC) distributes data from both algorithms. The NSIDC Sea Ice Index (SII) (Reference Fetterer, Knowles, Meier and SavoieFetterer and others, 2002) calculates daily sea-ice extent (total area covered by at least 15% concentration sea ice) based on the NASA Team algorithm. The SII provides daily values in near-real time as well as monthly averages. Daily ice concentration fields are produced from daily averaged brightness temperature fields from all swaths within a 24 hour period.
Beginning in 2002, the AMSR on the NASA EOS (Earth Observing System) Aqua platform (AMSR-E) operated until it ceased operation in October 2011. A follow-on sensor, AMSR2, was launched in May 2012 on the Japan Aerospace Exploration Agency (JAXA) Global Change Observation Mission – Water (GCOM-W1) platform. The higher spatial resolution of these new instruments allows a higher-resolution sea-ice concentration product (12.5km vs 25 km). Because of the higher spatial resolution, there is also less land spillover error, resulting in little false ice along the coast compared with the lower-resolution sensors. Sea-ice estimates using the Bootstrap algorithm and an enhanced version of the NASA Team algorithm, often referred to as NASA Team 2 (Reference MarkusMarkus and Cavalieri, 2000), are produced from AMSR-E and AMSR2 brightness temperatures.
Multisensor Analyzed Sea Ice Extent (MASIE)
Operational ice analyses are produced by ice-charting groups in several countries, including the US National Ice Center (NIC). The NIC produces a variety of products for different users, among them the Interactive Multisensor Snow and Ice Mapping System (IMS) (Reference Helfrich, McNamara, Ramsay, Baldwin and KashetaHelfrich and others, 2007). Human analysis of all available input imagery, including visible/infrared, SAR, scatterometer and passive microwave, yields a daily map of sea-ice extent at a 4km gridded resolution, with a 40% concentration threshold for the presence of sea ice. In other words, if a gridcell is judged by an analyst to have >40% of its area covered with ice, it is classified as ice; if a cell has <40% ice, it is classified as open water. The 40% threshold is made based on the judgment of the analyst and his/her assessment of the image type and characteristics. The 4km grid was chosen to provide good detail of the ice edge and is commensurate with the higher spatial resolution sensors such as the Moderate Resolution Imaging Spectroradiometer (MODIS). At 4km resolution, what threshold is used would likely make little difference. We note that while SAR and visible/ infrared have higher spatial resolution and thus show more detail than passive microwave, they can be difficult to interpret (even for expert analysts), yielding ambiguous indications on the presence of sea ice.
The MASIE fields are assembled during the day by compiling the most useful imagery on hand. Generally, more recent imagery is preferred, though older sources may be used depending on the availability, clarity and type of imagery. Input from the previous day may also be used if needed. The final product for the day is distributed at 17.00 US Eastern Standard Time (22.00 UTC). Thus there is a time difference between MASIE and the passive microwave products. Sea ice does change over time due to growth/ melt and advection. However, such changes are generally small within one day and do not notably affect comparison between the two products.
The sea-ice component of the IMS is used to create the MASIE product (http://nsidc.org/data/masie/; NIC and NSIDC, 2010). MASIE consists of the IMS sea-ice fields repackaged in versatile formats (including GeoTIFF, KML, shapefile and PNG browse images). Time-series plots of extent in several regions and total sea-ice extent estimates are also downloadable.
The objective of MASIE is to provide daily Arctic sea-ice extent information of high quality and at high resolution to a wide base of users. The IMS product on which MASIE is based is constructed in the same manner as the NIC operational ice charts. However, the MASIE product primarily serves the operational modeling community, rather than ships navigating in the Arctic. Thus, the objective of MASIE is to map the ice edge as well as possible, rather than to ensure that ships do not encounter ice. MASIE is not well suited for tracking long-term climate (e.g. trends, anomalies), but is better suited for purposes such as input into synoptic weather models. Because of the operational focus, only the past 30 days of data are publicly available.
Comparison of MASIE and SII Total Sea-Ice Extent
MASIE sea-ice extent is calculated by summing the area of all gridcells marked as ice-covered (as defined by >40% concentration). Passive microwave sea-ice extent is calculated by summing the area of all gridcells that have 15% or higher sea-ice concentration. The use of 15% is inconsistent with the 40% threshold used by MASIE. In theory, this means that there could be regions with between 15% and 40% concentration that are detected by passive microwave as ice-covered but would be considered ice-free by MASIE. However, because of the large discrepancy in the gridded resolution (25 km for passive microwave vs 4 km for MASIE), any difference in ice-edge location due to the different threshold is likely to be negligible compared with the difference due to spatial resolution, quality of imagery and processing methods.
Daily total extents from MASIE and the SII are analyzed from the start of the MASIE product on 1 January 2006 through 31 December 2013, providing 8 years of comparison. Occasional gaps occur because an analysis was not done or the transfer of the IMS product to NSIDC failed. Single days of missing extent are filled via interpolation of the values from the day before and the day after. Two longer gaps, 2-12 April 2009 and 29 March-2 April 2011, are omitted from the comparisons.
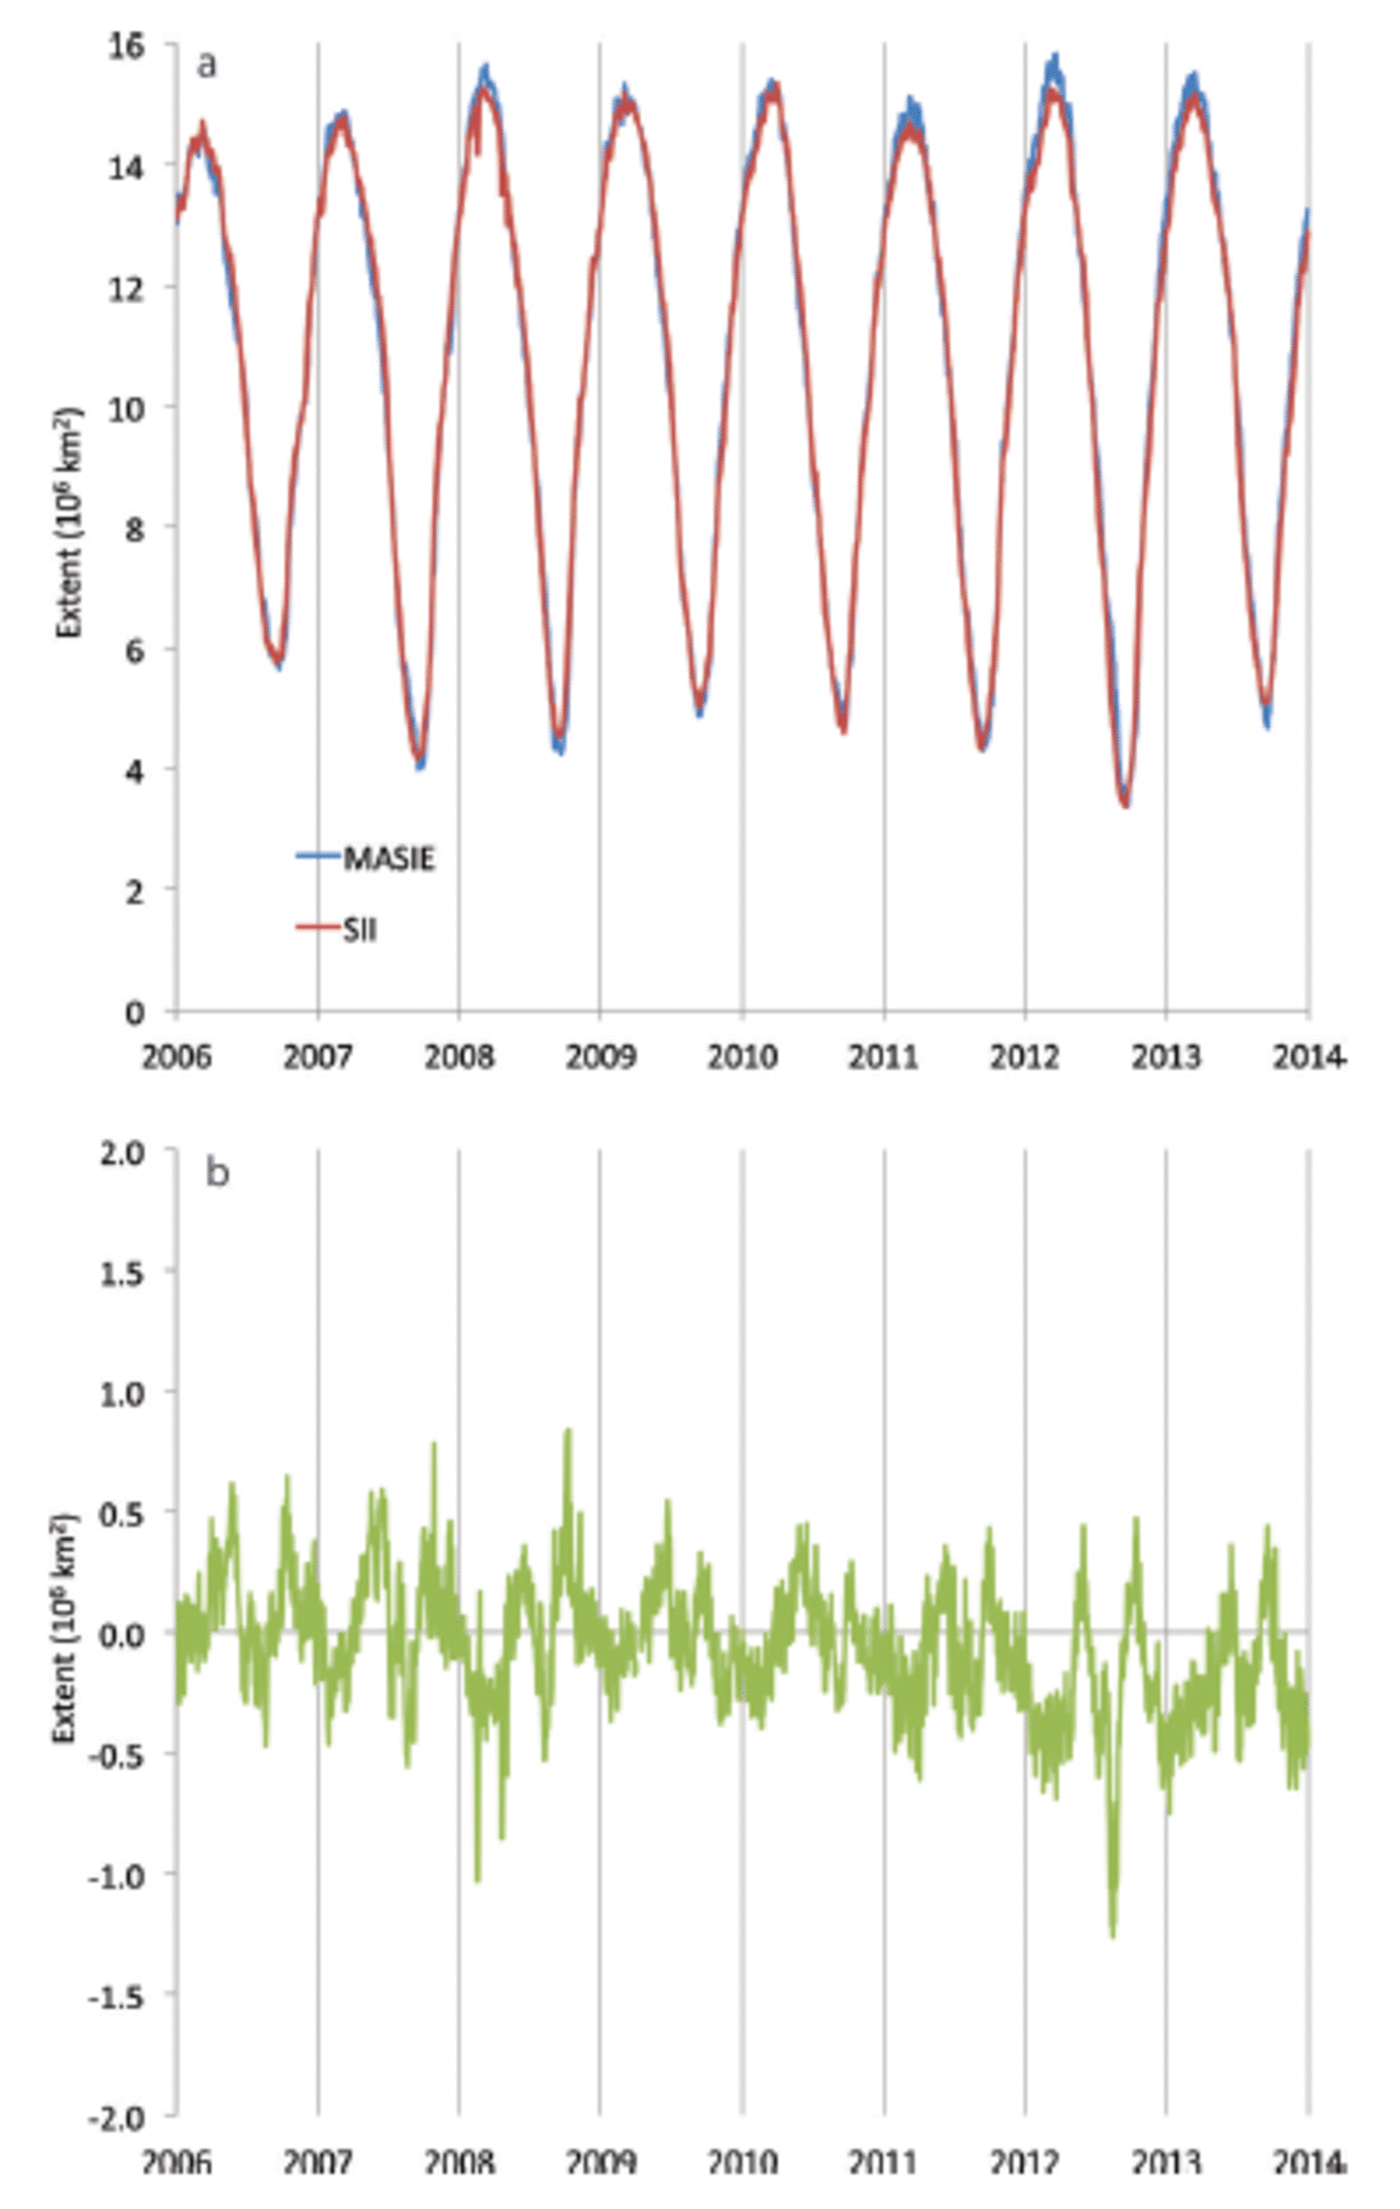
Overall, the MASIE and SII extent appear very similar (Fig. 1a), except near the annual maximum and minimum extents. However, a closer look at the difference values reveals interesting patterns (Fig. 1b). There is considerable variability in agreement between MASIE and SII, with differences of up to ± 1 x 10⁶ km2. There is also an apparent cyclical nature in the differences, with some periods where MASIE extent is higher than SII and other periods with the reverse.
Time series of MASIE and SII Arctic daily (a) total sea-ice extent and (b) total extent difference (SII – MASIE).
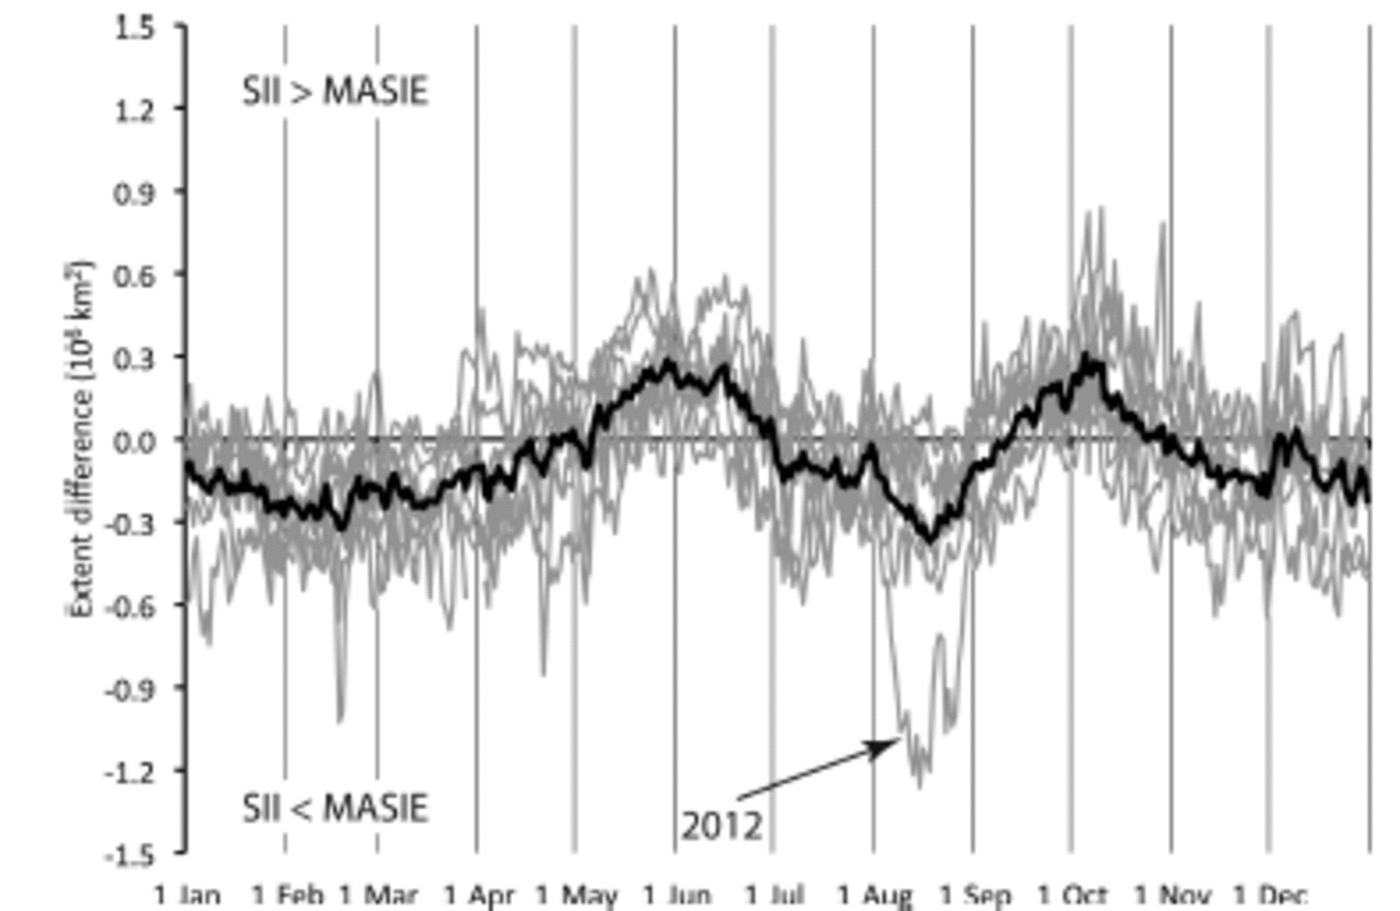
This is more apparent when overlaying the differences of the years over a single seasonal cycle, from January through December (Fig. 2). At any given time of year, there is considerable variability in the extent difference values, but a general pattern is apparent. MASIE has higher extent than SII throughout the year, with the exception of two periods: (1) leading up to the peak of the melt season (May-June); and (2) at the end of the melt season and beginning of freeze-up (late September-October).
Extent difference (SII–MASIE) for each year (thin gray lines) and the 7 year average (black lines). Values are positive for SII extent > MASIE extent.
These differences are due to limitations in the passive microwave data, inconsistencies in the MASIE mapping, or a combination of both. One compelling potential component is the resolution difference between passive microwave and MASIE. The 15% concentration threshold commonly used for passive microwave data was originally derived to provide the best match to validation data (Reference CavalieriCavalieri and others, 1991). However, due to the coarse resolution of passive microwave, the correspondence may not be optimal, depending on conditions. For example, the signal detected in the large sensor footprints may tend to ‘smear out’ the ice edge, i.e. extend the edge beyond the true location due to the mixture of ice and water within the large sensor footprints (as was found in Reference MeierMeier, 2005). Conversely a sharp ice edge within a small part of the footprint may yield a concentration below the 15% threshold and thus underestimate the edge location. Additionally, the land spillover issue can add false ice along the coast, particularly during summer, leading to higher extent in the passive microwave fields. This effect could explain periods of the year when SII extent is greater than MASIE.
Comparison of MASIE and AMSR-E Sea-Ice Extent
To investigate these potential resolution effects, extent from the higher-resolution AMSR-E sensor is compared with MASIE. Here we use the standard AMSR-E sea-ice product (Reference Cavalieri, Markus and ComisoCavalieri and others, 2003), which uses the NASA Team 2 algorithm (Reference MarkusMarkus and Cavalieri, 2000). The different algorithms can yield substantially different concentration estimates within the ice pack, particularly in summer due to the presence of melt ponds and surface water on the ice; some algorithms are more sensitive to the presence of ponds than others. However, the effect of the algorithms on the extent is less than the effect on concentration and is small compared with the effect of resolution. The coarsest-resolution AMSR-E channels used in the sea-ice algorithms have footprint sizes of 27 km x 16 km compared with 70 km x 45 km for SSM/I and SSMIS. The gridded resolution of the standard AMSR-E sea-ice data is 12.5 km. Comparing the AMSR-MASIE difference with the SII–MASIE difference provides an indication of the effect of spatial resolution, though other factors (such as melt ponds) may also play a role.
The higher-resolution AMSR-E generally improves agreement with MASIE, as seen in the seasonal cycle for 2010 (Fig. 3a). The absolute difference between AMSR-E and MASIE is smaller for much of the year, though there are periods (e.g. October) when SII yields lower absolute differences. The better agreement by AMSR-E during summer can likely be explained by the land spillover effect. During most of the year, AMSR-E has a larger extent, except in late spring and summer (Fig. 3b). This time period is when the land spillover coastal effect is largest. As noted above, the effect is much larger in the lower spatial resolution of SSM/I. There is very little error due to land spillover in AMSR-E (as can be seen in the lack of AMSR-E ice along the coast in Fig. 4-6). Day-to-day variations in the difference between SII and AMSR-E are partly explained by variation in the coastal signal, with the rest due to how SII and AMSR-E respond to changes in the ice edge. However, even though AMSR-E does not have the coastal ice that appears in SII, the same seasonal pattern in overestimation versus underestimation is seen in the AMSR-E-MASIE differences.
(a) Difference between MASIE and the two passive microwave products, SII (red) and AMSR-E (blue), for 2010; (b) difference between SII and AMSR-E for 2010. Note that the y-axis scales are different from those in Figure 2.

Comparison of Spatial Distribution of Sea-Ice Extent
The differences between passive microwave and MASIE are thus largely due to factors beyond spatial resolution that apparently have a seasonal expression. To investigate this further, selected maps of extent are shown in Figure 4 as representative examples of the different seasonal regimes seen in Figure 2. One on 15 March 2010 represents a period of the year when MASIE has a higher extent (Fig. 4a). The primary region of difference between MASIE and AMSR-E is in the Bering Sea and the Sea of Okhotsk, where MASIE maps the edge significantly farther south or east than AMSR-E (region in red). This is suggestive of the limited capabilities of passive microwave data for thin ice. The microwave emission from newly formed thin ice has a significantly different character than the thick ice. Specifically, the region near the ice edge is an ice nursery where ice formation occurs, with new ice forming and growing through several stages of new and thin ice before consolidating into thicker first-year ice. Microwave emission is sensitive to these evolving stages and such ice may not be completely detected by passive microwave algorithms (Reference GrenfellGrenfell and others, 1992; Reference CavalieriCavalieri, 1994). The passive microwave sea-ice algorithms are capable of distinguishing three surface types (one water and two ice), and the standard algorithms are calibrated for thick first-year and multi-year ice (Reference CavalieriCavalieri, 1994). When thin ice is present, the algorithms underestimate the concentration of new and thin ice, and when such ice is present in lower concentrations they may detect only open water. The underestimation of concentration and extent of thin-ice regions has been noted in several evaluation studies (e.g. Reference Emery, Fowler and MaslanikEmery and others, 1994; Reference PartingtonPartington, 2000; Reference Agnew and HowellAgnew and Howell, 2003; Reference MeierMeier, 2005). On the other hand, such regions are also prone to overestimation by ice analysts because visible/infrared and SAR imagery may not clearly distinguish between ice and water in such mixed regimes, although the MASIE product is different from navigational charts in that it is not produced to provide navigational guidance.
Map of Arctic sea-ice extent for four days in 2010, showing regions where both MASIE and AMSR-E detect ice (white), where only MASIE detects ice (red) and where only AMSR-E detects ice (green).

May is one of the times when passive microwave yields a higher extent. On 15 May 2010 (Fig. 4b), MASIE shows more ice in some regions (most notably the Bering Sea), but overall AMSR-E has a higher extent. This is related to MASIE mapping more openings in the ice near the coast and is likely due to the fact that the lower spatial resolution of AMSR-E does not capture these smaller-scale openings. Such regions are seen in passive microwave imagery to have lower concentration, but the resolution is too coarse to resolve the small openings.
By mid-August (Fig. 4c), AMSR-E detects less ice than MASIE over a substantial region in the Beaufort, Chukchi and East Siberian seas. While the pattern is similar to the winter (15 March) situation, the cause may be different. By this time of year, melt is widespread throughout the Arctic. Melt is another well-known cause of underestimation of sea ice by passive microwave sensors (Reference Steffen and SchweigerSteffen and Schweiger, 1991; Reference ThomasThomas, 1993; Reference PartingtonPartington, 2000; Reference MeierMeier, 2005; Reference Andersen, Tonboe, Kaleschke and HeygsterAndersen and others, 2007). The liquid water on the surface yields a microwave emission that has the signature of the presence of open water within the sensor footprint (Reference EpplerEppler and others, 1992), which is interpreted by the sea-ice algorithms as lower concentration. In the marginal ice zone and near the ice edge where concentration is low, the effect of melt on the surface can make the difference between a gridcell being above or below the 15% concentration threshold. Here again though, there could be an overestimation in MASIE due to ambiguities in the input data and/or a conservative interpretation by the analyst.
When freeze-up begins in mid-September (Fig. 4d) through October, AMSR-E shows considerably more ice in the Beaufort and Chukchi Seas, which results at a time of higher overall extent from AMSR-E. This is somewhat unexpected since, as noted above, new ice growth is generally underestimated in passive microwave data. The transition from the melt regime characterized in Figure 4c to the period of higher AMSR-E values occurs quite rapidly (Fig. 3a).
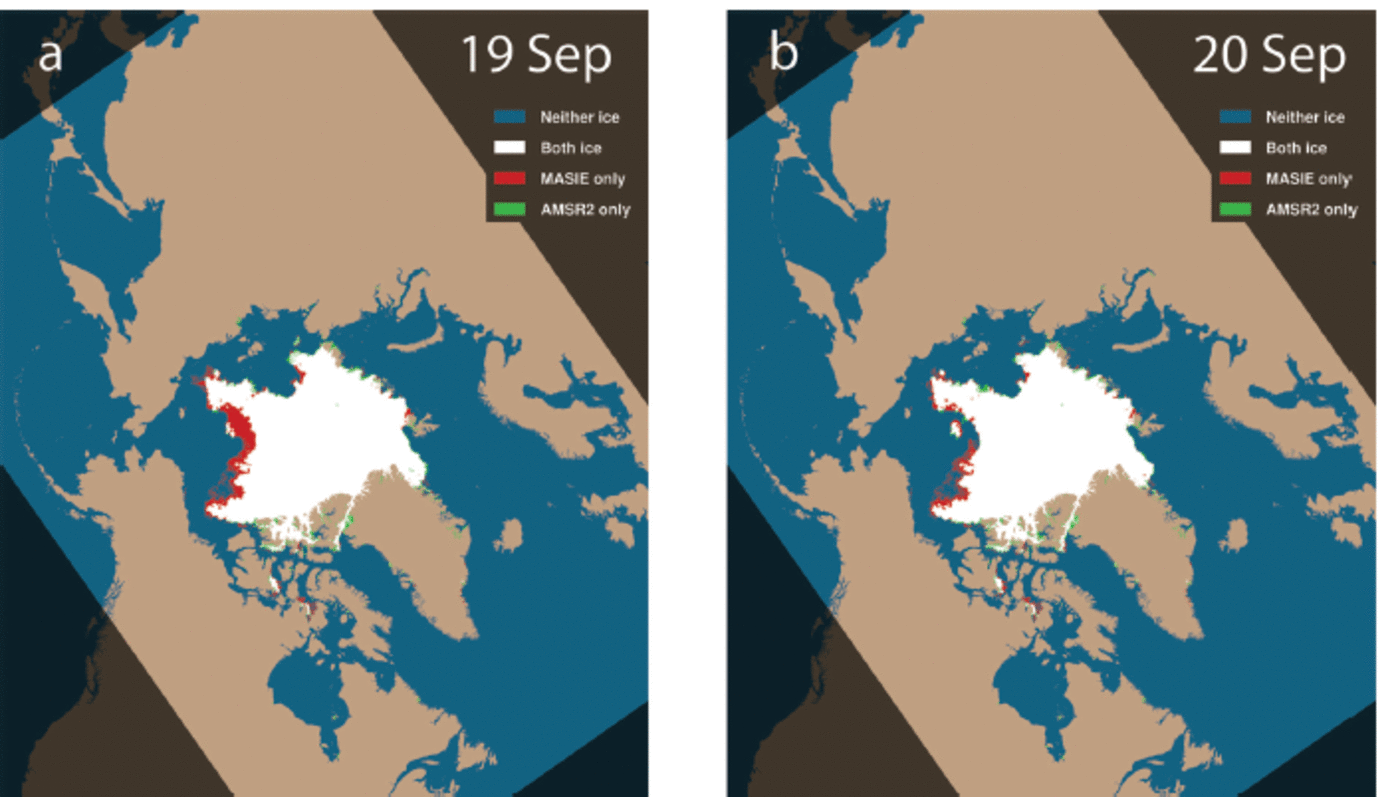
This transition is most stark in 2010, where a closer look indicates that much of the change occurs over a single day, as a large area of ice indicated by MASIE on 19 September is suddenly gone on 20 September (Fig. 5). Such a rapid change in ice extent is not physically realistic. The key may be the availability of higher-resolution imagery preferred for MASIE. The Arctic Ocean is almost always a cloudy region. But the end of summer, with considerable open ocean, is particularly conducive to heavy and persistent cloud cover because the atmosphere is cooling as the sun sets in the north while warm ocean water below provides a source of moisture. In such an environment, the ice edge may not be visible for several days. In such situations, the analyst may be conservative and reluctant to remove ice without supporting imagery. Thus, the rapid change in MASIE relative to passive microwave may simply be due to the analysts correcting the mapping when clear-sky imagery becomes available. This highlights the advantages and limitations of using operational data. On the one hand, the operational analyses use a myriad of available input, with a preference for higher-resolution SAR and visible/infrared data that generally provide a more accurate mapping of the ice. On the other hand, the amount and quality of the data vary day-to-day, and interpretation of data can be difficult, which can result in inconsistencies. In this situation, referencing the passive microwave fields would have yielded an improved, more consistent MASIE analysis.
Same as Figure 4, but for 19 and 20 September 2010, showing the large change in MASIE extent in the Beaufort and Chukchi Seas.
In early August 2012, an even more extreme example occurred when a large region of ice disappeared from passive microwave data over the course of just a few days, while MASIE continued to show the region as ice-covered. In this case, ship and aircraft observations in the region contributing to analyses by the Alaska National Weather Service Ice Desk confirmed the presence of substantial ice, validating that MASIE was correct and passive microwave was vastly underestimating the ice extent in the region. The August 2012 event is clearly linked to a strong Arctic storm that tracked through the region early in the month (Reference Zhang, Lindsay, Schweiger and SteeleZhang and others, 2013). Exactly how the storm modified the microwave signature of the ice in the region is not known, but there are several potential effects. First, the storm brought warm air from the south, enhancing surface melt. However, the main factor may have been the strong winds over a long fetch causing large waves that broke up the ice cover and possibly flooded the surface with warm saline water brought into contact with the ice by the storm (Reference ParkinsonParkinson and Comiso, 2013). This melange of small, possibly flooded ice floes amid relatively warm ocean water is unusual, and the passive microwave sea-ice algorithms are not designed to interpret such a signal as ice-covered. The effect is clearly seen through the month in a comparison between MASIE and extents from the JAXA AMSR2 sensor (AMSR-E was no longer operational in 2012) (Fig. 6) and in the extremely large negative difference in Figure 2. Early in the month, AMSR2 and MASIE show similar extents (Fig. 6a), but just a week later, AMSR2 shows a substantial decline in ice cover whereas MASIE still shows the region as being completely ice-covered (Fig. 6b). After another week, the difference between AMSR2 and MASIE is even greater (Fig. 6c). Finally, by the end of the month (Fig. 6d), the two sources come more into agreement, although MASIE still shows more ice.
Map of MASIE and AMSR2 extent for four days in August, showing the effects of the early August storm on the passive microwave estimates.

Conclusion: Implications for Modeling
Remote sensing is a tremendously valuable resource for tracking sea ice for both the operational and climate research communities. However, the needs of the two groups differ. For climate, a long-term consistent record is most important. For operations, having the best data in a timely manner is the priority. The modeling community likewise consists of operational groups (i.e. weather forecasting) and climate research (e.g. Intergovernmental Panel on Climate Change (IPCC) 21st-century projections; Reference CollinsCollins and others, 2013) that have different objectives and thus different observational needs.
Operational modelers require timely data that are as accurate as possible to initialize forecast models. In particular, an accurate ice edge is important because of the influence of the interaction of sea ice and water with the overlying atmosphere on the model fluxes. Consistency of data is also desirable for operational models, but is a secondary concern because the models are regularly reinitialized for their synoptic forecasts. Operational observations like MASIE make the most sense for these applications. However, the quality and amount of information used to produce the operational analyses vary. There may be periods when little information is available for several days before the analyses are updated when usable imagery is obtained, resulting in a discontinuous jump in extent. The use of passive microwave data can be an important contributor to provide continuity during such periods. In addition, openings within the pack ice may not be mapped in detail. Particularly in winter, such openings are sites of intense heat and moisture transfer that may have a significant influence on model outputs.
Climate modelers desire consistent long-term data to minimize model biases and better understand and potentially improve model physics. The passive microwave record is useful, but has limitations. Regions of thin ice are underestimated and if the ice cover is diffuse with low concentration, ice-covered regions may be detected as open water. Even thin ice modifies heat and moisture transfer and thus may affect atmospheric and oceanic coupling. Surface melt results in an underestimation of concentration. This should be considered when evaluating model concentrations with passive microwave data.
Seasonal forecasts are becoming more important in the Arctic as human activities there increase. Initial conditions and timelines are not as important here, but there is still a desire to use the best possible observations. However, consistent data for model evaluation are important. Seasonal sea-ice forecasting is a developing community, most visibly represented by the SEARCH (Study of Environmental Arctic Change) Sea Ice Outlook (http://www.arcus.org/search/seaiceoutlook/). Each spring the Outlook solicits voluntary projections of September average sea-ice extent. To date, the Outlook has used SII as the baseline observations. This provides a consistent baseline. However, if the goal is to be as accurate as possible, should operational analyses be incorporated? On the one hand, the higher resolution and analyzed interpretations of the imagery could prove more useful, particularly for regional assessments. On the other hand, what would the implications of the rapid changes in September MASIE extent be for comparison with seasonal model forecasts?
Regardless of the application, it is important to understand the capabilities and limitations of any sea-ice observations. In the results presented here, comparison of MASIE and passive-microwave products illustrates important characteristics of each product. Passive microwave data tend to show lower extents in regions with thin ice and ice. Operational products, while providing more spatial detail and on average higher accuracy in the ice-edge location, are subject to inconsistencies due to data quality and availability.
Acknowledgements
This research was supported by a grant from the University of Southern Mississippi, USA, and the Naval Research Laboratory at Stennis Space Center, MS. The MASIE product was developed with funding from the US Navy and the NIC. The MASIE and SII products are maintained through support by the US National Oceanic and Atmospheric Administration. We thank Pam Posey and fellow researchers at NRL Stennis for feedback and support.



